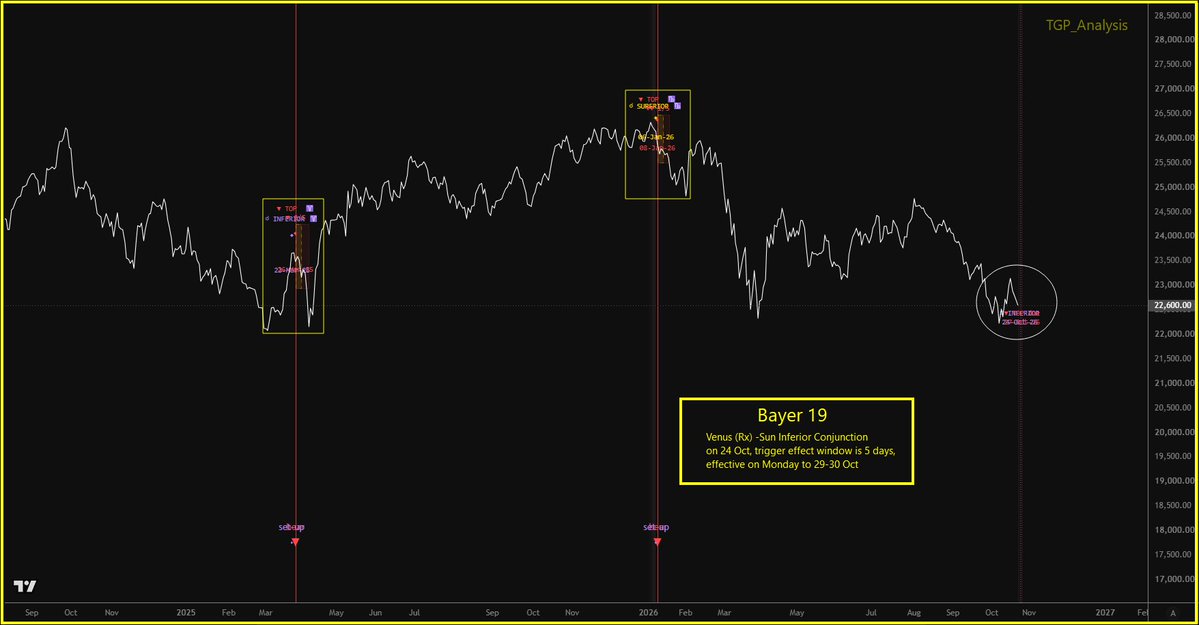
For more Gann Astro charts one can follow @TGP_Analysis..
U can learn many things deciphering the charts posted on that timeline.
Handle does not indulge in any kind of engagement.
It's purely for learning and knowledge for people looking for informative charts under Gann & FinAstro !
♦️Next time when somebody shouts "#Gann Gann #Astro Astro" with only word, and use AI created fancy titter posters on profile to fool around for engagement farming, like and retweet, ask them to explain in first place so that reader and audience on timeline gets some education and knowledge.♦️
Yes, free accounts has character limit to write, let them create a thread using the same AI from which they have created profile posters🥸.
💎🌟THE GANN "SECRETS" HIDING IN THE NUMBERS💎
🔷365 POINTS = 365 DAYS (THE ANNUAL CIRCLE)🔷
Gann's price-time squaring at the yearly scale: one point of price set
equal to one day of time, so a 365-point move balances a 365-day span.
When price and time cover the "same" distance, the market is squared on
the solar year -- the natural point where trend exhausts or reverses.
🔷18 WEEKS UP / 25 WEEKS DOWN🔷
43 weeks total = 301 days, a hair over 300, which is 5/6 of 360
(300 = 360 x 5/6). The sharper signal is that the decline is the LONGER
leg: 25 wks = 175 days, approx. 180 = half the circle. A half-circle
retracement in TIME (not price) is a textbook square-of-the-circle
correction. The asymmetry (shorter advance, longer decline) is itself
the Gann tell.
🔷THE 7-MULTIPLES🔷
18 x 7 = 126 days, sitting just under 144 (12^2, a core Gann square).
A very common intermediate swing length.
25 x 7 = 175 days, just short of the 180-day half-year Gann used for
secondary tops/tests.
Seven is the weekly base unit, so bar-count and calendar-count agree, which is why the charts can label the same swing "18 bars / 126d"
and "25 bars / 175d." Bar and day counts confirming each other is the confluence you want.
2.1 DEGREE DECLINATION
The parallel forms near 2.1 deg declination; numerologically
21 = 3 x 7, a Gann time count. It bridges the ASTRONOMICAL value (declination) to the TIME framework (weeks), which is the whole point of parallels-of-declination work.
🔷26 JANUARY -- REPUBLIC DAY🔷
A hard-anchored annual date. Gann prized reversals and retests landing on fixed calendar "seals" (anniversaries, national dates, equinox/solstice), because they recur every year and act as static timing walls independent of the swing structure.
🔷BOTTOM 5 DAYS AFTER THE EXACT CROSSOVER (26 MAR -> 31 MAR)🔷
The aspect LEADS, price CONFIRMS. The event opens the window; the low prints inside it, not on the exact date. Practical rule: prepare for the window and wait for price confirmation -- don't front-run the aspect.
🔷126d / 175d FROM THE MARCH LOW🔷
Both counts are measured forward from the March bottom -- the same swing read two ways (18 wks/126d and 25 wks/175d). Anchoring every count to one confirmed pivot is what keeps the geometry honest.
🔷PRICE LEVELS NEAR PERFECT SQUARES [ONE CORRECTION]🔷
22,182: you wrote 49^2, but 49^2 = 2,401. The intended square is, 149^2 = 22,201, which is 19 points away. (sqrt 22,182 approx 148.94) 24,774: 157^2 = 24,649, 125 points away -- almost exactly the 126-day count reappearing as price.
Note the roots: 157 - 149 = 8. On the Square of Nine, this move is approx 8 root-units -- a clean price-axis count to sit alongside the time counts.
🔷THE 2,592-POINT RALLY = 72 x 36🔷
24,774 - 22,182 = 2,592 exactly, and 2,592 = 72 x 36.
72 = 360 / 5 (fifth-harmonic circle division); 2,592 / 360 = 7.2, tying back to the 7-unit weekly base. So the rally that runs from approx 149^2 to approx 157^2 measures an exact fifth-harmonic circle count - price geometry and the square-root count agreeing.
🔷CALENDAR DATES AS SOLAR-DEGREE DATES🔷
Starting the natural year at the March equinox (0 deg / 360 deg):
Late March = 0 deg / 360 deg -- the reset point (your March low).
Early August approx 130 deg (Sun ~10 deg Leo) -- the 90-135 deg advance zone.
Late January approx 300 deg+ (Sun ~Aquarius) -- the 270-300 deg late-cycle zone.
These aren't arbitrary dates; they're solar-longitude increments off the equinox, which is why they behave as static Gann timing points.
♦️THE 26 MAR 1997 PARALLEL -- GEOMETRY, NOT GUARANTEE♦️
1997 is REFERENCE geometry. The Sun-Saturn parallel recurs on its own declination cycle, but a past instance doesn't dictate the outcome. The live question is whether the CURRENT Sun-Saturn declination window overlaps a COMPARABLE price structure (similar square-root level,
similar swing count from a confirmed pivot). Aspect alone isn't a signal -- aspect + matching price geometry is.
KEY CONFLUENCE TO PULL
The 126-day count shows up THREE ways:
(a) as a bar/time count (18 x 7),
(b) as the 125-point gap to 157^2,
(c) folded into the 2,592 rally.
When the same number recurs across TIME and PRICE, that's the strongest confluence in the whole setup.
💠Note: took AI help to articulate entire write up above to make point wise and subjectively for audience to understand and make notes only when interested.
That's another subject, since everyone comes with an objective including you and me.
but any such objective must do greater good to max people or citizens of a nation, if that's not happening, then one should make way for new blood in the subject...holding onto is not solution.
& what actually this GenZ mean ?
@Neend_Ki_Rani Discount word during festivals is the biggest scam in India.
It's used a tool against euphoria struck consumers with big Ads.
never fall for such ponxi scheme especially in Banded Showrooms or Malls.
@Nirali63175 Read again what's written carefully, then put some effort to find out, then prepare yourself for the day.
just asking in any random timeline Upar Neeche will not help u in any kind of learning !
2020-2025
Oct 24
check what happened !
will it be different this time ?
Meanwhile this time for me it's Pentagon Day from the High !
Timeline Audience,
gave u enough hints....prepare accodingle for Monday since 25 Oct is Sat.
#Nifty50
On #NSE, most awaited IPO listing as on today is #JioPlatforms
A part of #RIL.
Now #RIL CMP as on today is ₹1190
0⁰ low at 1114.90
360⁰ High at 1308.30, once rejected from this price on 04 Jun 2026, it could not resolve decisively upwards, and every time struggled or approached this level.
recent Low is at 1152.20, just away 37+ pts away from the 0⁰ mentioned.
Let's shift 0⁰ to 1308.30 as another cycle. 180⁰ from here stands at 1219.10 as high, Low being at 1188.10.
does that ring any 🔔??
I will not say that will come, this will come , Bullish/Bearish.
If any one planning to buy #RIL, u should know how to plan according post concluding the risk factors.
all this week's intra moves are to teach those #backtesting & #OI expert guys' telling them,
Bros, please comeback and let us know with your results and new learnings !!
#Nifty50#Indices
Have a Nice Day ahead !
Dhurandhar 12 when it's revealed that Hamza was an FII fund manager in USA who purposely kept on selling Sensex Nifty in 2026 so ordinary Indians could keep buying in SIP and make so much money in 2047 that we become developed nation and Rs1=$100.