The 2026 FIFA World Cup was recently coined ‘the most polluting World Cup’ due to its sheer geographic footprint. This year’s event stretches across 16 cities in Canada, the US, and Mexico.
Get data on each host city’s annual emissions impacts at https://t.co/GMzMdHuoBD.
The geographic footprint of #coal dev't is narrowing sharply. Only 32 countries were proposing or building new plants in '25 — less than 1/2 the 75 countries doing so in '14
A 🧵 on key findings from GEM’s 11th annual Boom & Bust Coal report, out today 👇
https://t.co/78dQQ0ipZ4
Key findings:
🌎 International shipping = 11% of trips but >90% of emissions.
🚢 Container ships = 2/3 of trip emissions, but <10% of trips.
Read the full analysis:
https://t.co/CE7BybbNF3
Ships sitting at the dock at the Port of Long Beach generate emissions equivalent to adding a permanent, 24/7 traffic jam of 250,000 cars to local streets. 🚢🛑
Using a database built with @ClimateTRACE, @GlobalFishWatch, and @OceanMindGlobal, @emLab_UCSB analysed vessel emissions at the San Pedro Bay port complex (Port of Long Beach and the nearby Port of Los Angeles) in near-real time.
Shifting electricity generation from fossil fuels to renewables is one of the most effective ways to #decarbonize.
We recently highlighted how one country has taken this approach and cut electricity emissions by nearly 80% over the last decade.
Which country was it?
Our May newsletter is out. This edition includes emissions data for February 2026, a story on how the world's happiest country decarbonized its power sector, and more.
Here's the full issue: https://t.co/X06zetUrKq
Subscribe for monthly updates https://t.co/twQpH2cZRo
How can forward-looking asset-level data be used to better identify opportunities and risks in corporate transition plans?
A report from Climate TRACE coalition member RMI digs in: https://t.co/4V4u49IeMT
Climate TRACE is excited to be working with KlimatKollen to support its effort to add corporate emissions data to Wikipedia pages worldwide and increase the transparency and accessibility of critical climate data.
Read more: https://t.co/ncCoBNIILh
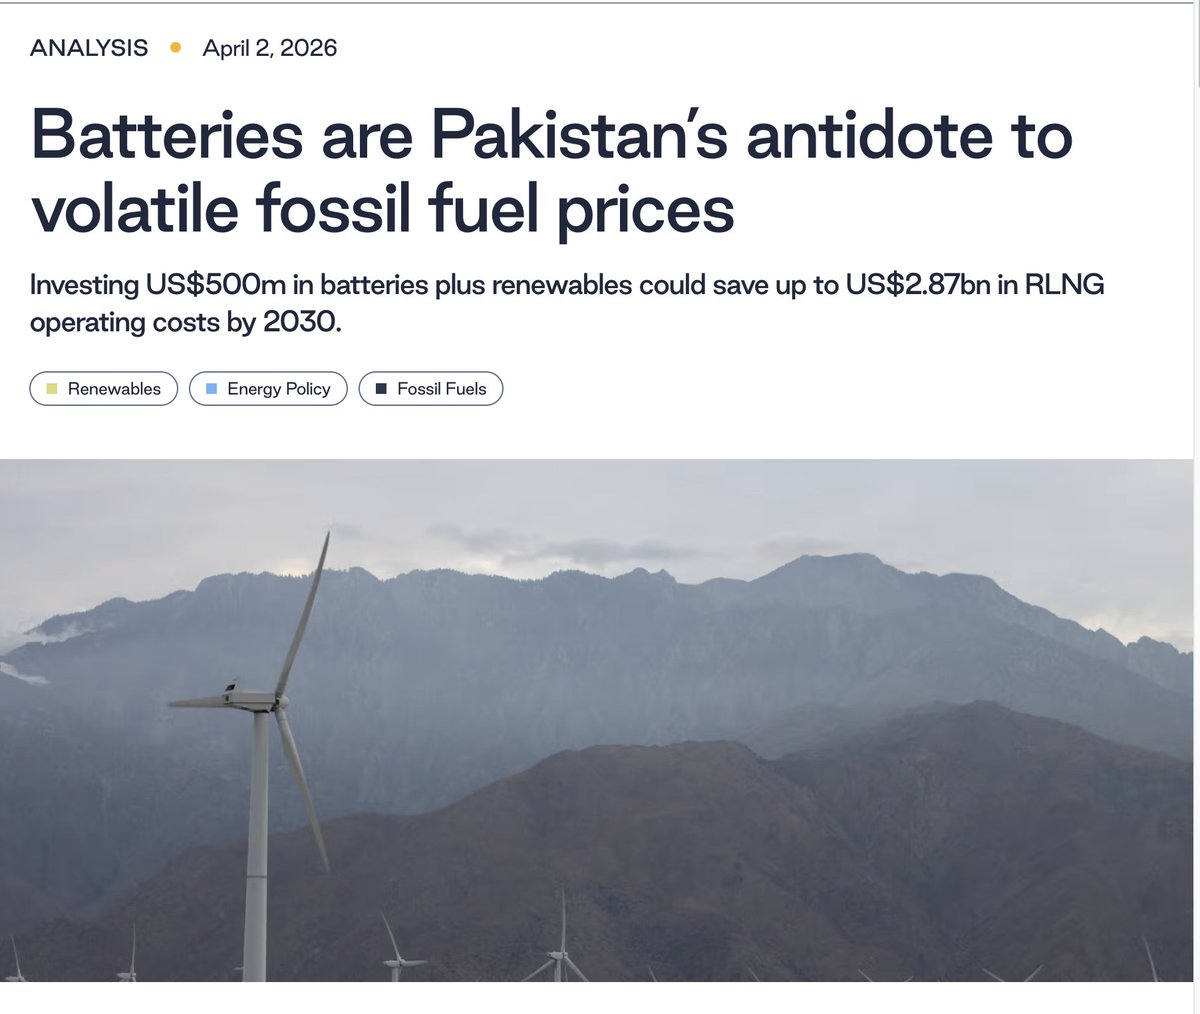
An analysis from @TransitionZero shows that, for Pakistan, investing US$500m in batteries and renewables could save up to US$2.87b in RLNG costs and avoid #emissions spikes tied to global fuel shocks.
Read more: https://t.co/ySPPoZYfQp
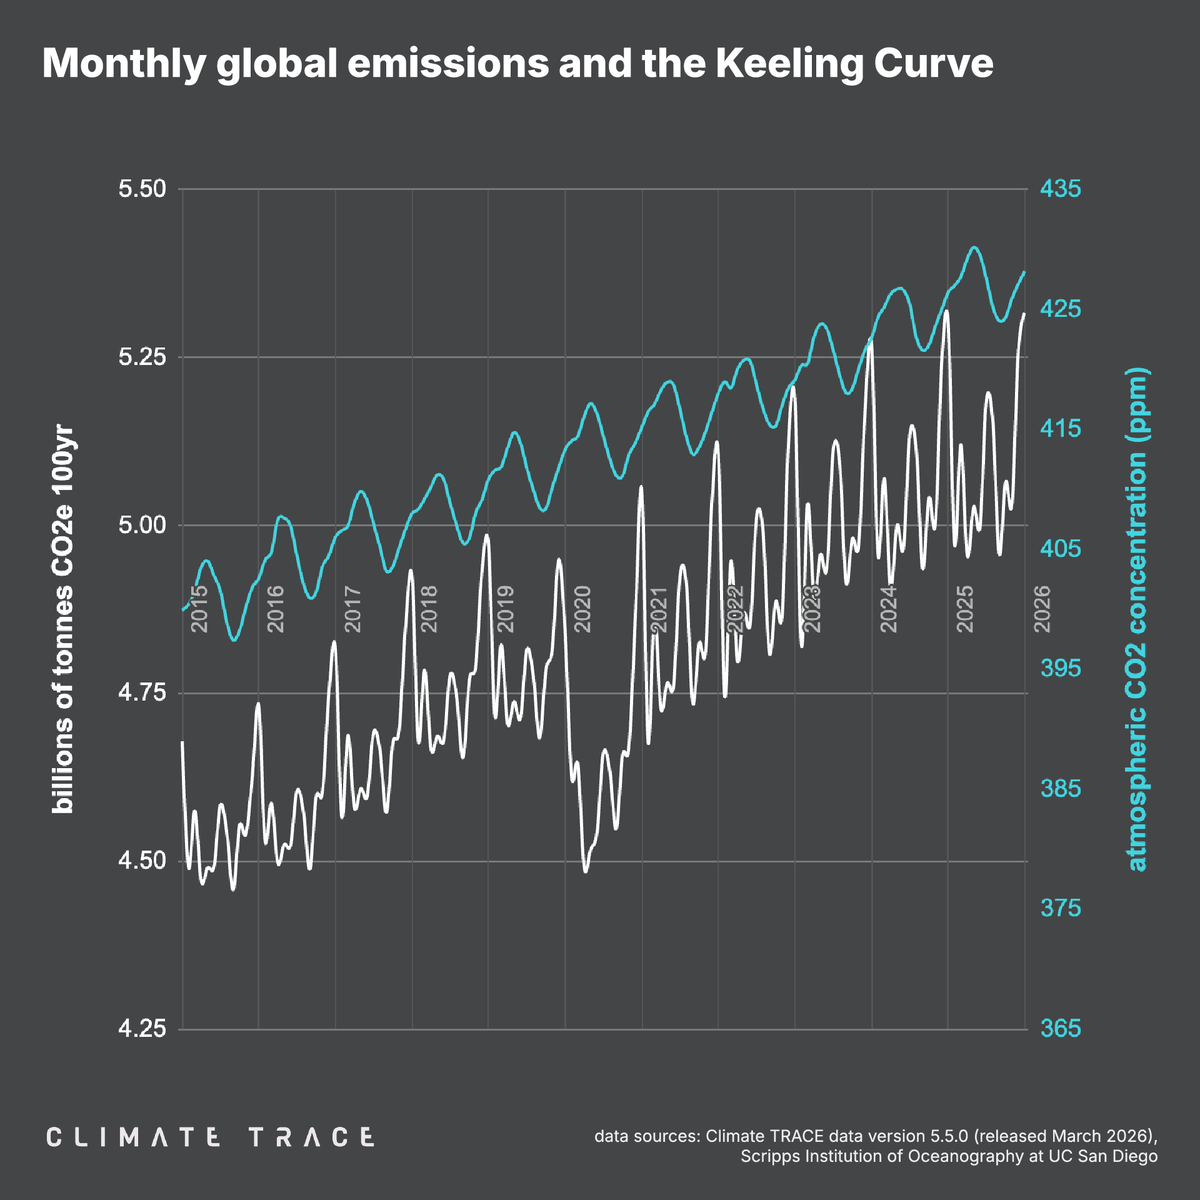
THE KEELING CURVE AND MONTHLY CLIMATE TRACE EMISSIONS ESTIMATES
This chart shows monthly Climate TRACE global emissions data (white) alongside The Keeling Curve’s monthly concentrations of CO2 (blue).
What do you notice?
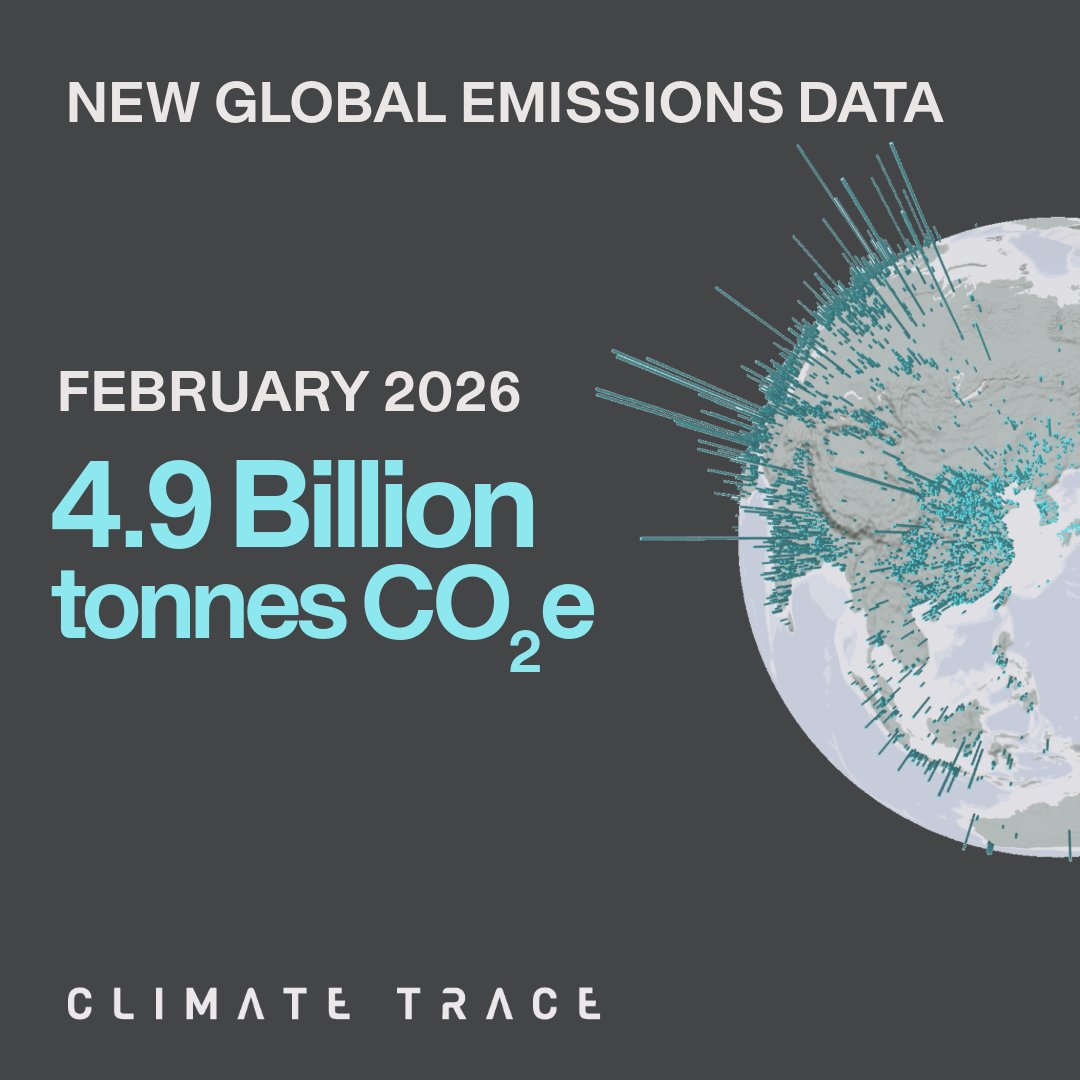
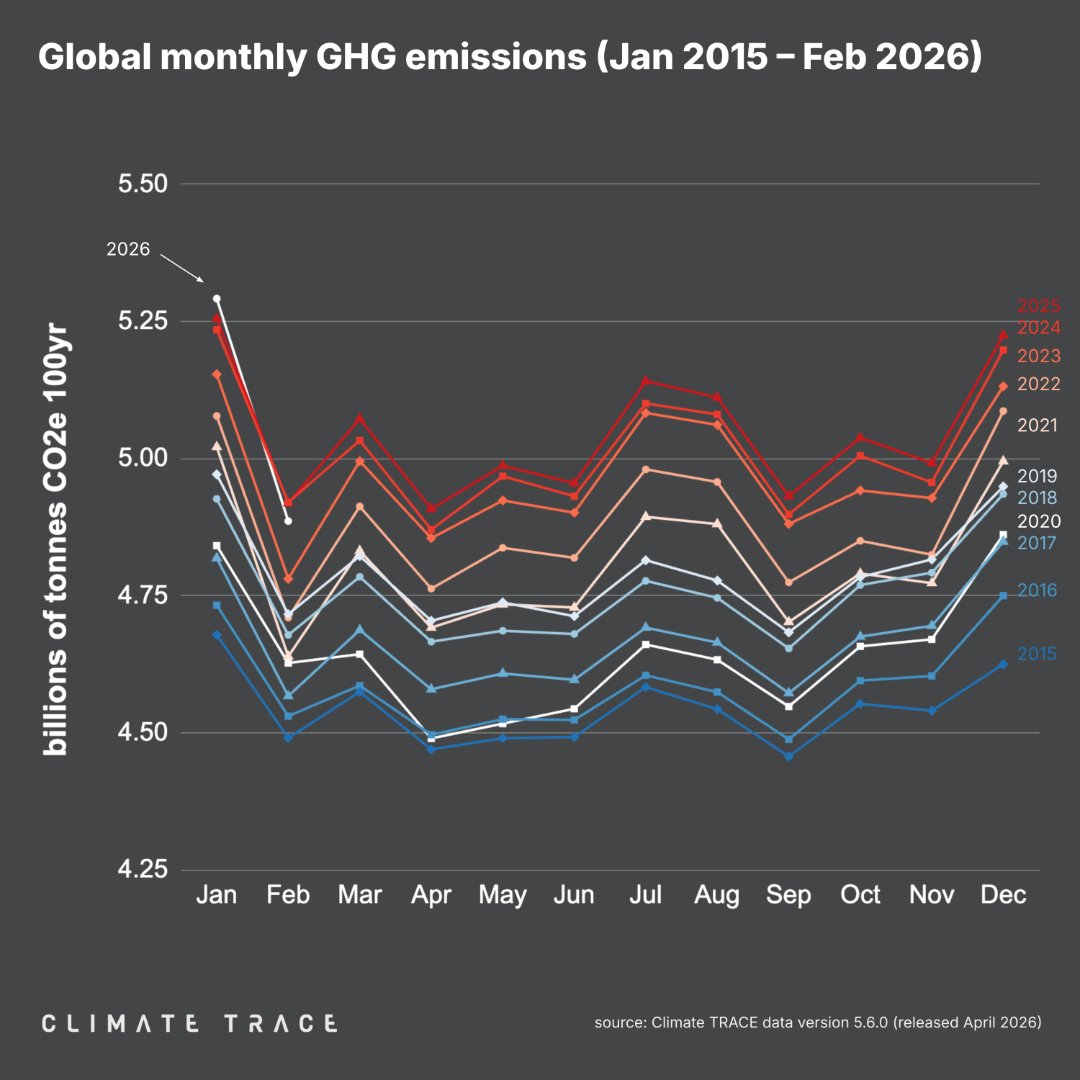
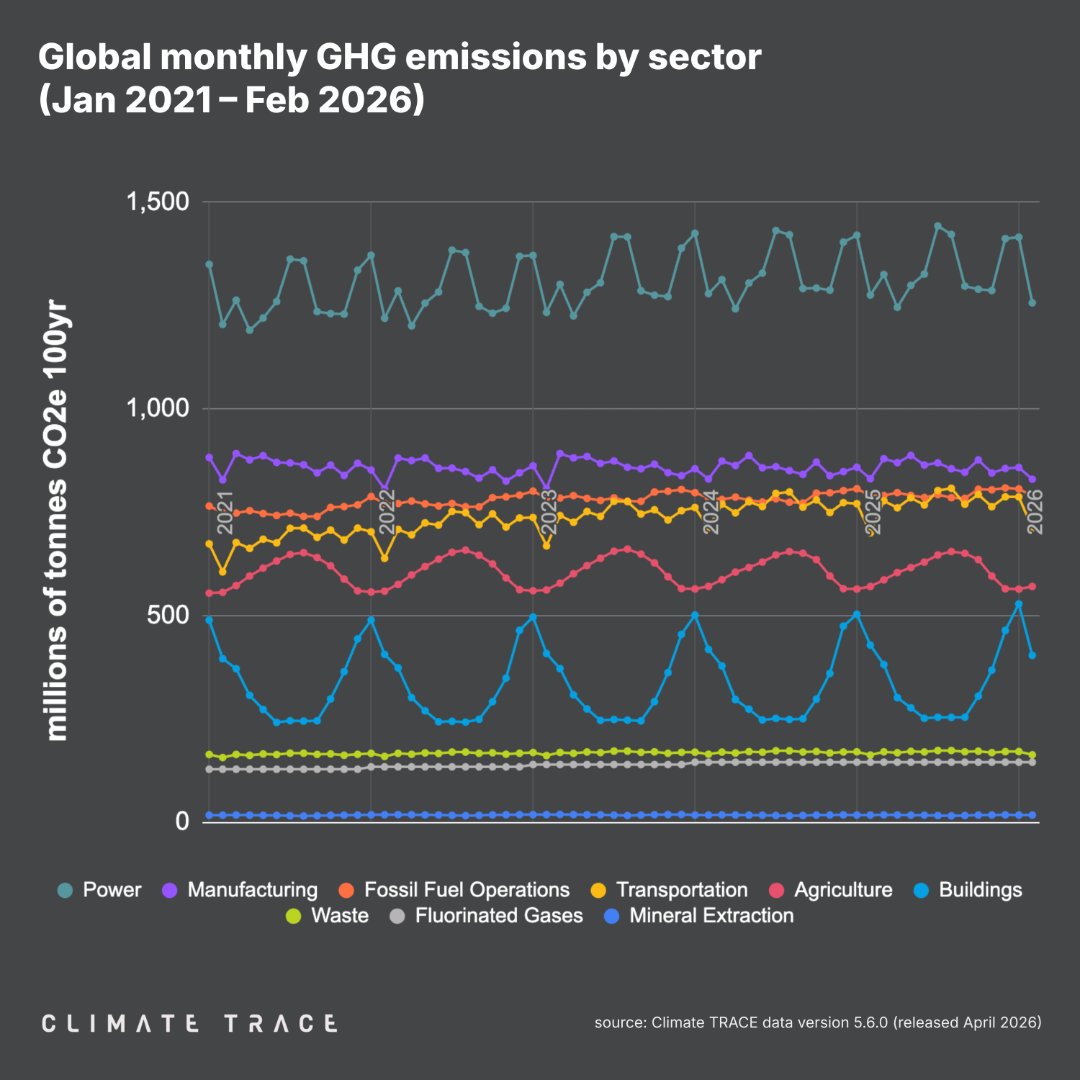
New monthly emissions data from Climate TRACE are out for February 2026, showing a monthly global total of 4.9 Bt CO2e, a 0.7% decrease vs. February 2025.
Did you catch our April newsletter?
We shared Jan 2026 emissions data, an interview with St. Louis University on cattle #emissions, how to reduce emissions from shipping, and more.
Here's the full issue: https://t.co/DmV54xovvI
Sign up here: https://t.co/twQpH2cZRo