Visualization isn’t just about communication – it’s about building better models. 📊
At ODSC AI West 2025, @ClintonBrownley, Ph.D., author of Foundations for Analytics with Python, will lead a hands-on training: Visualization in Bayesian Workflow.
🔗 https://t.co/pZ4SOyZCnx
Get updated on research news stories, gain insight through SPA’s new policy brief series, and access our comprehensive list of publications by field — all in one quarterly digest.
I got an exciting box in the mail today! Looks like The Effect: Second Edition is live! I've updated the website as well, so you can check out the changes and the new Partial Identification chapter (+ a new mini-chapter on finding material in the book) at https://t.co/UniLiO8Ds4
For the new kids in back: If you hate statistics, you'll love my free lectures. Putting science before statistics, from basics of inference & causal modeling to multilevel models & dynamic state space models. It's all free, made with love and sympathy. https://t.co/GnOYGex9Yg
Charts should speak for themselves — but too often, key insights get lost. Smart annotations help guide the story. Here are five ways to make your charts clearer, more interactive, and more impactful. https://t.co/fFEoJXcAnS
The second edition of The Effect is now available for preorder! This version has a whole new chapter on Partial Identification, a considerable update on staggered treatment and control variables in DID, and zillions of other little updates throughout. https://t.co/efpBwd7rff
This paper has been in the making for so long that eight children across the co-author group were born between the time we started and now!
But it is finally out, and you can check it at https://t.co/ZFSNCPrXsg
Introduction to Monopoly
Watch this fun video on the concept of a monopolistic market, which is a market controlled by one firm, to learn why this type of market exists and how this market structure differs from more competitive markets.
https://t.co/6U2oSGoioH
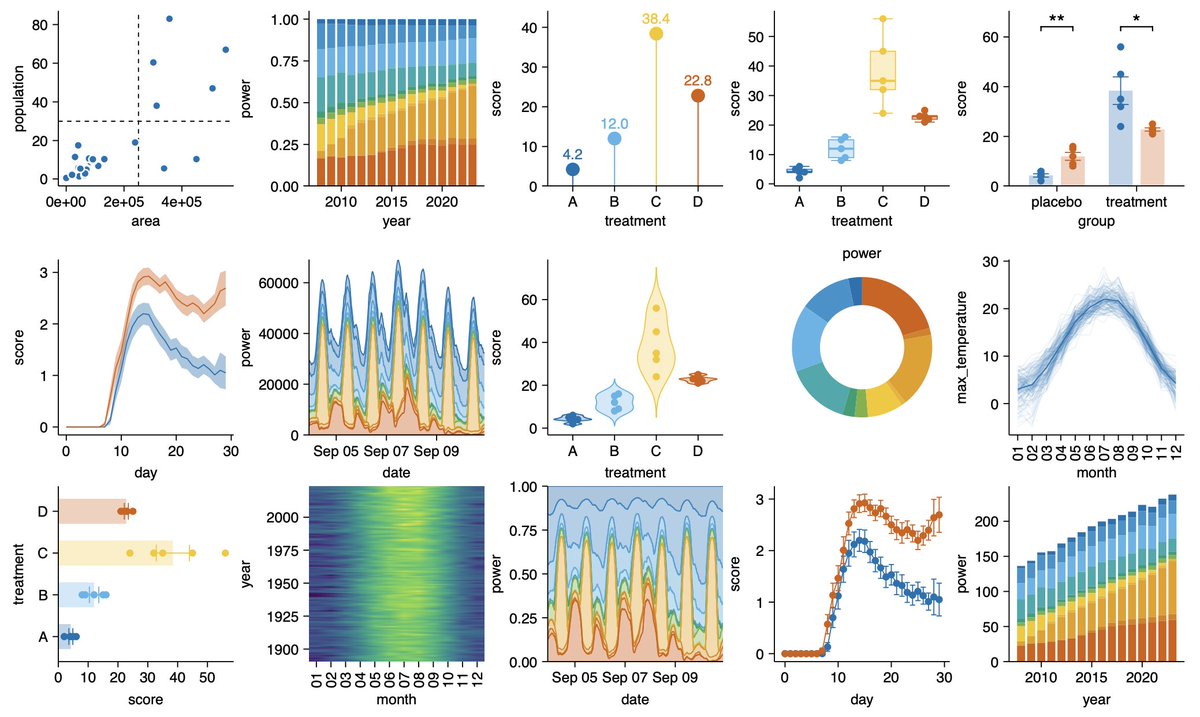
🔥 New Python library for #dataviz!
"morethemes" gives your graph a better theme in 1 line of code!
It currently offers 10 themes inspired by famous journals such as The Wall Street Journal, andThe Economist.
Learn more: https://t.co/4D4muqdkPw
Congrats @joseph_barbier !
Apply as a mentor today for our DVS Mentorship Program and provide valuable 1-on-1 guidance to the #dataviz practitioners of tomorrow.
📋Apply here: https://t.co/1LLJx8q99k
Full Mentorship details: https://t.co/xa0O7hKxes
Everybody can do code-based plotting in R 💪
Try https://t.co/j0S95nhvJa
🕊️ Free and open-source
🚀 Easy, intuitive and fast
🌈 Beautiful
Getting started guide at https://t.co/9Rc1Enbagq
#rstats#dataviz#phd
Want to create impactful data visualizations for tight spaces? Learn how sparklines, treemaps, interactivity, and responsive layouts can help charts pack a punch when you’re building with limited screen space in mind. https://t.co/OW53e6G7ZC
@ClintonBrownley, lecturer, will be a panelist in the NABE TEC session “Validating Causal Methods,” where he will be sharing The Surrogate Index methodology!
More: https://t.co/e5PzYsakyI
When you build with code you can create fast, custom data apps and dashboards — without the constraints of legacy BI tools. Explore our showcase examples to see what’s possible: https://t.co/Fb0E13IZ5y
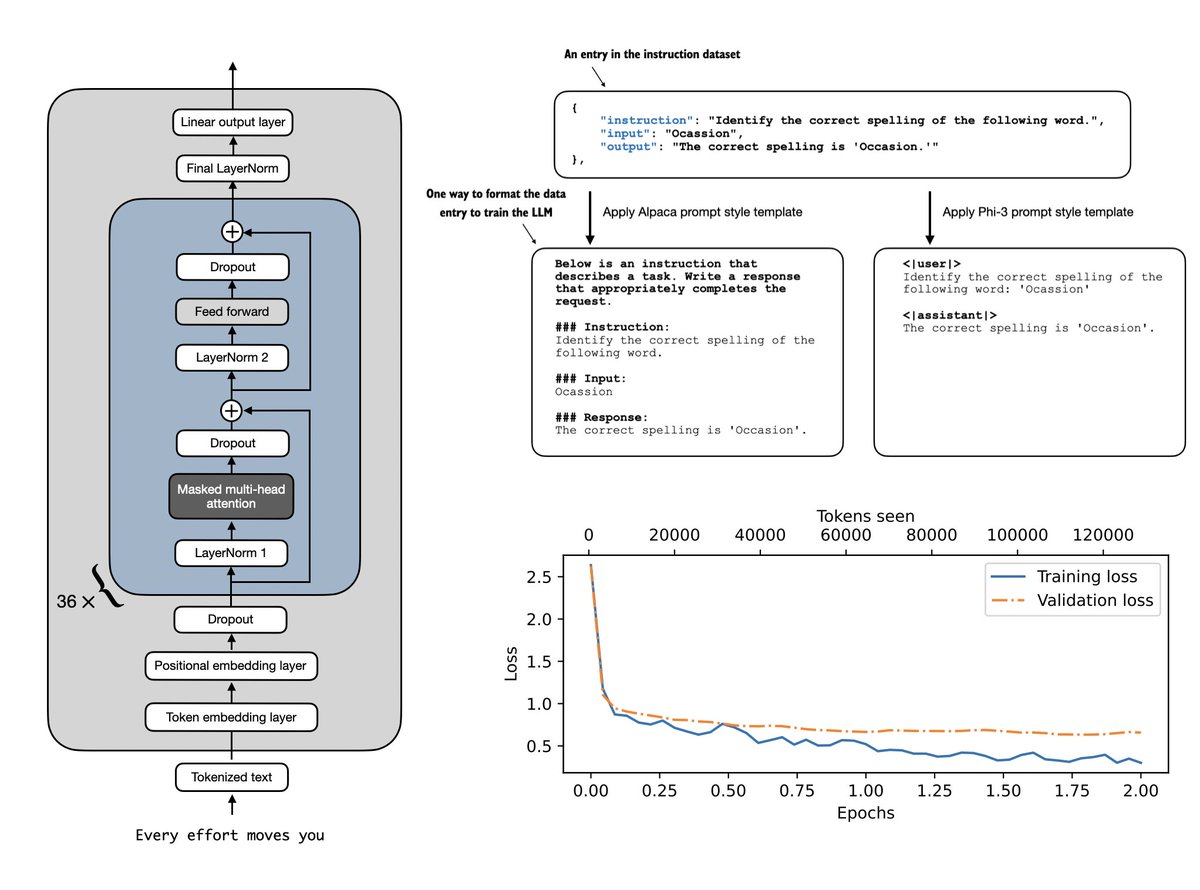
If you are looking for a resource to understand the instruction fine-tuning process in LLMs, I've uploaded a notebook to implement the fine-tuning process from scratch: https://t.co/cocpP75fAM
It explains
1. how to format the data into 1100 instruction-response pairs
2. how to apply a prompt-style template
3. and how to use masking.
Of course, this also includes a section on implementing an LLM-based automated process for evaluation.
Happy coding!