$btc
And so my next trade has been revealed...
The mouse has chased the cheese, and has been trapped.
And now we slowly but surely make our way to feed the cat.
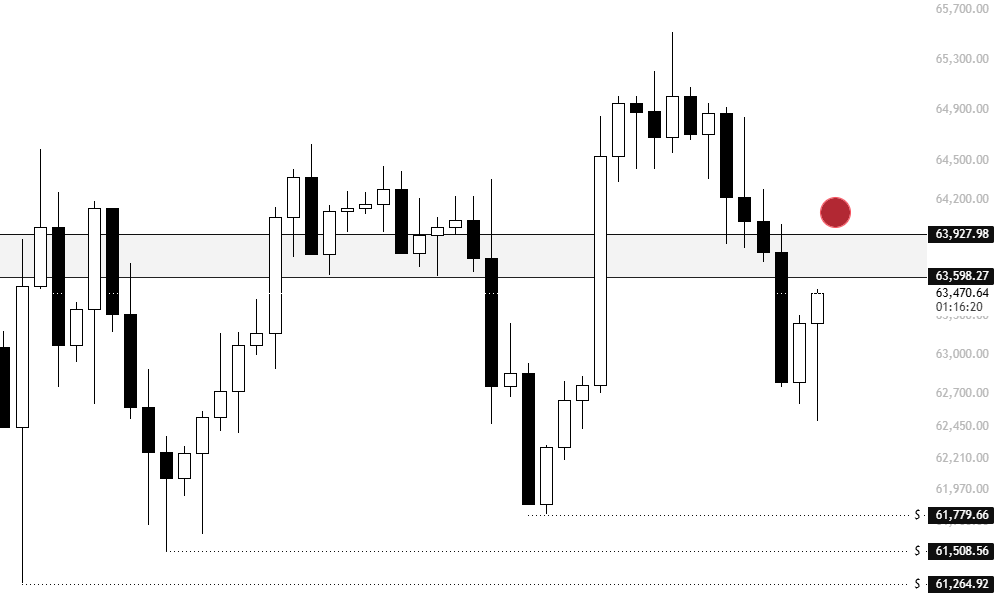
If $BTC fails to reclaim the 63.6–63.8K region, a corrective move towards 61K becomes likely.
Quite the important barrier to observe as it aligns with the weekly open.
Goat Morning
Many people will try to go long on Friday. But the long setup isn't ready! The weekend will bring better opportunities in my opinion.
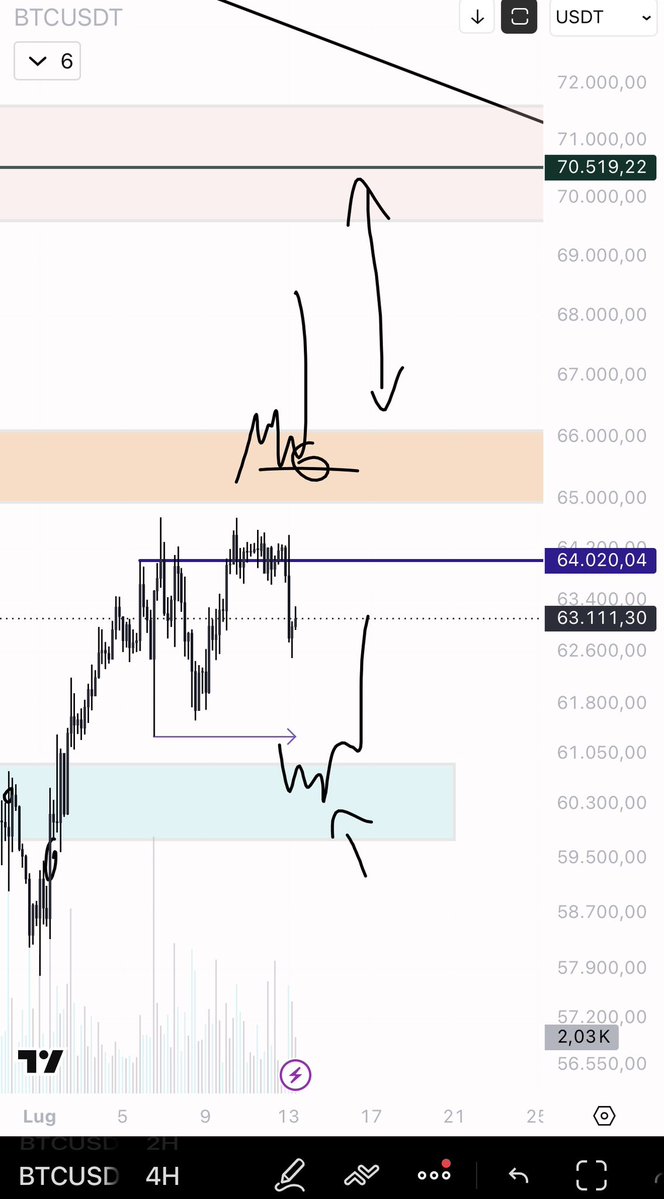
I’m looking for 61.6-61.2k for a bounce. By Sunday. If we break that, then that’s us when things can go south literally.
If you enter now, because you’re scared you will miss the move, stay defensive with tight SL.
NFA
bitcoin:native #FinancialAstrology #crypto
#MarketResearch #AstroTrading
$btc trap shorts
And touchdown! 62.8k reached ✅ local inefficiency cleared. Shorts fully closed.
Alright! The story is long, and the story is strong.
No pun intended because this story was a short. A short where we called the trap of a move down first, before we go to the final target of 66k.
We planned the trap, but most importantly, we traded the trap.
Because our community is all about live shared and making money on the moves we plan.
Exactly what we've done.
I thank you all, for playing along.
THIS IS CRAZY TO ME
TRUMP’S SOCIAL MEDIA PLATFORM WILL NOW SELL A LIVE DATA FEED TO FINANCIAL FIRMS
THIS MEANS BIG HEDGE FUNDS CAN NOW GET FASTER ACCESS TO DONALD TRUMP’S MARKET MOVING TWEETS
$DJT
i have a thesis that buybacks don't actually work
hyperliquid makes $800M annualized revenue
pump fun makes $440M annualized revenue
$HYPE trades at $65B FDV while $PUMP trades at $1.4B FDV
both teams do regularly recurring buybacks with portions of their profits from the business but they trade at vastly different ratios to their revenues
i believe the difference is not in how much actual revenue is generated by the business but instead its reflective of the trust premium ascribed to the team determined by their actions and decisions in the market, hyperliquid never overpromised anything, only focused on shipping product and emphatically rewarded their core users based on pre-determined metrics that contributed the most to the platform, the core users of hyperliquid have a very high trust rating with Jeff, & even if you believe the perps revenues are slightly more durable which maybe they are, i believe this trust premium on their execution and social alignment with the community is a major factor in why the token trades so well
in contrast, pump fun made $1B in revenue, raised another $1B in their ICO, and promised an airdrop to users that was never delivered, even though they are one of the most successful and consistent businesses in crypto, they do not have social alignment with their core userbase and therefore do not have a comparable trust premium that hyperliquid has, recently it seems they've made concerted effort to improve comms and talk to community more, i believe that if they were ever to seriously focus attention on shifting this dynamic by actually doing the airdrop they've promised and responding to the concerns of their core user base, then the token would trade 10-15x higher, as it would also likely materially increase their volume, attention, and resulting revenues on their platform
bitcoin makes $0 in revenue but has a ~$1.3T market cap, it has the greatest trust premium of any asset to ever exist, people know that there will only ever be 21M coins, and they know that the network will always continue to function no matter what to fulfill its necessary actions
this is part of what ive been talking about when i say that there is intangible value that contributes to the valuation of a business in addition to the tangible value that is determined purely from revenues and other metrics
trust, memetics, and attention are all very important and heavily underdiscussed in markets
$btc
My next trade, is a short (I just started building it now). Also reminder to keep your TP limits on the long.
Alright, with 66k is getting very close now obviously. We have been waiting for it for a long time, but we're not there yet and still have some final sell walls to breach through.
66k is a level where a lot of liquidity sits, it's an S tier liquidity level (best tier in the game).
A lot of liquidity, means a lot of money... for the market makers to grab, which is equally our goal.
Of course, they won't make it easy, perform traps in both price and time, which is why we have been front run once, and might see another local trap here.
No guarantees, they won't make it easy with a lot of money on the line...
But the good news is, the next trade I have been planning after hitting 66k... is a short regardless.
Not an aggressive short, not one to new lows, but one deep enough to hit "countertrend on the daily timeframe" territory.
So, originally, I was planning to wait and short after hitting 66k. But given very close proximity, it makes sense to start here.
Since it's 4:30 am here for me and I can't monitor price overnight, yet have high confidence in a rejection not too long after, or even before 66k as a trap on the daily timeframes, I am just going to start with half size before hitting the level, and if we hit it later, ad in the other size with the profits from the long TP's.
If the day is still young for you, it makes sense to monitor price and only enter later with the plan indeed in mind that I look to short next.
A drop is brewing, whether we get it right before or right after 66k, I am not sure.
I will keep holding my longs for 66k however as promised regardless, but I am starting a short early, call it a day today, and I will see you Tomorrow.
Chat- gpt courtesy. Not my words
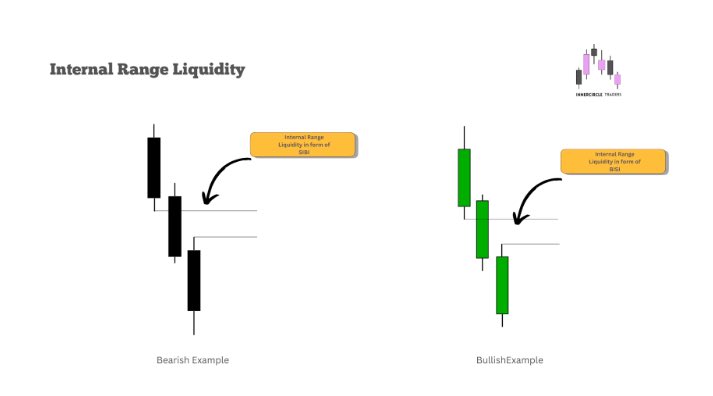
Internal range liquidity :-
But a concept you must know when range trading
Internal Range Liquidity (IRL) is a concept from ICT (Inner Circle Trader) and Smart Money Concepts (SMC). It refers to liquidity that exists inside the current trading range, rather than above the swing high or below the swing low.
Think of the market as having two types of liquidity:
External Range Liquidity (ERL): Stops resting above major highs or below major lows.
Internal Range Liquidity (IRL): Liquidity inside the range, such as equal highs/lows, old highs/lows, fair value gaps (FVGs), order blocks, and short-term swing points.
Example
Suppose Bitcoin is trading between $100,000 (low) and $110,000 (high).
External liquidity:
Above $110,000 (buy stops)
Below $100,000 (sell stops)
Internal liquidity:
Equal highs at $105,500
Equal lows at $103,000
Fair Value Gap around $106,200
Short-term swing highs and lows within the range
These are all areas where price may be drawn before it seeks the larger external liquidity.
How Smart Money Uses It
A common sequence is:
Price targets external liquidity (takes out a major high or low).
It reverses.
It retraces into internal liquidity (an FVG or order block).
From there, it continues toward the opposite external liquidity.
For example:
Bitcoin sweeps the high at $110,000 (external liquidity).
It drops into a bullish Fair Value Gap at $106,000 (internal liquidity).
Buyers step in.
Price rallies toward the next external liquidity.
Why It Matters
Understanding internal liquidity helps traders:
Identify likely retracement zones after liquidity sweeps.
Find higher-probability entry points.
Avoid chasing price after a breakout.
Combine liquidity targets with order blocks and fair value gaps for better timing.
If you’re trading crypto using ICT concepts, a practical rule is:
External liquidity is the destination; internal liquidity is often where price retraces before continuing its move.
This framework is especially useful on higher timeframes (4H, Daily) to identify the main draw on liquidity, then on lower timeframes (15M, 5M) to use internal liquidity areas for entries.
Few examples
#bitcoin
I know some of you might not have time to watch the Live we did yesterday, so maybe this quick summary of Mon-Tue might help.
Remember based on the image I posted below, this week is a week of profit taking rather than starting fresh positions, unless you are looking to DCA or position for longer term holding.
July 13 (Monday)
Viewed as a favorable day to reposition into ETH and reassess long-term holdings.
Supported by the #Cazimi window, which was described as an opportunity to begin building positions as energy starts to strengthen after pullbacks.
Intraday card: Two of Diamonds, interpreted as generally positive despite some potential for indecision or fear. The emphasis was on partnerships, financial cooperation, and constructive energy.
Overall expectation: an opportunity to begin positioning ahead of a larger move.
July 14 (Tuesday)
Considered the start of the primary bullish window.
Coincides with the New Moon, representing:New beginnings
New accumulation
New capital inflows
Potential breakout energy
Venus approaching the natal Sun was interpreted as favorable for value recognition and improving market sentiment.
The speakers specifically identified July 14–17 as a positive sentiment window for $ETH and suggested the same could likely apply to #BTC.
Overall expectation: beginning of an accumulation and upward momentum phase.
"Opportunity Monday, run it up Tuesday, Wednesday... Overall still bullish week... Be mindful of pumps, dumps, retraces, and securing profits."
For more details of the full week overview and #ETH Q3 Outlook watch the stream.
#MarketUpdates #Cryptomarket
$BTC update As mentioned earlier, trading volumes remain low, particularly for altcoins, so trade with small position sizes … $BTC – same approach; I’m not interested in the middle ground
🗞️ The Leverage trap : How BTC’s Chopsolidation Is punishing overconfident traders
BTC has entered a chopsolidation phase that's generating waves of doubt, and sometimes outright capitulation, among investors.
This is especially true for traders adding leverage in hopes of profiting from the current low volatility.
The problem is that the market keeps severely punishing those who take on too much risk, and Open Interest gives us a clear window into this.
— 💡On this chart, Binance's Open Interest is expressed in Bitcoin value rather than dollars, which neutralizes the impact of BTC's price on its valuation. —
Since the start of the year, two notable episodes stand out clearly, late January and early June.
• In the first, Open Interest on Binance rose from 104,000 to 130,000 BTC over the span of a month and a half, while price moved in a perfectly sideways range.
• The second episode followed the same pattern, with an increase of nearly 53,000 BTC over three months.
(Note that today, Binance accounts for nearly 35% of total Open Interest.)
What's particularly interesting is that each of these accumulation phases preceded the start of a new bearish leg, which then liquidated a good portion of the Open Interest that had built up.
💥 In both cases, within just two weeks, Open Interest wiped out 36,000 and 35,000 BTC respectively.
Part of this decline is obviously due to voluntary position closures. But overall, it's the corrections that are driving these liquidations, especially since funding rates on Binance had largely turned back positive at the same time.
👉 These elements suggest that some traders are trying to time the market, or chasing every uptick out of fear of missing a bullish reversal.
For now, trading against the trend and adding leverage in such an uncertain market isn't working out well for them.
And as they often say in the markets, you take the stairs up and the elevator down.
$BTC update
No change for $BTC; the levels remain the same as ever – they’re worth keeping an eye on, but there’s no interest in the middle
The triggers are clear
Ansem is right for once.. my thesis on eth:
$ETH rn look scarily similar to $BTC in 2023
$BTC 2023: hated, -70%, nobody positioned → ran from $16K to $126K
$ETH rn: hated, -65%, institutions holding 4x more BTC than ETH
and the catalysts just went live..
> Robinhood put 23M stock traders on an ETH L2, ETH as gas, bridged ETH up 70x in week 1 > Lighter did $1.6 TRILLION in perps without ever leaving Ethereum
> 40M ETH staked, 300 coins entering for every 1 leaving
If this is the same phase…
oh boy
Rotation incoming?
$BTC Sunday update:
Everything is going as projected and I don't see any reason to change bias/position so I'm sticking to the Three Taps Pattern thesis and expecting Bitcoin to trade towards the mid-range at $69k.
In fact, I see 2 new arguments supporting this idea:
🧵↓(1/5)
$BTC Key levels are already marked on the chart.
If you break through a box, the target becomes the next box.
If you fall below a box, look at the one below it.
Profitable trading is often much simpler than most people would like to believe.
$btc - htf data analysis
There is a 98.4% chance bitcoin does not go below 50k on a volatility adjusted basis.
In the light of our last post on #bitcoin's infamous electricity cost metric, where we called the bottom once again before a whopping 37% move all the way to 83k from the very bottom of 60k, called out live, all due to one of our most important signals passing by, I decided to go deeper into the analysis.
With all the random numbers thrown around, vague calls and loud celebrations of how the bears "called" this entire move proudly, and with that same conviction, expecting 50k and below, I think what people need the most right now, is at least one solid metric + data shared, describing how that happening, is a highly unlikely chance.
Good data and strong data in general is hard to dispute, but I still give the kind disclaimer that this is just my lens applied to that strong data. There are multiple ways to interpret data. With this one though, no matter the lens, interpretations are quite narrow and I think that's the very way to approach data analysis in trading.
I always find it quite funny when someone posts a chart of 3 data points, then concludes that the 4th one is a guarantee, whilst anyone who followed high-school statistics, knows otherwise, how 3 times 100% chance, doesn't mean 4th time, in a probabilistic world.
So with this post, I like to offer strong data, as well as explaining the logic behind the data (to remove the black box data-only effect), of why I am so confident we don't go below 50k.
Thank you in advance for this more extensive read. I am sure you will enjoy and some of you may feel some nostalgia every time I share a post like this given my historic reputation on these.
Without any time wasting further, let's get to it.
The logic
This one is about the miners electricity cost to produce 1 $btc. This is a vital metric. Now I know there is a lot of controverse around miners and their impact, but there is still an inflation of 0.84 per year on $btc to date since the last halving (about 164,000 BTC per year). Seems negligible but at the current price of Bitcoin (61k), that still equates to 10.7 billion dollars per year. So every year, 1/6th of the entire supply of @MicroStrategy 's entire holdings gets released into the hands of the miners, and with $btc's thin liquidity existing to this date, you wouldn't want to see that dumped on the market, certainly not every year. So yes, the miners still have a very important impact that can't be underestimated.
Put differently, that equates to @MicroStrategy's entire holdings being sold every 6 years (1.5 cycles long). If that doesn't put a different swing on the significance of Saylor's actual influence on the market, I don't know what will. And I believe I have convinced you now how impactful and in control the miners still are today. (In fact, I don't need to convince you, the production cost floor speaks for itself, still until today.)
So you don't want the miners to sell (which they mostly do, slowly, to keep their business running). But due to the current situation, they can't do that anymore, because the market has hit rare conditions, only happening a few times every cycle.
That is, the price has dropped below the average weighted electricity cost to produce one bitcoin:native per kWh.
Significant? Maybe. Let's put some logic behind it: Not only does that mean that the miners can't sell their $btc for a profit. It also means that it is simply cheaper to just log into a CEX (large funds: OTC) and buy 1 Bitcoin, instead of going through the pain of mining 1 Bitcoin. So not only does this make the miners (the people controlling $btc) not want to sell, it also makes them want to buy, because it is cheaper to just buy instead of mine them. And although I am not saying that is what they do, it is a large pressure and narrative on the market, which has driven price north without any deeper revisiting each and every time in history.
That is the logic behind why this works. Should we believe it blindly? Never. Successful trading and analysis is always a combination of data + logic and cross verifying two., never of just one or the other. But let's call it an assumption (assumption 1).
I could not write on one slate the amount of charts and videos and posts I see on X every day, only covering aspects of just one of the two, in mere lazy manner too, just throwing numbers around, or using complex risk metrics or equations without any logic behind it. It hurts the seeing eye.
All power to them however. Many are learning, many are adapting and many don't even trade, they just DCA and draw some charts telling everyone how they are "mostly right".
Short rant aside, logic by itself is strong and often missing, but we need data to verify logic (hypothesis) correctly.
Collecting data
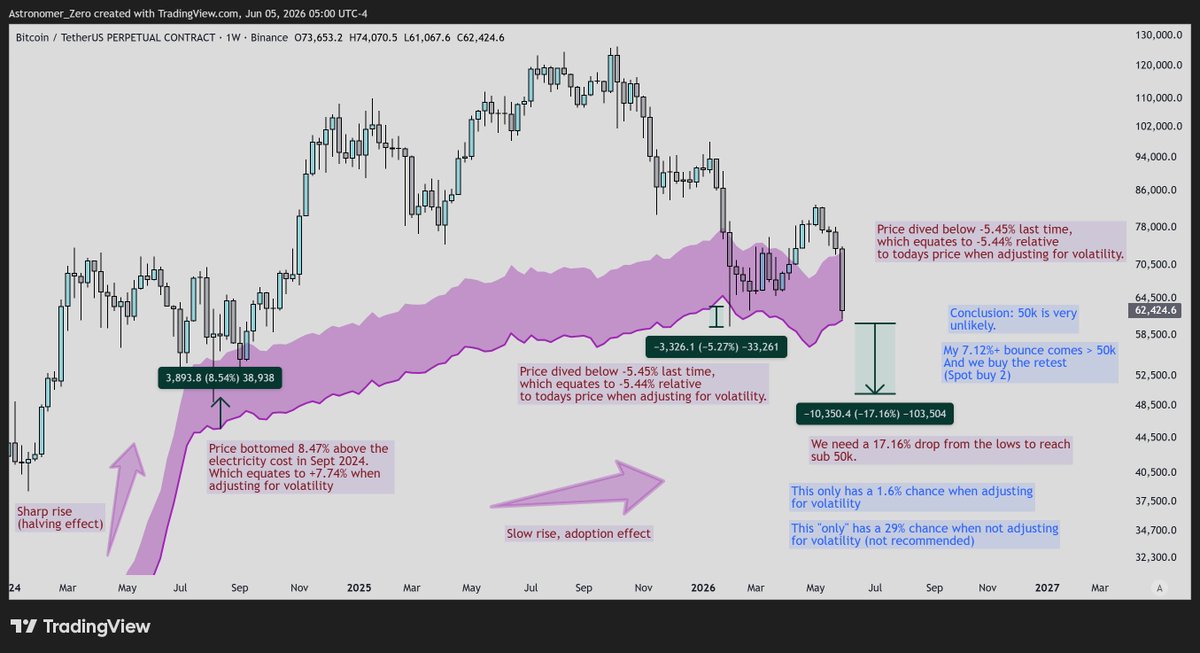
How to do this? It's very simple. To compare how price compares against the continuous band of production/electricity cost, all it takes is simply mapping it out on a price-time chart on tradingview, which is the purple band represented below, starting with the production cost and the electricity cost as the floor. The production cost is higher due to mining equipment, and that cost also varies since mining rigs are tuned to performance, therefore cost, that is why a wide band appears. The electricity cost is the floor because that is disregarding capex into mining equipment, and electricity cost per kWh (worlds average) doesn't vary much over time.
What we also notice is how the elec/prod cost rises over time, due to two drivers:
➡️The halving (every halving, it becomes more difficult to mine 1 BTC, giving a large jump)
➡️ General competition (adoption driven, more miners = more competition for blocks).
Both feed the eternal adoption cycle of bitcoin and rising floor price (unless abandonment, the opposite of adoption happens, let's hope not, but there are clear signs it's not happening).
So, mapping out the elec/prod cost and simply comparing how far price bottom above or below each time it visited, gives us a statistical reference to where price will bottom now (or where it is unlikely to go now).
It is indeed a mere statistic, because volatility is somewhat statistically driven, intertwined with cycles.
One key note: volatility adjustment is important.
On that note, collecting how far the wick goes below the band each time in absolute sense, is not sensible enough. It is to its simplicity elegant, but price also needs to be adjusted for volatility because for example daily 40% up and down moves Today are far less likely than back when $btc was priced 1$ per coin. Anyone who ever traded microcaps or penny stocks, knows what I mean. So since we are using the entire population as back test data, we must adjust price for volatility.
How to do this? By price law books, the relation depends on liquidity (how thin it is), the operators controlling the markets and the time in the year, day, week. But in general terms, liquidity thickness is linearly proportional to volatility and volatility scales inversely with the fourth root of price.
What does the latter mean? If price doubles, it means volatility decreases with the fourth root of 2, which is 1.1892...
So when price wicks below the band in say 2015 for 20%, that means today, when adjusted for volatility, that difference should be 61k/whatever the price was in 2015. E.g. $61000/$250 = 244. Fourth root of 244: 3.95. Which means the 20% wick should be accounted for as a 5.06% wick in the data.
Keep in mind, this is a relatively rough assumption (assumption 2), but one backed by price-liquidity-volatility laws.
So throughout the entire history, we collect these data points of how far below or above the wick went relative to the electricity cost at that time, and compare that to the chances of reaching 50k now, by comparing how much further price has to go below the current low, which is 61.1k, conveniently aligning with the exact electricity cost of 1 $btc today.
Using 61.1k as the in-real-time of writing this post, that puts 50k: about -18% below that.
That sums up how to collect the data.
With assumptions again renamed below...
➡️ Assumption 1: the logic of miners' impact
➡️ Assumption 2: volatility decreases with the fourth root of price (market cap).
➡️ Assumption 3: normal distribution of random volatility differences around a given price point...
... we are ready to collect the data.
Data Analysis
Next, let's look at the data, let's look at the history, where I will be taking every single data point which has reached inside the production cost band as a high timeframe bottom data-point. Because frankly, as it speaks for itself, it has been a high timeframe bottom every single time.
Below, are all the data points, sorted by date (Monday starting the weekly candle), % wicked below (-) or above (+) the lower edge of the band, and its normalized %, normalized by the square root of volatility (assumption 2).
Date │ % wick (-) or (+) lower band │ Normalized %
➡️12 Jan 2015 │ -12.46% │ -2.83%
➡️17 Aug 2015 │ -26.41% │ -5.99%
➡️1 Aug 2016 │ +1.54% │ +0.45%
➡️9 Jan 2017 │ - 12.44% │ -4.30%
➡️20 Mar 2017 │ - 7.21% │ -2.56%
➡️10 April 2017 │ -11.26% │ -4.42%
➡️10 Dec 2018 │ -26.80% │ - 13.81%
➡️9 Mar 2020 │-26.45% │ -14.38%
➡️9 Sept 2020 │ - 9.22% │ -5.98%
➡️ 7 Nov 2022 │ -0.67% │ -0.47%
➡️10 Dec 2024 │ +8.47% │ +7.74%
➡️2 Feb 2026 │-5.45% │ -5.44%
Using the volatility-liquidity adjusted %'s into a mean and assuming they are normally distributed, which, in argument with a Poisson distribution, is acceptable. Both distributions lead to similar results, but a normal distribution is more lenient towards random events revolving around a centreline (here, the bottom line of the production cost band), hence my choice.
The mean is -4.33%. The sample standard deviation is 5.99%. However, we chose every single low so we opt for the population sdev, since we do indeed have a sample of the entire population. This sdev is 5.74%.
Within this population, the z-score of 17.16%, which is the excursion needed from the current low of 61.1k (which also aligns with the perfect bottom of the band), to reach 50k, is -2.14. This equates by law of statistics: to 1.6% chance of reaching 50k, a low chance.
What if we use the non-price adjusted volatility %'s?
Then the mean is −10.70% and the sdev is 11.69%. In this case, a -17.16% lower excursion from the current low of 61.1k, to 50k, has a z-score of -0.55. This aligns with 29%.
Conclusion
The chances of never reaching 50k or below are 71% when not adjusting for price-volatility and only 98.4% when adjusting for price-volatility. Let's be realistic, and choose the exact middle between both chances, which is 84.7%. Still a very high chance, more than enough to look for aggressive involvement.
So personally, regardless of whether my assumptions are correct (98.4% chance of no 50k), or are not (71% chance). I personally believe expecting lower than 50k is hopeful and wishful thinking to its peak. And this valley is just a mere opportunity for the bears to be loud and proud again, before absolutely missing the chance of lifetime opportune buying prices once again.
We take a look at the timeline, we take a look who is clearly and loudly bearish, who is loudly bullish, we mark them on the chart, and realize when extrapolated to the entire world, both are majority disfavouring proper data, in my humble view.
We look some months down the line, and see where we will be, and whether talking generally bullishly, or generally bearishly was the smartest move to flourish in the world of crypto finance.
Robinhood tokens are now available to trade on the Pumpfun app!
- No bridging
- Trade seamlessly in SOL
- Trade every trending Robinhood token
Never miss out again, no matter the meta. Only on the Pumpfun app.