Tesla will make everyone regret in hindsight. Mark this post.
$TSLA
Base 1 did that
Base 2 did that
Base 3 will do the same
Dollar cost averaging will beat timing the market.
If you like a stock, you should buy it at different times consistently.
Tesla will hit $2500 in next 2-3 years at minimum.
Goldman Sachs manages $871 billion. They are HEDGING with healthcare and staples, while keeping big money in AI.
They are bullish, but staying cautious.
Here's what they've been buying and selling recently.
What they're buying:
1. $SNDK +475%
2. $CRWV +275%
3. $TSM +82%
4. $MU +50%
5. $GE +44%
6. $MA +27%
7. $PLTR +26%
8. $GOOG +25%
9. $KLAC +24%
10. $META +23%
11. $COST +23%
12. $ABBV +19%
What they're selling:
1. $BABA -39%
2. $SHOP -32%
3. $LRCX -30%
4. $WBD -29%
5. $TSLA -15%
6. $CSCO -14%
The pattern is clear:
- All-in on AI infrastructure. Memory, foundries, semi equipment.
- Dumping China exposure. Trimming crowded trades.
- Quietly loading consumer staples as hedges like Costco, Walmart, Coca-Cola, P&G.
- They are also broadening outside of tech like Mastercard, Visa, Johnson & Johnson, Abbvie
$BB $NOK $SWKS $QRVO
5G is absolutely critical moving forward. NOT because of phones.
But because AI needs FAST, low-latency networks.
AI needs to flow from data centers into factories, robots, vehicles, and many other apps.
This is creating FRESH demand for telecom equipment.
These companies have real exposure to 5G network equipment, components, and security infrastructures.
Setting up quietly on an uptrending cycle.
The rule of three every trader should know:
Markets
→ Markets give you 3 pullbacks every year → 3 VIX levels to buy at: 30, 50, 70 → 3 types of pullbacks: 5-10% normal, 10-20% correction, 20%+ bear market
→ 3 phases of a stock move: accumulation, markup, distribution
Execution
→ When a stock pulls back, use the T+3 days rule to start accumulating → 3 valid stop loss levels: horizontal support, swing low, moving average undercut → 3 things to check before every trade: entry, stop, target
Psychology
→ 3 emotions that kill accounts: fear, greed, FOMO → 3 mistakes that blow up traders: no stops, oversizing, revenge trading → 3 phases of trader development: Year 1 pain, Year 3 clarity, Year 5+ mastery
"Golda Meir was born in Russia. Has the right to live here, in this area of Jerusalem, more than me?"
Yassar Arafat on the brutality & oppression waged by Israel on the people of Palestine. #Israël
C🇮🇱NCER
$KTOS $AVAV $ONDS $UMAC
Drone companies trying to setup.
Volume is confirming this is a local low (for now).
Now needs to hold this structure and find buyers.
Could take a few weeks to fully confirm. Still early.
$ETHBTC shows a setup that closely resembles that 2017 bullish explosion in Ethereum and altcoins over Bitcoin.
Right now looks to be the absolute final stages before another similar explosive move!
Time's ticking 💣...
This is by far the most profitable setup on Nasdaq.
I want every trader to know it.
Double bottom and rounded bottom on $QQQ.
I've played this pattern over and over for years. Never gets old. Never stops working.
Don't trust me - go backtest it yourself. Pull up the chart. Look at every instance. See for yourself.
People who follow me will never have to worry about money issues again if they master this one setup.
#Bitcoin
Because the move up wasn't as strong as last cycle
And the move down wasn't as vicious as last cycle
I think we're at November 2022 capitulation
But a lower low is not a guarantee
Millionaires are MADE by buying the DIP on an uptrending market.
Space stocks have TOPPED short-term. But it's STILL in an AMAZING weekly uptrend. This means you can BUY the dip.
Here's the best space stocks to buy:
1. Redwire $RDW
2. RocketLab $RKLB
3. AST Spacemobile $ASTS
4. Sidus Space $SIDU
5. Archer Aviation $ACHR
6. Joby Aviation $JOBY
7. Firefly Aerospace $FLY
8. Intuitive Machines $LUNR
9. Planet Labs $PL
10. Satellogic $SATL
11. BlackSky Technology $BKSY
12. Spire Global $SPIR
All my buy and sell signals in Discord @ https://t.co/GaBnArAAKe.
So here's the reality:
"Stock at highs: I'll buy the dip"
" Stop drops: Nah its going lower"
Fix for it:
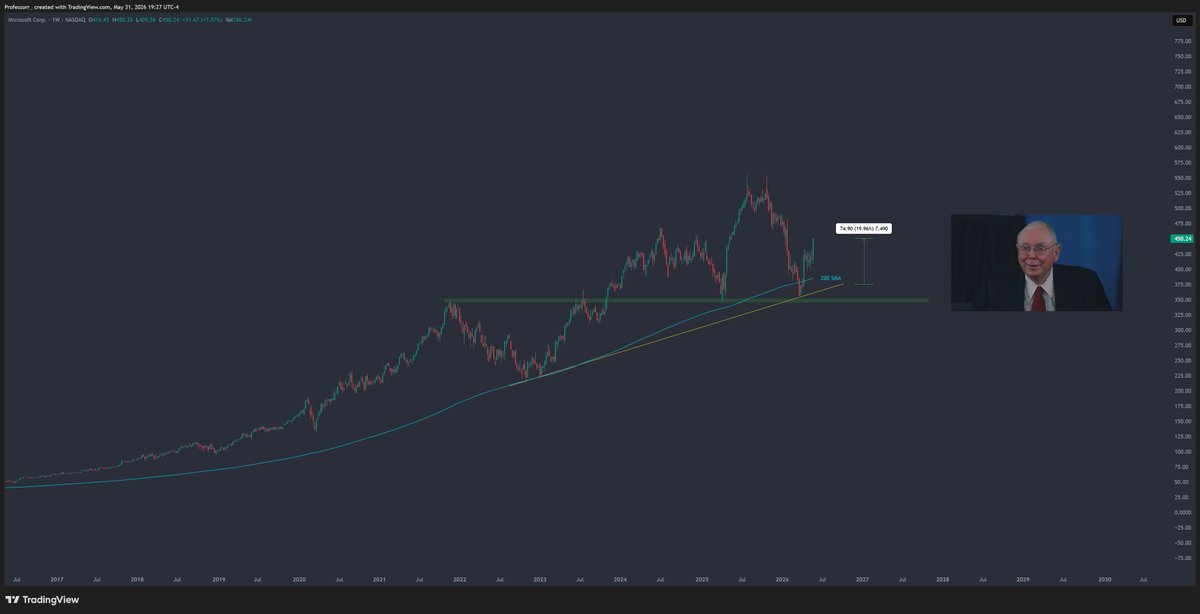
"If all you ever did was buy high-quality stocks on the 200-week moving average, you would beat the S&P 500 by a large margin over time" - Charlie Munger
$ORCL touched it. +45%
$MSFT touched it. 20%
How to spot a stock’s “change of character” moment:
The answer is in the chart. 6 pizza slices:
1) the trend flips
- lower highs + lower lows...flips to...higher lows + higher highs
- the first HL is typically my signal
- look @ the annotated chart I attached
2) relative volume
- shows increased interest
- well above 200day RVOL baseline
- subtle, but clear volume pops at first
3) breaking of key levels
- price pushes though prior resistance
- prior resistance becomes support
- breakout holds
4) laggard to leader
- former laggard starting to lead
- relative strength improves
- feels like it's always green on red days
5) new reaction to pullbacks
- dips bought faster
- pullbacks become shallower
- can't break support
6) bad news is shrugged off
- negative headlines are still bought
- strong reactions to any news
- any selling = absorbed
It's all about behavior. Know when it changes.
Example below: $NBIS.
Feel free to bookmark + keep,
- Luc
The cycle bottom target for the Golden Ratio Multiplier is dropping, currently at about 36k.
We're watching Level 1, which has been very accurate for previous cycle bottoms.
This is slightly below the Realized Market Cap bottom of 42.5k. I think the real answer is probably something in between.
My Favorite Weekly Chart Setup: The "Character Change"
This is my go-to setup for getting into new uptrends early, and it’s something I use only on weekly charts.
The CC (character change) is all about patience and waiting for clear evidence that the trend has shifted.
⚠️ If you’re looking for quick trades or need to be active, this might not be for you, because these require you to sit after you get in for a long time and let it do it's thing.
Why Weekly Charts?
Weekly charts smooth out a lot of the noise you see on daily charts. They give you a bigger picture and help you see the trend more clearly.
What Is the "Character Change" Setup?
This setup is about recognizing when a stock is transitioning from a long downtrend to the early stages of an uptrend. It’s all about waiting for specific signals on the weekly chart that show that it is highly likely the long-term trend is now up.
Here’s what I look for:
1. First Higher Low
After a long downtrend, I look for the stock to make a higher low on the weekly chart. This alone isn't enough but it's our first piece of evidence that something might be up.
2. HUGE Volume with a Price Pop
The other thing to look for is a big surge in volume with a strong price move. This shows real institutional interest. This is our second piece of evidence. You have a higher low + it's first massive push. After this I have confidence the birth of a solid new trend is likely in place.
Also the 1st or 2nd above can happen in any order you just want to see both.
3. New 10 Week respect
The way you get a low-stress entry with incredible R/R is by waiting now that you have the evidence of a true CC on your side. The 3rd piece of the puzzle where you can enter with extremely low risk if it doesn't work is when you see the stock start to respect the 10-week moving average for the first time.
Example 1: $APP
Let’s look at APP, which had a huge run after showing this setup and my second best trade of all time.
1. Volume Pop: First, I noticed a big volume spike, but I didn’t jump in just because of that alone, not enough evidence.
2. First Higher Low: After the volume pop, the stock pulled back a bit and made a higher low. That’s when I got interested. As it made that higher low, it started respecting the 10-week moving average.
3. Holding the 10-Week: It then resumes its move being supported clearly by the 10 week again. That’s the final confirmation needed.
APP took time to develop this setup. Even though it might look like dumpster diving, since these are weekly charts, the downtrend is long over before it becomes a buy. From there, it just kept riding the 10-week line up , giving you multiple chances to add to your position if you caught it or many chances to get in.
Example 2: $PYPL (currently developing)
PayPal was dead money for a long time, making lower lows. Then early this year we started developing a CC.
1. Higher Low: This grinded sideways but still ended up being a big higher low.
2. Volume Pop: Here we get a big price push on volume. Technically we had a few before the higher low was confirmed, and an entry could have been established after the higher low because the risk is so low. But this was the clear Volume pop.
3. New 10W Respect: This is final evidence for me, off the volume pop the weakness is supported by the 10W for the first time. Super low risk entry and you can see if this is a real long-term trend then we are still very early.
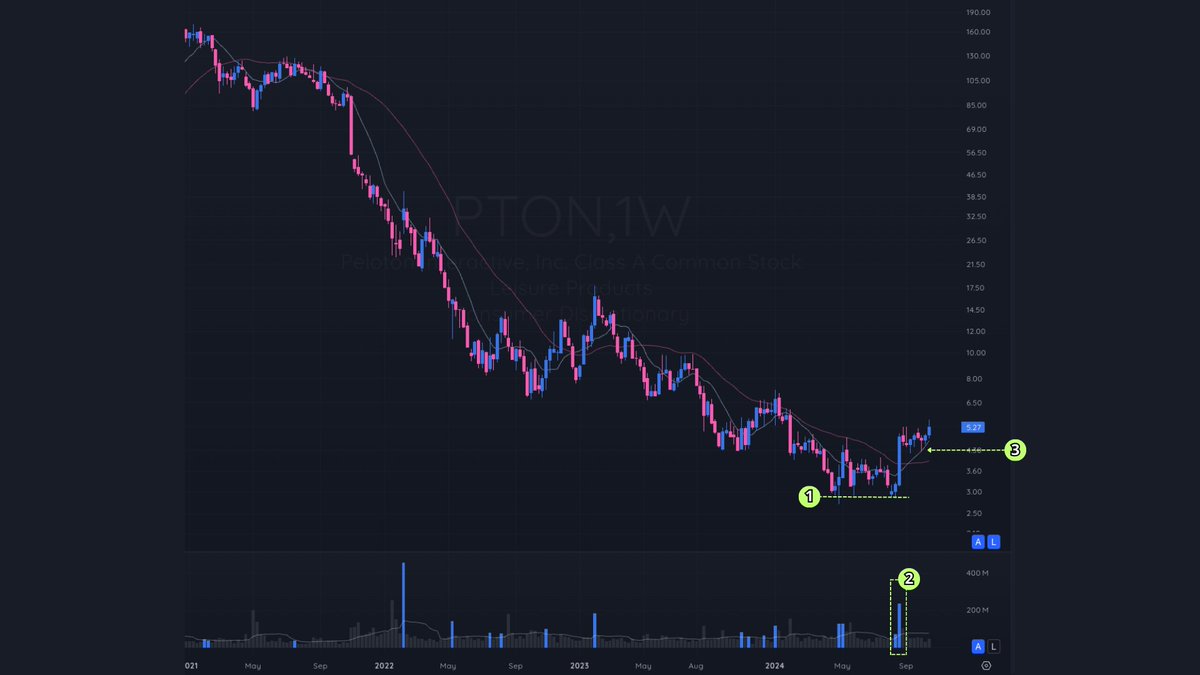
Example 3: $PTON (very early, still developing, and new position)
Peloton had been stuck in a downtrend for over two years, so I didn’t even consider buying until it started showing evidence that the downtrend might be done.
1. Higher Low: Instead of breaking to a new low, it held up at a slightly higher level. It’s subtle, but this is a big clue that the character of the stock is shifting. (It was kind of a retest of the same low, not much of a higher low, so you can argue #3 on the chart is also the first higher low. Doesn't matter, by 3 you have all 3 pieces of evidence.)
2. Volume Pop: Next, a significant volume spike paired with a strong price move. But I don’t buy just because of a volume spike—I need more confirmation.
3. Trading Tight into the 10-Week Moving Average: After the volume pop, PTON started trading tightly near the top of that move and right into the 10-week moving average. This is what really got me interested because even if it fails, I can't emphasize enough.... the R/R for these types of setups is off the charts.
The big thing here is patience. I don’t jump in while a stock is still in a downtrend. I wait until it’s made a higher low, shown a volume surge, and started respecting the 10-week moving average. By the time I get in, the downtrend has usually been over for a while. I’m letting the stock prove itself first.
Quick Recap
Here’s what makes the character change setup work:
1. Higher Low on the Weekly: Signals the stock might be done making new lows and could be shifting to an uptrend.
2. Volume Pop: A big volume spike with a price move. This tells you that there is now real interest in this name and adds evidence to support the birth of a new trend.
3. New 10-Week Respect: This helps add further evidence the momentum is on your side and allows you to get in with really low risk if it doesn't end up working.
Remember, this setup takes time to develop. The hardest part is the patience. It is a lot of hands off and waiting but thats also how I like my trades. Low stress.
Less is more!
If you made it here...drop a reply—I’d love to hear your thoughts and questions.
You NEED to listen to me.
The next timing cycle for $SPY will start between Tuesday, May 25th to Friday, June 5th.
Historically, when the markets are 11% - 15% stretched FROM its moving averages, it's in the LATER stages of its timing cycle.
What does this mean?
1. Red days are likely ahead
2. Sentiment on X will change and start becoming nasty
What should you do?
1. When others get scared, you BUY
2. Buy STRONG leaders with revenue and profits
3. Balanced portfolio with high growth + defensive
Over the last few months, we've MADE millions together as a team. Now, I will SAVE you millions.
Do not panic. It's time to buy good deals soon.
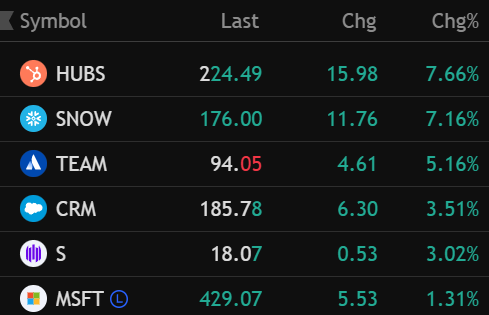
Today's scorecard:
$HUBS 7.6% ✅ $SNOW +7% ✅ $TEAM +5.1% $MDB +3.3% ✅ $CRM +3.5% ✅ $DDOG +1.2% ✅ $MSFT
100% hit rate on software.
Called the rotation out of semis.
Called the software bid.
This is why I post the book.
You're either trading the tape — or you're commentary.