Family man. In crypto since 2017.
Learned the hard way so you don’t have to.
Author of Failcoins and Bitcoin for the 50+ Investor.
Publisher at Graceful Press.
I’m Tom, 30, based in the UK, and my goal is to retire and live purely off dividends within the next 5 years.
My portfolio currently generates around £2,500 a month and that figure keeps growing as I reinvest every payout.
I’m not a finance guru — I’m just documenting what I’m doing in real time.
If I inspire even one person to start investing, that’s a win for me.
I’ll keep sharing everything openly and transparently here.
If this resonates, please share it so we can help more people take their first step into investing.
Dividends landing next week… stay tuned! Circa £750…
Please repost. People need to know.
They promised justice for rape gang victims. Instead they get a limited inquiry, chaired by an insider.
It’s a cover-up because they’re petrified of what a real inquiry would expose.
Something I was asked yesterday:
If I was starting today with £5,000–£10,000, here’s exactly how I’d think about it:
First question isn’t “what do I buy?”
It’s “what outcome do I want?”
Do you want income/cashflow,
or a set-and-forget growth portfolio?
For me, I want income.
So I’d put 50% into a stable giant like $JEPQ, then split the remaining 50% across newer, high-potential income funds like $FEPI, $YMAP, and $MAGD. Those would all be in a stocks and shares ISA.
Not advice — just how I’d approach it if I was starting from zero again. This is essentially what I am doing currently btw.
If you’re building a small account right now, what’s your goal: income or growth?
The best time to plant a tree was 100 years ago. The second best time is today.
Good luck and have fun.
I’m Tom, 30, based in the UK, and my goal is to retire and live purely off dividends within the next 5 years.
My portfolio currently generates around £2,500 a month and that figure keeps growing as I reinvest every payout.
I’m not a finance guru — I’m just documenting what I’m doing in real time.
If I inspire even one person to start investing, that’s a win for me.
I’ll keep sharing everything openly and transparently here.
If this resonates, please share it so we can help more people take their first step into investing.
Dividends landing this week… stay tuned!
I wanted to give everyone something meaningful, a gift…
This comes from Global Macro Investor (GMI) and a deep, long-running body of research developed by @RaoulGMI and myself.
Many of you already know The Everything Code, which is our framework for understanding the macro landscape and why major central banks are debasing their currencies to manage aging demographics and overwhelming debt loads.
I call this a gift because these four charts, while only scratching the surface of The Everything Code, give you the big-picture context you actually need in moments like this.
They stop you from getting lost in every Bitcoin pullback and explain why Raoul and I never panic, even when, to borrow one of his expressions, everyone’s acting like monkeys throwing poo at each other.
Once you understand The Everything Code, you stop trading short-term noise and expand your time horizon. You cannot unsee it.
The starting point is what we call The Magic Formula:
GDP growth = population growth + productivity growth + debt growth.
Population growth and productivity growth have been falling for decades. Debt growth is the only thing filling the gap.
The private sector has been deleveraging since 2008, mainly households, but debt levels are still around 120% of GDP. The public sector sits at roughly the same level.
Here’s the problem…
If the government is running debt at 100% of GDP and the private sector is sitting on another 100%, and for simple math we call rates 2% even though they are really closer to 4%, then the entire 2% trend growth of the economy is being consumed by servicing private-sector debts. That is a completely unproductive use of GDP. And then there’s the issue of public-sector debts. There’s just not enough organic growth to service the existing debt load.
To understand why this dynamic persists, you need demographics.
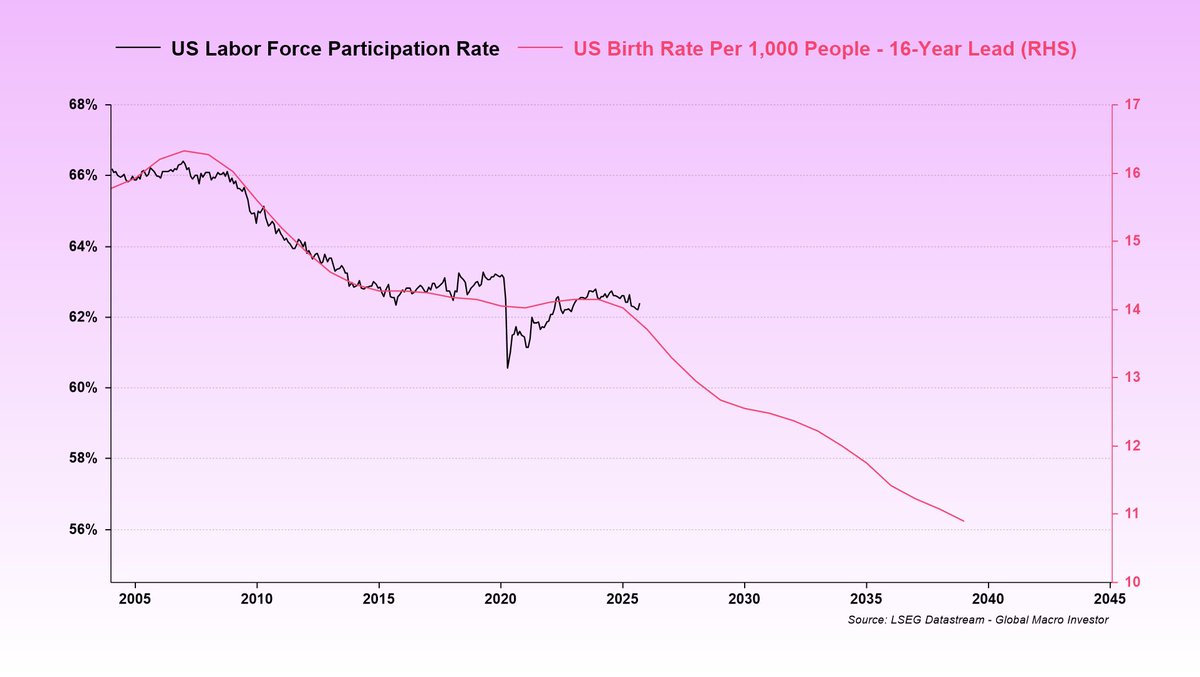
Birth rates peaked in the late 1950s and have been declining ever since. This shows up about sixteen years later in the labor force participation rate as each generation enters the workforce (chart 1).
That means the labor force participation rate is not going to rise any time soon. It is set to keep drifting lower. This is a structural problem.
Aging populations, falling birth rates, and rapidly expanding automation make the backdrop even more deflationary. AI and robotics are replacing humans at scale, and we are only at the beginning. This reinforces the need for ongoing stimulus to keep the system functioning.
With weak population growth and sluggish productivity, the only way to keep GDP expanding is through debt.
Now here’s where it gets interesting…
Government debt growth is completely offsetting the demographic decline and policymakers know exactly what they are doing (chart 2).
And what happens next?
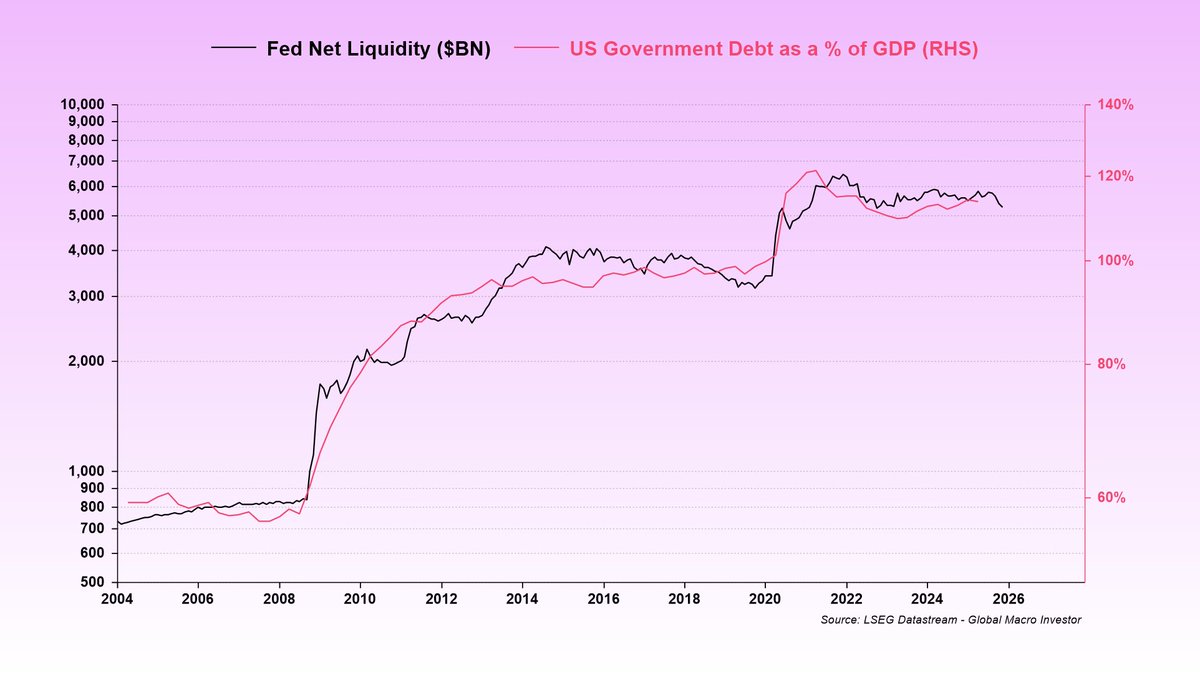
All debt growth in excess of GDP gets monetized (chart 3).
Basically, since 2008, magic money has effectively been paying the interest. Governments issue new debt to cover old interest, and once rates fall enough, central banks absorb it onto their balance sheets.
So to wrap this up, demographics drive the decline in the labor force. Governments offset that decline with more debt. That debt eventually gets monetized through quantitative easing (QE) style operations, not always directly by the Fed, but through the coordinated ecosystem of the Fed, the Treasury, and the banking system. And the bottom line is that there’s still a massive wall of interest that needs to be monetized, far more than GDP can ever cover. Liquidity is literally the only game in town.
And what thrives in a world of perpetual debasement? Bitcoin (chart 4).
I know this correction has been painful, but it’s all part of the journey. These periods feel brutal in the moment, then they fade and the trend resumes. This too shall pass…
To quote Walter White from Breaking Bad, later echoed by @LynAldenContact, nothing stops this train.
MOAR COWBELL (liquidity) = number go up over time. Zoom out and be more bullish…
Utterly brutal crypto markets with relentless, rapid positions unwinding and rumours swirling after 10/10 of impaired market maker balance sheets leading to less liquidity and someone blowing up.
It reminds me a lot of 2021 when in a 4 week period Bitcoin fell 56%, ETH -62% and SOL fell -68%. It then sharply reversed and exploded to new highs. That sell off was as baffling as this one.
With the macro backdrop still so positive it is hard to think that we won't see something similar here (a sharp recovery) but massive downside volatility like this is not easy for anyone and not certainly something I expected to see at this stage, but it is also not out of the normal.
Back in 2019 to 2020 we had a -72% sell off (in a bull market but the sell off was exacerbated by Covid). Back in 2016 to 2017 we had 7 sell offs of over 30% in BTC. Alts always do worse of those periods too (see chart)
The current price action is showing no signs of letting up yet even though we are massively oversold, but having lived through huge rapid de-rsking events before in many markets, this too shall pass.
My strategy is to add into these sell offs but Im ok with large swings in P&L in a long-term multi-year trend as I've explained many times, but everyone circumstances and time horizons are different.
Good luck out there, its ugly and made harder by the lack of actual negative news outside of price. Try to get away from your screens if you can and get into nature to destress.
⚡️The Truth About the “9:30 AM Binance Seller” Pattern
1. The pattern structure:
•A single actor or tight cluster aggressively selling BTC exactly at 9:30 AM EST,
•every day,
•with the same signature size, timing, and execution style,
•on Binance futures,
•for roughly two straight weeks.
That never happens by coincidence.
Retail doesn’t behave like this.
Whales don’t behave like this.
This is systematic flow.
This is mandated execution.
And the regularity (to the minute) tells you it’s professional, not emotional.
2. This is not an “attack.” It’s a mandate.
When flow is this clock-timed, there are only four realistic possibilities:
Possibility A – structured unwind
A fund or desk is:
•cutting risk,
•de-leveraging,
•or liquidating part of a book
inside a fixed execution window.
Exactly how institutional mandates work:
•“Execute between 9:30–10:00 AM.”
•“Reduce exposure by X% daily.”
•“Follow TWAP schedule.”
Possibility B – hedging schedule
A large actor is hedging spot inflows/outflows on a fixed schedule.
This also results in:
•repeated selling at the same time,
•regardless of price.
Possibility C – coordinated group action
A syndicate of desks decides:
•this is the liquidity window,
•this is the execution box,
•and they pile into it together.
Possibility D – a distressed actor unwinding inventory
This could be:
•a market maker,
•a proprietary desk,
•or a large whale
who must sell at regular intervals because they’re unwinding a bad position.
This aligns with the liquidity fracture that began on October 10.
3. THE KEY FACT:
This does NOT look like a healthy seller.
Healthy execution does not:
•dump into thin books
•dump into a falling market
•dump during volatility spikes
•dump on the same venue
•dump at the exact same clock time
•dump with zero sensitivity to price or slippage
Healthy sellers spread their flow.
This seller is not spreading flow.
That tells you:
•They’re constrained.
•They’re required to sell at this time.
•They don’t have the luxury of being smart.
•They’re cleaning up a problem, not expressing a view.
This looks like a forced participant.
Not a bear.
Not an attacker.
Not someone who believes price is going lower.
Someone who has to unwind.
That is why the flow looks so synthetic.
4. This actually aligns with everything else we’ve seen.
It fits perfectly with:
•the October 10 liquidity fracture
•the broken depth that never fully recovered
•the weird slippage behavior
•the BTC-only stress (alts didn’t sell as mechanically)
•the US panic zone
•the ETF redemptions
•the shallow liquidity regime
•the market-maker deleveraging
•the whales absorbing
All of these point to:
“damaged microstructure” + “forced flow,” not new bearish fundamentals.
5. Final synthesis:
This seller is the residual echo of the October 10 failure.
They are cleaning up a mess, not expressing bearish conviction.
This is not someone betting on lower prices.
It’s someone being forced out.