Reminder that price sets narrative.
Example with DeFi:
> Current narrative while price is down is that AI models continue to find vulnerabilities in DeFi code, and thus renders them insecure and too risky to use or hold as an investment.
> If price starts to moon, watch it switch to 'AI found a lot of bugs in DeFi code that have now been fixed and now secure'.
That's why I just like to draw lines on charts and manage risk. The narrative tends to suit the current regime price is in.
12 hours later and the grind up on negative funding continues!
Love to see it!
This is the exact same signature we saw on $BTC during our last grind up from range lows at 60k all the way to our last local high at 80k+.
For now, my eyes are on just a little over 70k for a nice relief rally if we can keep this up- at that point we will once again be up against a fresh supply zone and will have to be a bit more cautious.
And on the lower timeframes, we have a clean PO3 in progress here imo.
We already got the clean sweep and close above the HTF macro lows which served as our "manipulation" phase, now looking for a move back up through the FVG above our accumulation zone in green and into the untapped supply at .33-.45.
From there we are likely to get a pullback that we will want to see form a higher low for continuation higher.
ethereum:0xd533a949740bb3306d119cc777fa900ba034cd52
Added some more notes to the $CRV chart for reference.
We got a nice daily SFP on our move below our swing that marked the bottom of our TR (trading range).
You'll also note that the spring occurred on relatively low volume. This is key because it indicates that there is no more "excess supply" left on this asset. A break of a major swing low like this would typically coincide with a spike in volume from panic sellers who are selling the "break" or capitulating (like we saw during the 2024 break where we saw record volume from liquidations and forced sellers). The lack thereof validates that excess supply has already been removed at this point AKA weak hands have been completely rinsed and so we are now finally ready for the markup/expansion phase.
While there are significant implications in all of this, one of the biggest is that the 7x rally from .18 to $1.30+ in 2024 wasn't actually the start of the expansion phase but rather just part of the accumulation/basing process, and the "excess supply" that existed at that time was significantly more than what is left today. In other words, on this next move up (the start of the actual expansion phase), supply is even more constricted than it was then, and if this really is the beginning of the expansion phase, for the first time since putting in the initial trading range low back in 2020, then the next leg up should be even stronger/more aggressive than what we saw in 2024 on the rally from .18 to $1.30+.
Now we just need to look for early indications that our rally is beginning (aka low timeframe impulse).
An update to this a little over 24 hours later.
We continue to see signs of a shift in momentum here.
Funding is now oscillating between negative and positive, and much more "neutral" than it was during our correction from the range highs.
Spot premium has also recovered and is no longer dropping as it was during the decline.
There is clearly some buying interest (or lack of selling interest) here at the 60k range lows.
In the short term I would not be surprised to see one more marginal lower low to clean up the lows but overall this is good progress.
We want to continue to monitor these metrics over the next 24-48 hours to see if they continue to improve (more consistent negative funding and/or stronger spot premium).
$BTC
The very unpopular opinion below from a little over a year ago has suddenly become quite popular on CT this week.
Funny how that works eh.
Like I said in another post I don’t think that massive unwind will happen now, but remember this once we are deep in the next secular bear because I’m sure it will resurface again when that time comes.
You can find this 100 year old schematic all over the internet, telling you that this type of PA is normal, natural, and has been recorded to occur for literally decades prior to the biggest expansion phases on record- and many of you are still panic selling into the absolute pico bottom.
If you never did any DD on @CurveFinance and/or never had any conviction in it in the first place- that's a different story.
But if you did your DD, understood the mechanics behind it, understood the investment thesis and ARE STILL selling into these lows out of fear, you are going against the literal playbook and what it's telling you to be doing here.
$CRV
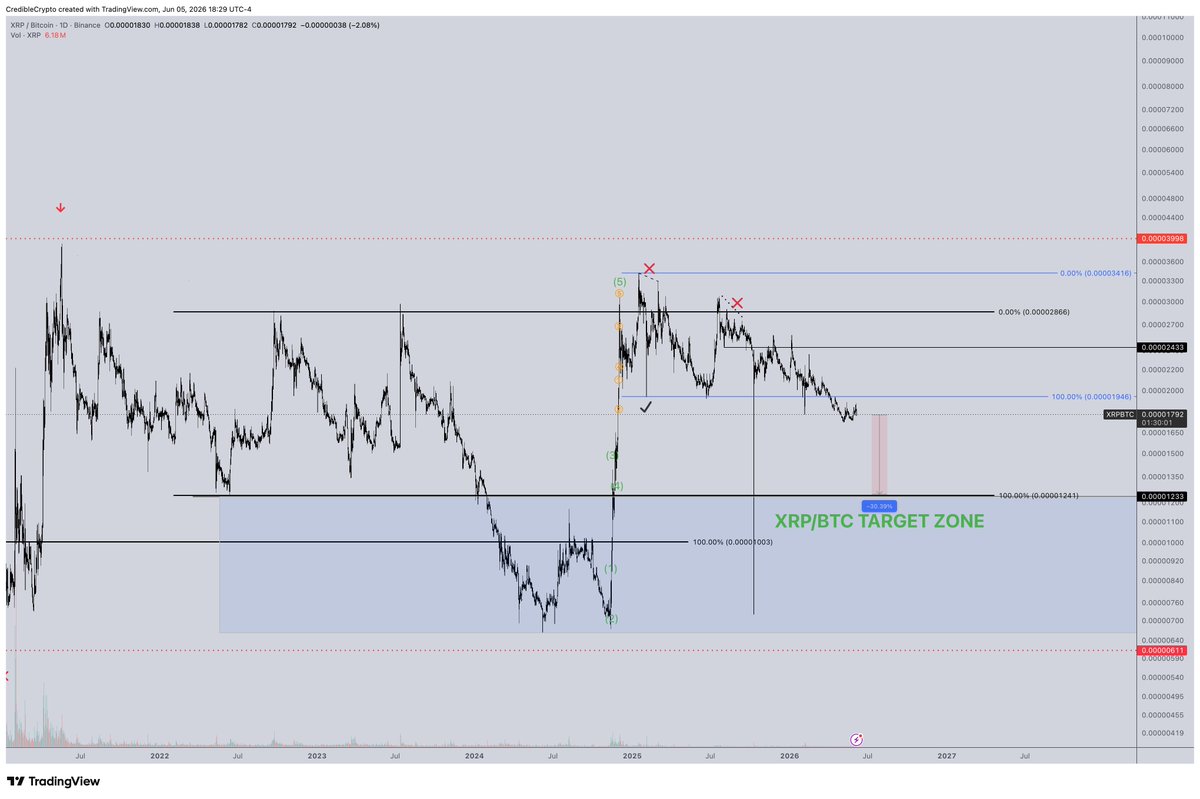
Local range lows on $XRP have been taken.
Would make some sense for a move to range highs assuming we get some relief across the board but I would be very cautious if/when we get that move because XRP/BTC still sits some 30% above my downside target so I don't quite think this will be the ultimate bottom for $XRP just yet, even if we do see a move back to the local range highs.
Ultimately, think $XRP will find it's way to our HTF demand zone in green one way or another, and that is when I would consider it worth buying assuming XRP/BTC has also hit my target zone by that time.
Keep in mind this correction is in the context of correcting our impulsive move that took us from .50 to around $3.60 so while this looks scary its a natural result of such a quick 7x move that now needs to be "digested".
The last time $ETH was in the $1500’s CT was calling it “dead” and then it literally rallied and went on to make new all time highs.
$ETH is once again in the 1500’s and CT is once again calling it dead 🤔
$ETH USD pairing at HTF range lows, $BTC at 60k range lows, ETH/BTC pairing at HTF buy zone.
I’ve been waiting for this target on the ETH/BTC pairing for months and it’s finally been met.
The confluence with both BTC and ETH also at their respective range lows (and on now negative funding) is confluence that I like to support it.
So, this is a very logical place to DCA spot imo.
Added some $ETHA in the tradfi account ✅
Just like it took some time to validate the shift in our regime at our range highs, it will take some time to validate a potential shift at our range lows on $BTC.
But, we are seeing some initial signs for the first time.
1. Spot premium seems to be increasing again.
2. Funding seems to be dropping into neutral/negative territory for the first time since our correction from range highs began.
Again, we would want to see this emerging shift strengthen over the next 24 hours or so, but this is at least a positive sign that there is some evidence of a potential slowdown in the sell-off occurring here at our range lows.
First off, super unfortunate regarding the exploit on $ZEC that occurred- I don't think this is anything anyone could have really predicted, so the fact that it happened when it did shouldn't negatively reflect on those that were chattering about it imo. Up until this point it was performing beautifully.
With that being said- these events perfectly demonstrate the point I was making earlier in the month about avoiding buying into assets that are already up nearly 40x off their bottoms and approaching prior ATH:
"You are making one massive assumption, which is that the 2-3x is guaranteed. The whole point is that it's not- and so if we top after a 20% rally you are now underwater. If that was the absolute top, you will lose everything. Alternatively, if you bought at the bottom, not only are you up 40x by now, but that chances of you NOT profiting off the investment to some extent is slim to none because even if we do top after a 20% rally, you have plenty of time to exit in profit before price ever makes it back down to your original entry."
Coincidentally, $ZEC did end up pumping just 20% higher from that post and then marked a local top, with the sell off today obviously exacerbated due to news of the exploit. Now everything I stated earlier, rings true. We obviously don't know if this was a local top, a mid term top, or maybe an even more significant multi year top, but those that jumped in after a 40x off the $20 lows are now underwater and have the difficult decision of cutting their position for a loss, or holding on as we bleed lower for an indefinite amount of time (f this event did indeed mark a major top).
Meanwhile, anyone who bought when $ZEC was down 95%+ from the highs is still sitting comfortably in profit, can still exit with significant profits, and has a much easier decision to make. Granted it was probably difficult for them when they entered at the lows prior to this expansion phase because we know sentiment was probably the absolute worst at that time too, but the point is that at that time their R/R for buys was far more favorable AND their downside was literally capped at $0 (which we would only get on a complete implosion of the protocol) which was unlikely to be met assuming $ZEC had some fundamentals to keep it relevant (which it clearly did).
This is precisely why as beautiful as the PA was on $ZEC prior to this correction, it wasn't a spot buy for me- R/R wasn't justified at these levels and downside risk was too great. I had missed the boat- and I'll miss many more- but you don't need to catch 1000 boats to reach your destination in this space, you only need to catch a few, and crypto has 10,000 boats to choose from.
Buying when an asset is down 95% from the highs and selling it at 10, 20, 50 or 100x higher is what everyone should be doing. Instead in this space people tend to do the opposite- buying an asset after it has climbed 10, 20, or 50x off of it's 95% drawdown level and then selling it once it collapses again.
$CRV has cleared its macro lows at .18.
I’ve taken a hit on my levered longs and while I didn’t think we would revisit these lows it’s nothing I haven’t seen before.
In 2019 I picked up $10,000 of $XRP at .18, a time when nearly everyone was proclaiming it dead. In August of ‘25 it hit new all time highs at $3.60+.
This .18 level was the last major level of historical relevance on the CRV chart and since it has now been taken it’s very possible our low will be put in soon, but until we get a new technical trade setup the best approach here is to simply buy spot and chill.
Because my conviction on $CRV is as strong as my conviction on $XRP was when it was at .18, I felt it was only right to replicate that legendary buy with a $10,000 purchase of $CRV at the same price of .18 today as well.
I do think the outcome (new highs) will be the same (except ideally it won’t take nearly as long) but then again if I didn’t believe it would be I wouldn’t be buying at these levels (and if you lack the conviction, or can’t afford to invest more, neither should you).
Time to reflect on the recent move down and why sharing analysis on this platform and actually executing on said analysis are two very different things. I'll walk you through my personal thought process as we approached our HTF supply zone which led into our correction.
Let's take a look:
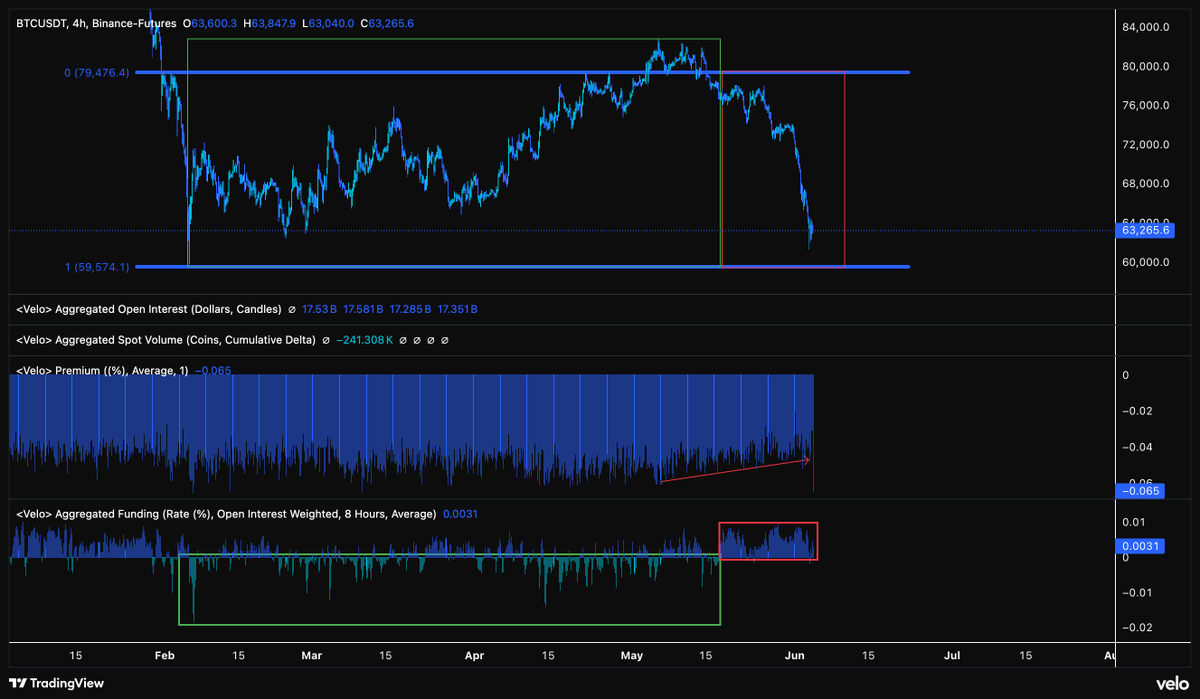
The quoted tweet below was when we had reached our HTF supply zone- as previously stated, "the most likely place to see a rejection" on what was a clearly corrective rally up off of our 60k lows.
However, at the time of tweeting, while we were at HTF supply, I mentioned that we were still seeing a "strong spot premium" and "negative funding"- both indications to support the idea that we were not seeing any substantiated weakness, yet.
On the chart below, I have marked off when this actually changed. The green box shows PA during which we had relatively sustained negative funding, the red box shows PA during which funding flipped (and stayed) positive.
However, you'll notice that even during the entire move up, we have "spurts" of positive funding throughout the negative funding regime. This means, that when the regime changed to one of primarily positive funding (red box) we couldn't immediately assume that it wasn't just a temporary change up, with more negative funding to follow.
The same goes with our spot premium that we observed on the way up. In hindsight, and with the passage of more PA, it is now clear that our spot premium did in fact begin to dissipate as we moved lower (red arrow), and the positive funding also REMAINED rather than flipping back to negative. However at this point we were back inside the range, no longer at HTF supply, and we had left some LTF untapped "triple" swing highs that I had expected would be taken BEFORE a larger correction from our HTF supply zone.
This is all to say- while a correction from HTF supply was expected at some point, I was personally unable to actually execute on this because I was looking for one more LTF push higher, deeper into supply, because the metrics I wanted to see a shift in didn't signal that shift until it was too late for me to position.
It would have been far easier for me to simply say "expect a rejection at HTF supply" and leave it at that- and if I did exactly that and nothing else, CT would likely be applauding me right now- but since I am not here for applause and rather to educate, the focus is on all of the nuance that comes with actually executing on these moves- which typically requires a lot more than what meets the eye.
As a trader you must not just consider your entry region (HTF supply), but also must define your risk, your target, your SL, etc, and in a HTF zone narrowing down all those factors can become quite challenging at times.
In the end, I will take what I've seen here and add it to my mental library so that next time I may hopefully be better prepared to capitalize on this type of move in the future.
Yea it's interesting for sure.
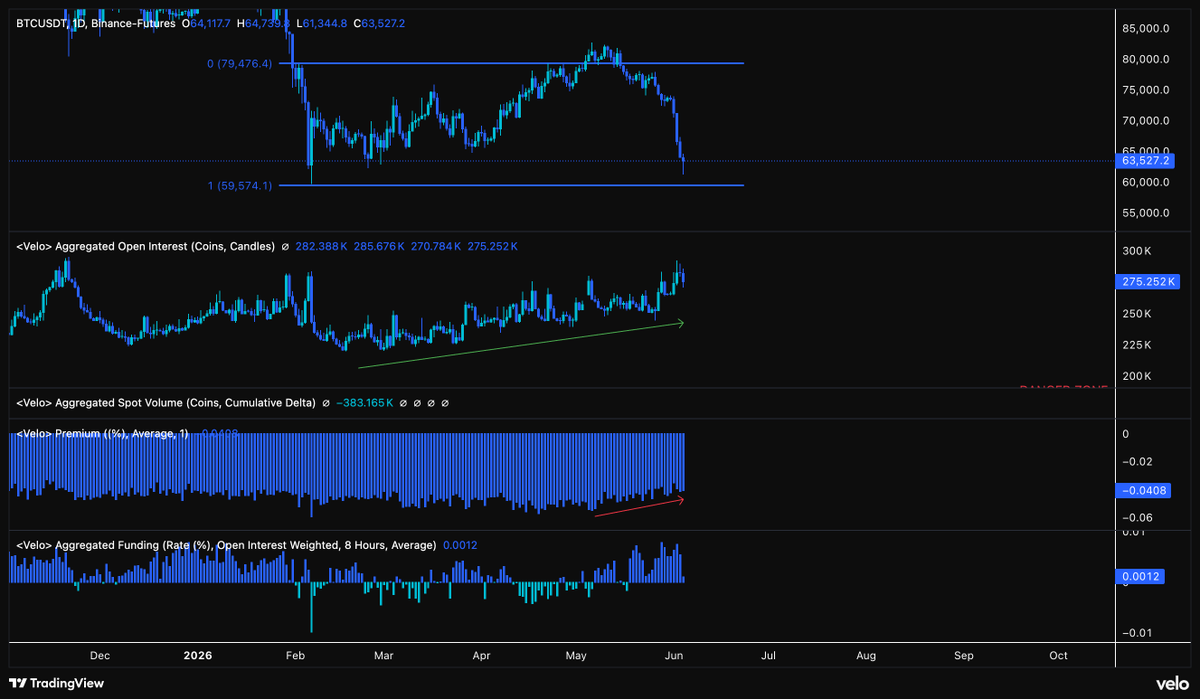
A relatively massive amount of $BTC liquidations on this move down, getting close to rivaling October 10th, but OI actually trending up and significantly higher than the last time we were trading at our local range lows.
Funding has also been generally positive and spot premium also declining since our local highs.
OI here is measured in "coins" but if you measure it in dollars it has decreased by about 20% which is the same amount that price has dropped from our range highs to our lows- which implies that there hasn't really been any major decrease in positioning, despite the significant liquidations.
All seems to suggest longs continued piling into Bitcoin to replace those getting liquidated during the move from our range highs to our range lows which was primarily caused by aggressive spot selling.
The one positive thing to note is that funding over the last couple of days has dropped significantly which could indicate spot sellers tapering off or aggressive short sellers jumping in at our range lows.
Either is a good sign for bulls but will have to see how this data develops in the coming days.
$TRAC is one of the coins that I hold that has held up best on this entire $BTC drop so I decided to take a look at it's BTC pairing chart for the first time (not sure why I hadn't checked sooner).
It's worth noting that this chart only shows PA going back to 2022 and TRAC has existed since 2018 so if anyone knows where I can find a chart of the BTC pairing with full price history please let me know.
With that said, we have a very clean range here over the last 4 years and we are currently trying to reclaim the range lows. If we manage to do this we have a confirmed deviation below the lows and can target the highs some 200+% above.
$TRAC is def one to keep an eye on as the USD pairing has also been grinding up off it's HTF accumulation zone for some time now and it wasn't really affected by the recent BTC drawdown.
This, combined with the $BTC chart in the process of potentially making a major reclaim for the first time in over a year tells me fireworks may be around the corner.
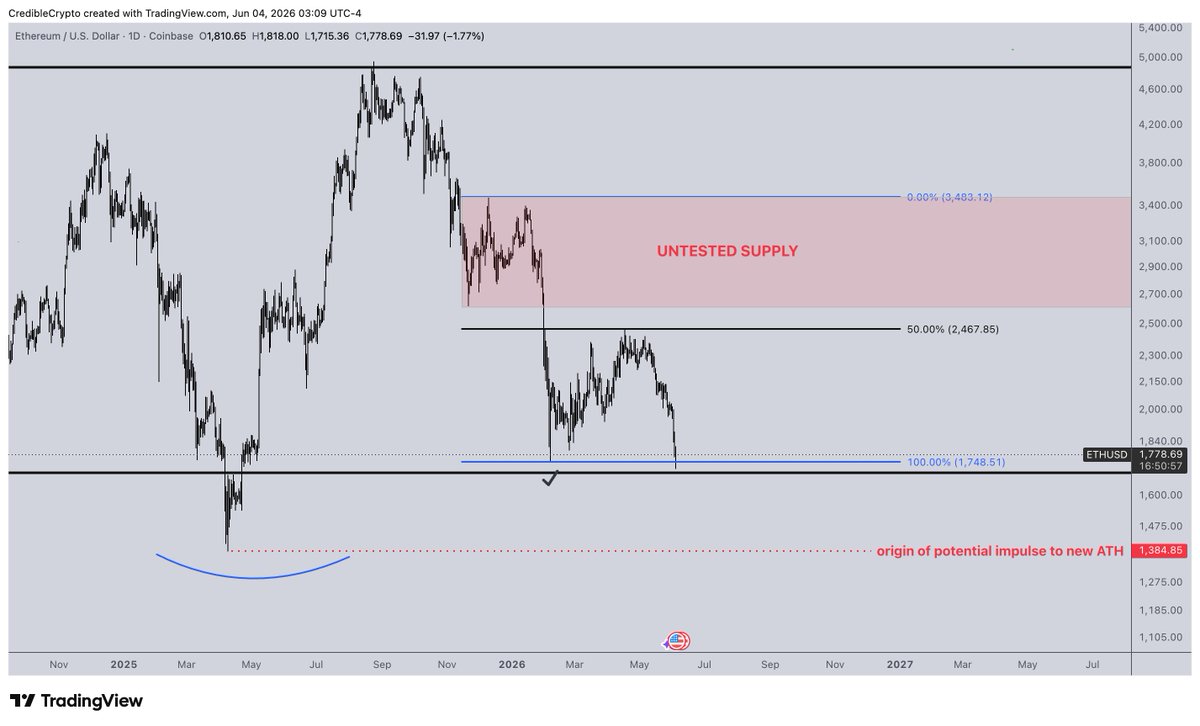
$ETH took our range lows before heading for supply overhead which is unfortunate because if we left the lows unswept and went for the supply first it would be an easy fade- but now that the lows have been taken it leave me less confident about a more significant rejection once we rebound and head for that untested supply zone.
On the plus side if we can hold the range lows here and avoid breaking that ~1380 level then once we go back up to mid-range or higher we may not need to return to these levels again.
For now ETH/BTC is still about 6-10% above our target zone so going to keep an eye on both pairings and pay closer attention to $ETH once that target on ETH/BTC is finally met.