Noto con molto piacere che, settimane dopo che ho svelato la correlazione quasi perfetta dell'andamento del prezzo di Bitcoin con quello dei cosiddetti "asset growth", diversi analisti se ne stanno accorgendo e ne stanno prendendo atto.
Questo finalmente farà sì che molta gente inizierà a capire Bitcoin (ho scritto "inizierà" non a caso...)!
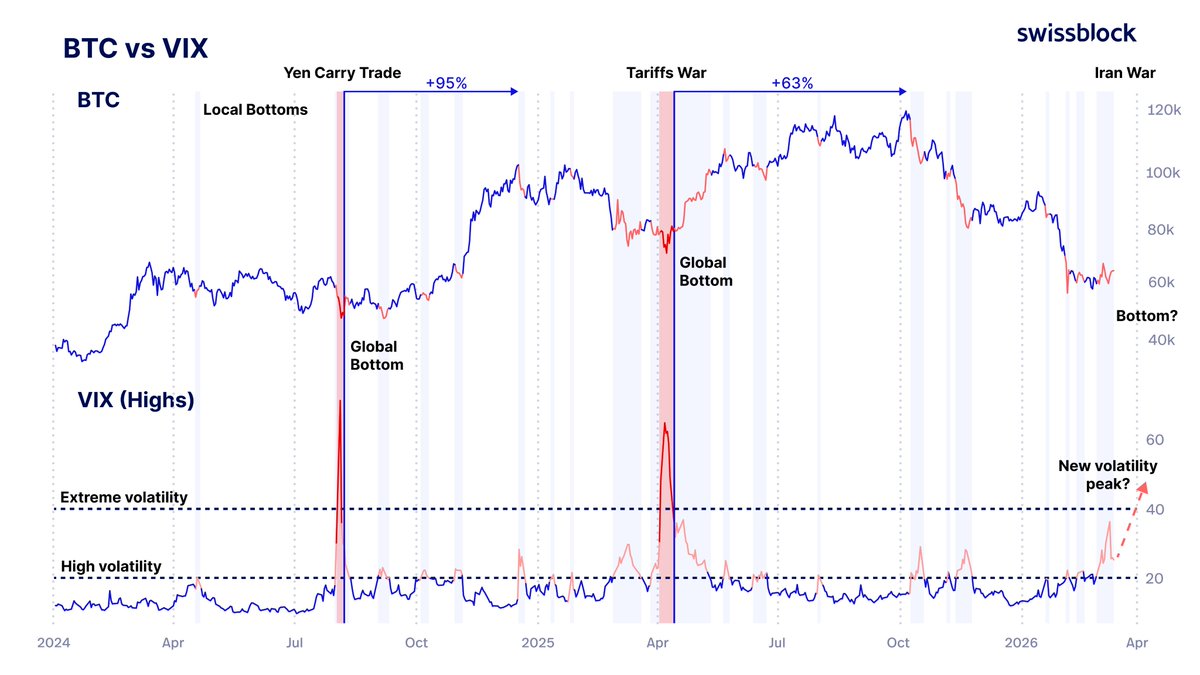
It’s not just the $SPX —the $VIX "Fear Gauge" is perhaps the most reliable compass for $BTC as well.
Looking at the same volatility spikes, the correlation is undeniable. While VIX > 20 signals local dips, crossing the 40 threshold has historically marked the ultimate "Buy the Blood" moments for Bitcoin.
We saw it during the Yen Carry Trade with a massive +95% rally and again during the Tariffs War with a +63% surge. If Iran tensions push us past 40, history suggests the next Bitcoin leg up could be legendary.
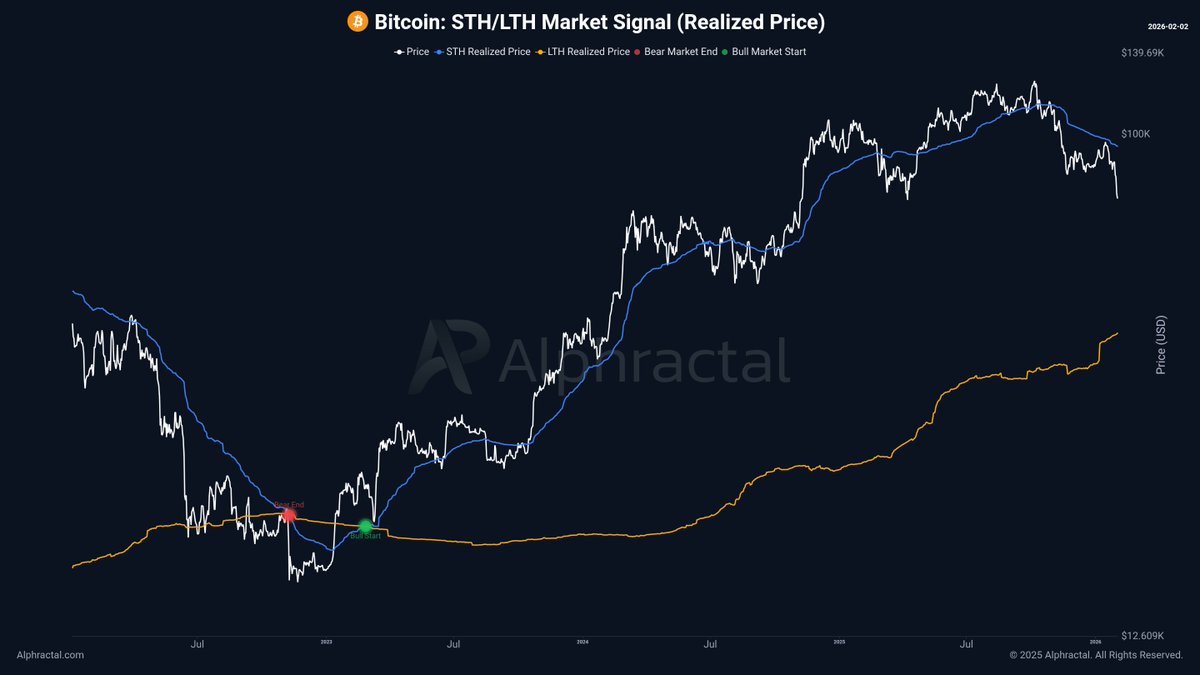
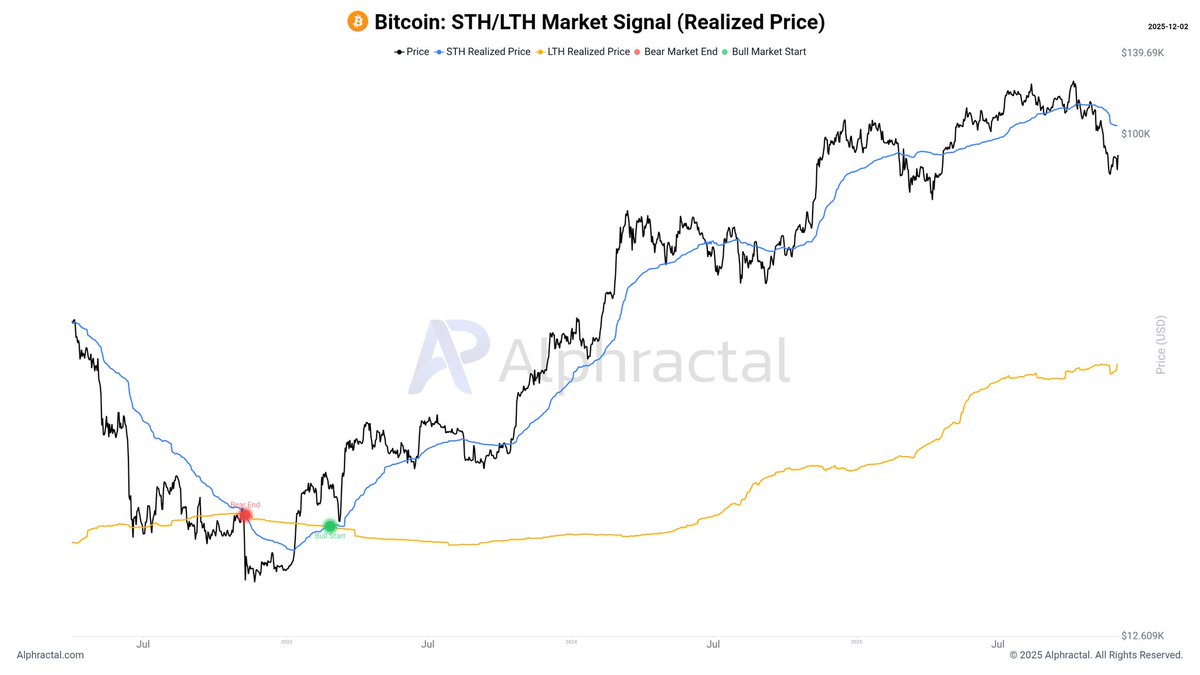
The Bitcoin price bottom only happens when…
✅ Short-Term Holders are in loss (this has already happened)
⏳ Long-Term Holders start carrying losses (this has not happened yet — this is when the real bottom forms))
Additionally:
🔴 The bear market only ends when the STH Realized Price falls below the LTH Realized Price.
🟢 The bull market begins when the STH Realized Price moves back above the LTH Realized Price, after the bear market has fully played out.
We track this with a dedicated chart to alert you when it happens.
Data > Narratives
@Alphractal
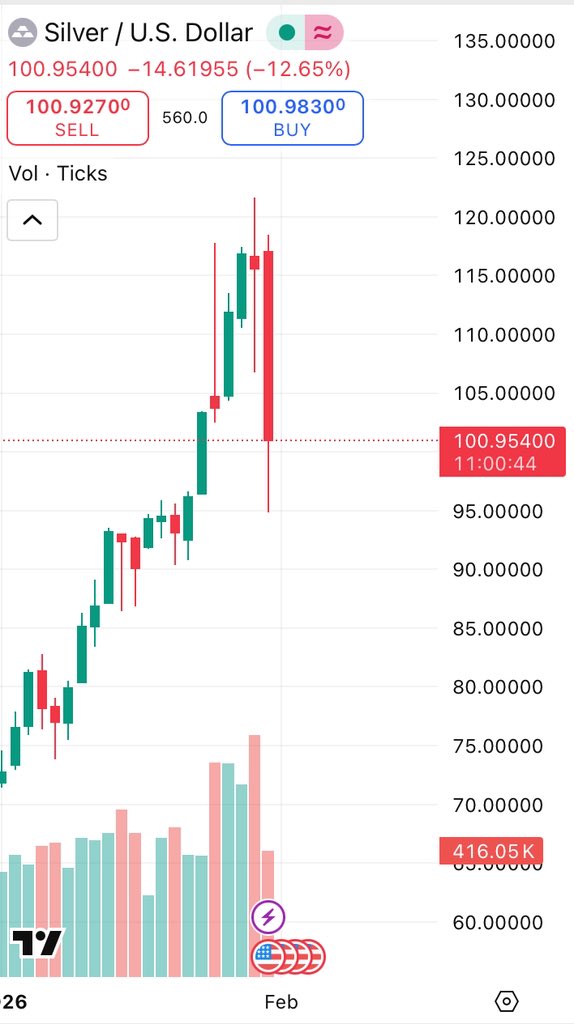
È impossibile indovinare il top esatto di un rally parabolico, ma un aumento della volatilità intraday è solitamente un segnale di cambiamento dell'equilibrio tra domanda e offerta.
Nel caso dell’argento, quei wicks daily nelle ultime sessioni sono un chiaro segnale che i venditori sono entrati in azione.
I grandi fondi generalmente hanno bisogno di liquidità per realizzare profitti e non badano a qualche punto percentuale in meno; quando decidono di uscire, lo fanno finché c'è liquidità.
A mio avviso, quei recenti lunghi wicks sono il segnale.
Poi magari domani il prezzo dell’argento torna a spingere al rialzo, ma diciamo che questo non è lo scenario su cui punterei.
La regola è sempre la stessa: comprare basso durante le fasi di consolidamento e vendere nei rally parabolici.
Inseguire su questi livelli sperando che questa volta sia diverso è legittimo, ma si deve essere consapevoli che il rapporto rischio rendimento è pessimo.
#Silver #SilverSqueeze
Entry (Buy) Rules:
Wait for the 20 EMA to cross above the 50 EMA.
Ensure RSI (14) is above 50.
Buy when the price touches the 20 EMA and RSI is still above 50.
Exit (Stoploss) Rules:
Exit if the 20 EMA crosses below the 50 EMA, or
If the price drops below the 50 EMA.
This strategy helps traders catch pullbacks in an uptrend with confirmation from the RSI.
#StockMarket
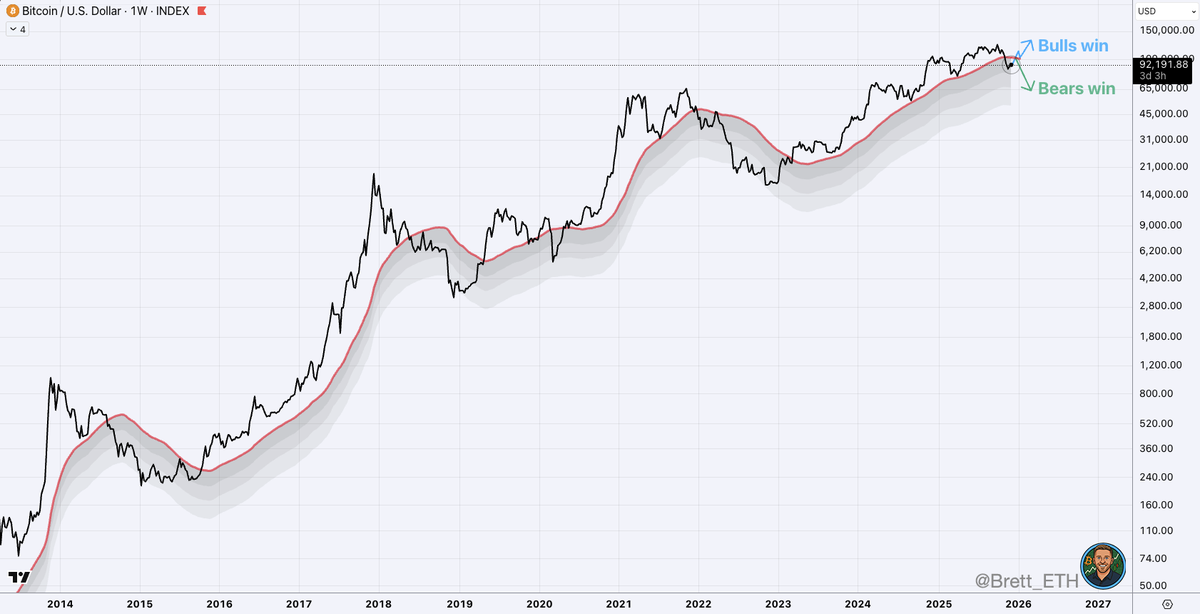
The Bitcoin plan is simple.
If Bitcoin gets 2 clean weekly closes above and/or a bounce off the the 50w (using it as support), the bull market lives on.
If we get back to the 50w MA and get rejected...bears take a victory lap.
The good news, you don't have to pick a team and stick to it. You can trade the market you're given. Too many people are obsessed with it HAS to be a bull market or bear market.
The 50w MA is currently at $102,350.
On-chain analysis is one of the most incredible things in the entire crypto market. Seriously. It’s like seeing beneath the surface of price and understanding Bitcoin’s structure in real time.
And when you combine it with the CVDD Channel, everything becomes insanely clear.
This indicator shows — dynamically — where the most important on-chain support and resistance zones are. No guessing, no “gut feeling.” It’s real holder behavior, especially from the oldest coins.
And here comes the critical part:
BTC is now sitting at the same on-chain support level it had around 29k–30k in May 2022.
Back then, it tried to hold… but failed. And the bigger drop came right after.
So yes, this moment demands attention.
Right now, the level the market must defend is $88,000.
Holding above it is essential to dismiss a more bearish scenario.
As long as BTC stays below 88k, there is indeed a risk: Long-Term Holders may start selling more of their positions, because CVDD is extremely sensitive to old-coin movements — it reacts when very old coins begin to move.
If that support doesn’t hold, the next natural target in the CVDD Channel is $76,800.
And in a more pressured scenario, there’s structural confluence at $71,250.
These are zones where the market historically finds value after capitulation phases.
And just to highlight: CVDD is the most accurate bottom-spotting metric in every BTC cycle.
Right now, its base value stands at $47,450 — it changes daily, but the question is:
Will it hold the ultimate bear-market floor possibly in 2026?
Chart: @Alphractal
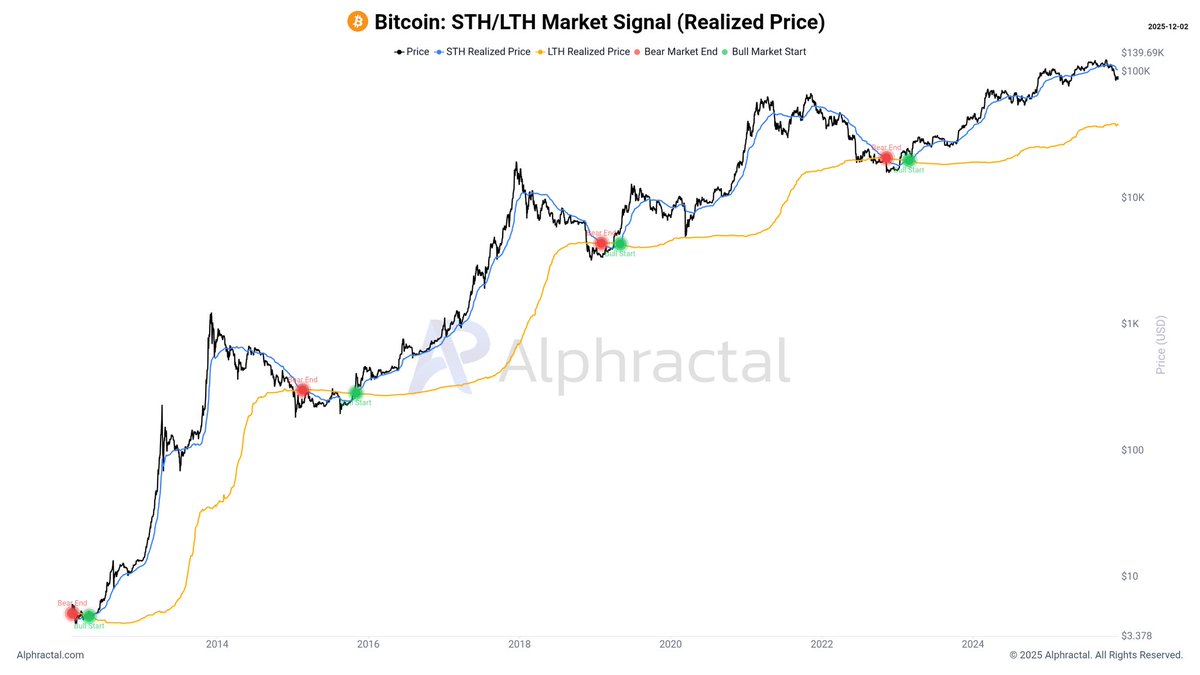
The Bear Market only ends when the STH Realized Price crosses below the LTH Realized Price.
And the Bull Market begins when the STH Realized Price crosses back above it.**
This is one of the cleanest and most reliable cycle signals in Bitcoin.
No guessing.
No “market vibes.”
Just pure holder behavior.
🔴 End of the Bear Market
Happens when STH Realized Price drops below LTH.
This shows short-term holders capitulated, speculation was flushed out, and the market is shifting into a real accumulation phase.
🟢 Start of the Bull Market
Occurs when STH Realized Price crosses back above LTH.
That’s when new capital starts flowing in, traders’ cost basis rises above long-term holders’, and the trend flips with strength.
Simple, powerful, historically accurate.
To make this visual and automatic, we built the
STH vs LTH Market Signal (Realized Price)on Alphractal.
Automatic cross detection.
Cycle markers.
A clean read of how holders are behaving beneath the surface.
If you want to understand when the market truly shifts… this is the chart.
https://t.co/1cjMJtIoAw — last chance to get 70% off on all plans.
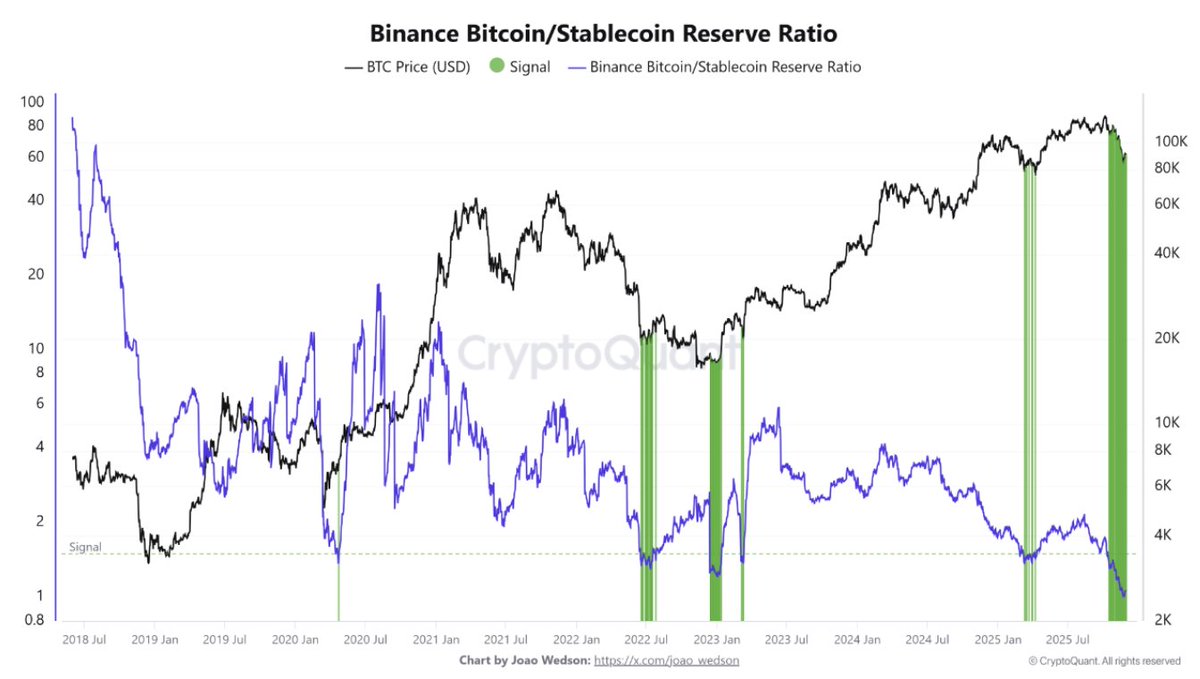
Binance Reserve Ratio Smashes 2018 Historical Low
“History shows that hitting such lows often precedes powerful Bitcoin rallies, simply because the liquidity required to fuel a price surge is now fully available on the exchange.” – By @CryptoOnchain
This is Bitcoin pivot point:
Every major liquidity collapse in the last two years has preceded a multi-week recovery.
Liquidity leads, and price follows with a 1–3 week lag.
If liquidity stabilizes and turns up:
🔹Bottom above $80.5K is confirmed
🔹Tactical recovery window opens into mid-December
🔹Momentum finally has room to rebuild
Bitcoin, what’s the plan?
This week could bring a second spike in the Risk-Off Signal.
If that spike comes in weaker, it may mark seller exhaustion and strengthen the case for a bottom forming.
For now, the ball is in the buyers’ court.
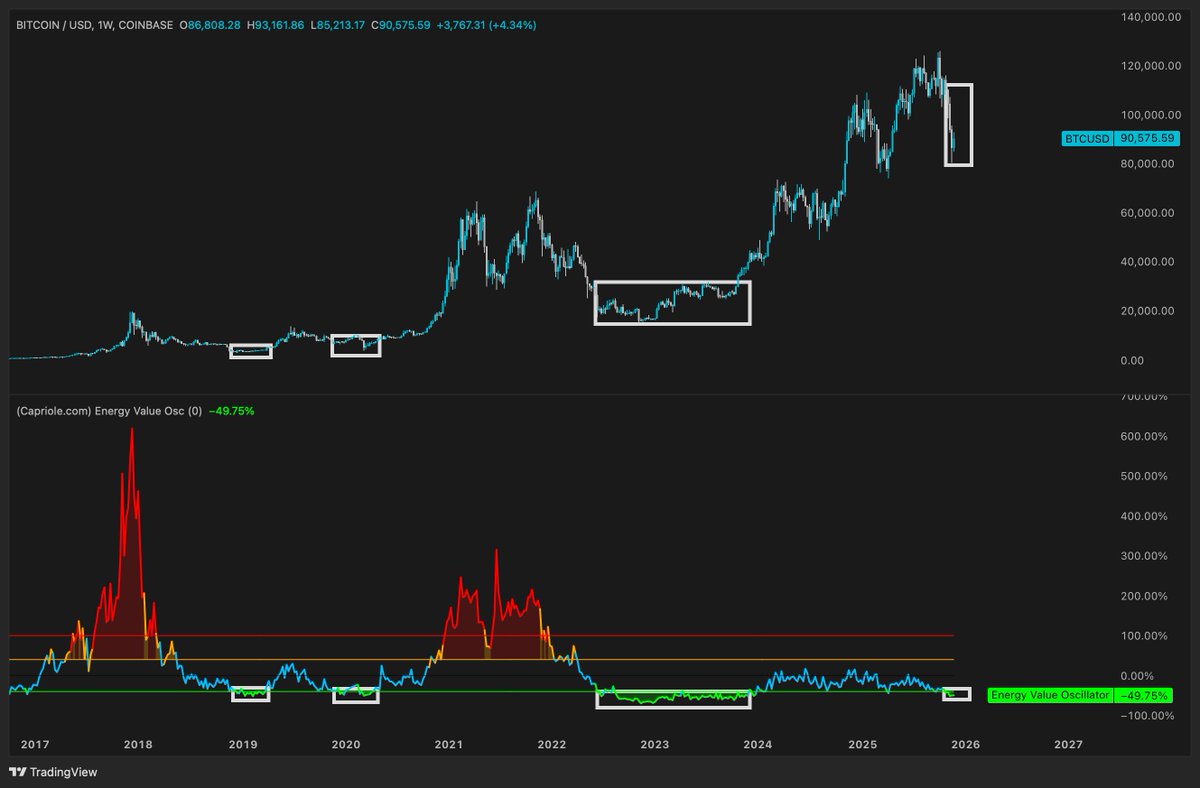
Historically, when Bitcoins 'Energy Value has dipped below -40%, it has proven to be a good area to accumulate.
We are currently Valued at -49.75%
My bullishness remains intact.
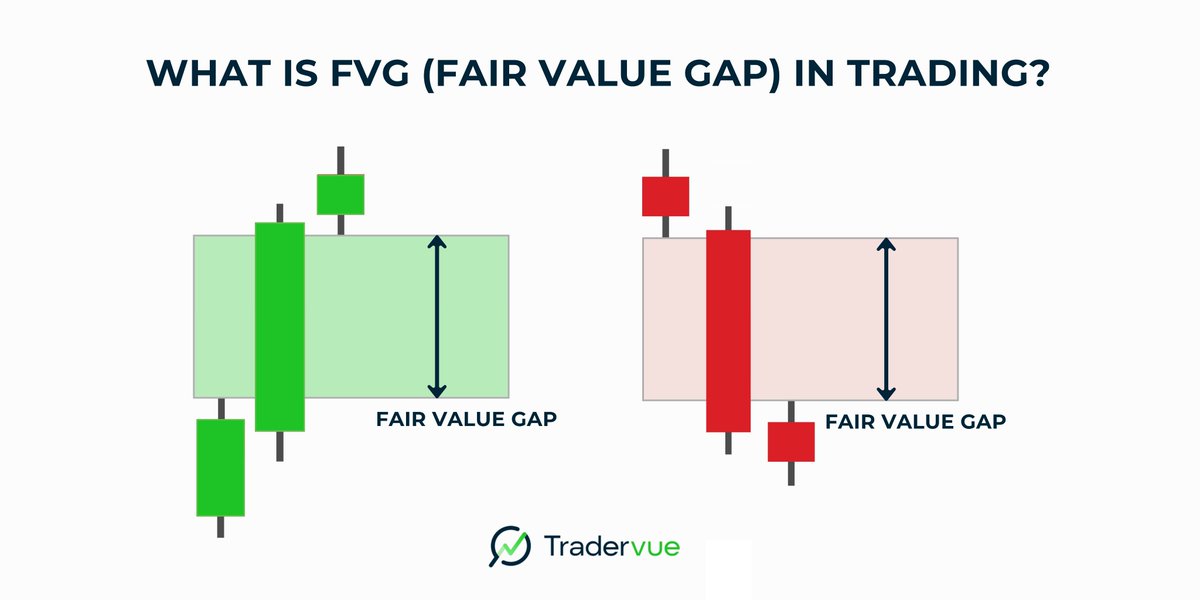
FAIR VALUE GAPS CONFUSE YOU?! Let's talk abouttttt it!!
Fair Value Gaps are one of the most slept on concepts in trading. When you understand them you stop guessing and start reading price like a real roadmap. Let me break this down in the simplest way possible.
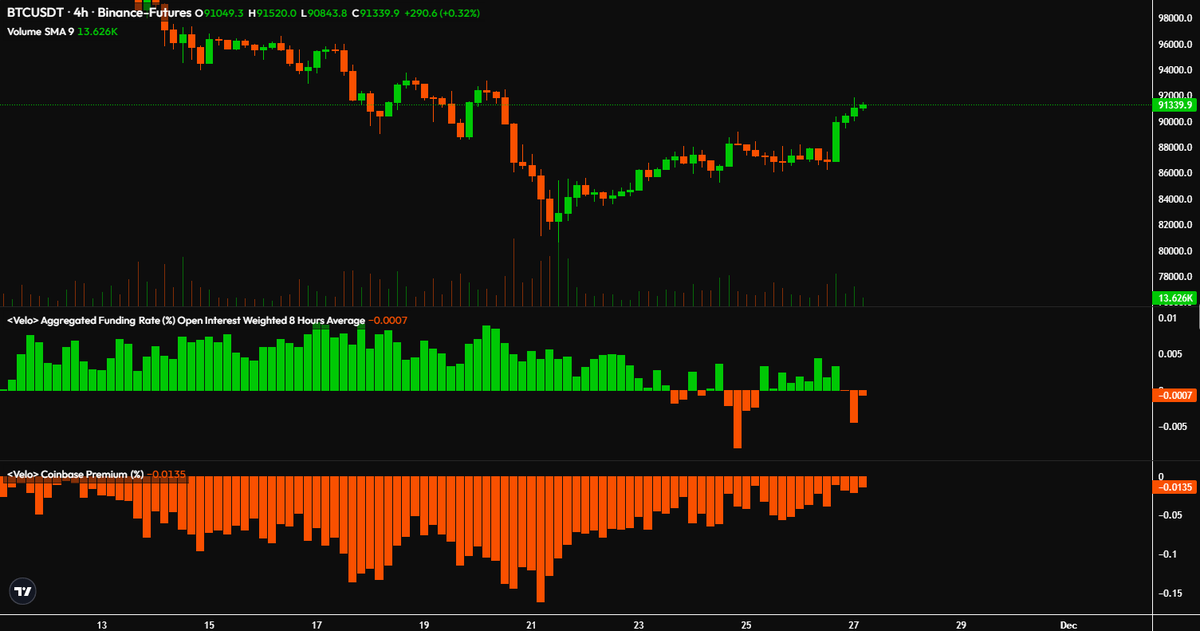
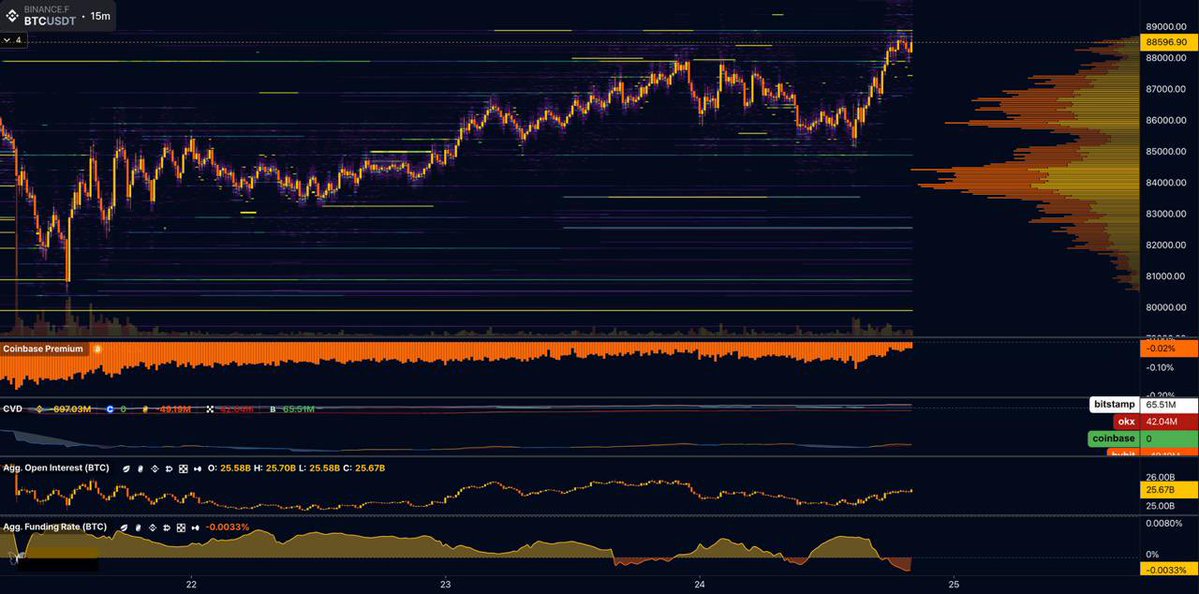
$BTC Is slowly seeing the Coinbase premium return and funding rates are turning negative.
Spot selling pressure is easing significantly compared to the 2 weeks prior.
You'll obviously still need to see actual bid to move price but this is a good start. Because the amount of sell pressure we saw previously, was pretty insane and no bid could withstand that.
People are shorting $BTC now.
Spot demand has appeared for the first time since October, and retail is taking the opposite bet.
You guys will never learn.
Stop chasing perfect entries, learn to adapt to market.
10 years of trading, this formula is how you maximize your profits and adjust your risk.
• RSI 70 → stay in cash
• RSI 60 → sell OTM puts
• RSI 50 → sell ATM puts
• RSI 40 → buy the stock
• RSI 30 → buy LEAPs
Simple, repeatable, and deadly effective.
Breve aggiornamento tecnico su #bitcoin
- Funding rate finalmente negativi (reset della leva finanziaria completato);
- BTC futures alla CME tornati in contango;
- CVD spot in ripresa (il rimbalzo in corso è chiaramente spot driven).
Se anche il Coinbase premium torna positivo (al momento si sta normalizzando verso lo zero), direi che stanno maturando le condizioni per un forte rimbalzo alimentato da uno short squeeze
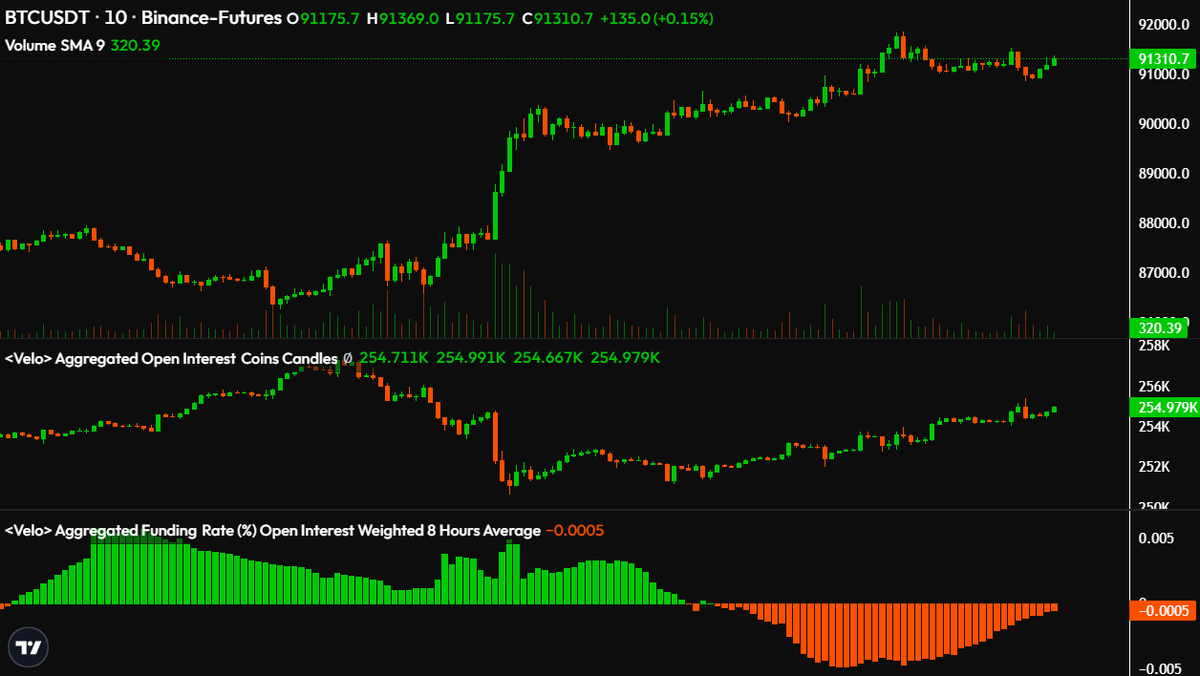
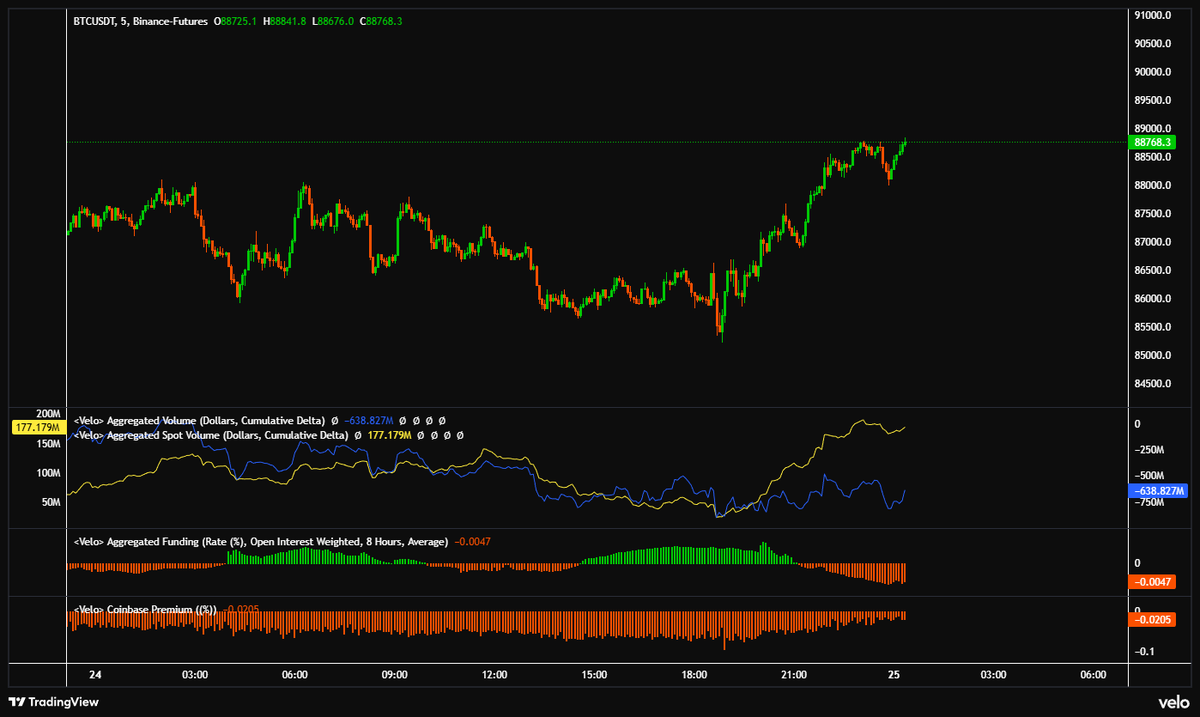
$BTC Buyers are dominating, spot CVD (yellow line) is going up rapidly while perps CVD is muted, plus we have negative funding and almost flat coinbase premium, good.
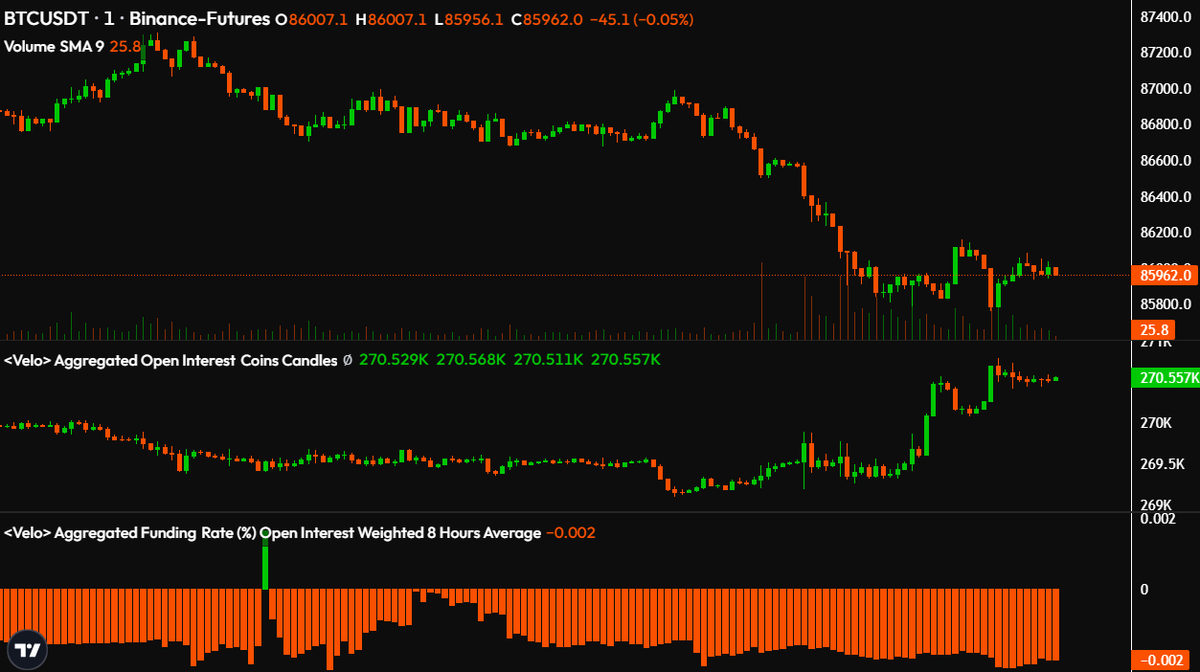
Open Interest is going up.
Price is going down.
Funding rate has turned negative.
Late shorters have arrived to the party, and this is one of the best bottom signals.