@100xAltcoinGems Baby Jesus is touching this genius and generous mind every day with his little holy feet.
Touched by our lord and savior, he shares his financial advices with everyone.
Thank you so much, you and your touches by little baby Jesus
@100xAltcoinGems Your inspiring work reminds me of Ghandi, Mother Teresa or George W. Bush.
Thank you so much for your huge contrubution to all people in the worlds. I cry in happiness when I think about your gift to humanity
💵💸100$ BUSD #Giveaway 💸💵
Time to celebrate the first 100 followers!!!
FOLLOW, LIKE, RETWEET & COMMENT
me your most favorite #100x#Altcoin down below 👇
🔥24hours left from now!🔥
If you're planning to buy more #crypto during the dip consider this:
DON'T buy the cheapest shitcoins.
Many of these projects are dead and won't EVER come back to their previous all time high!
Look out for value coins with good fundamentals / high quality.
1/4
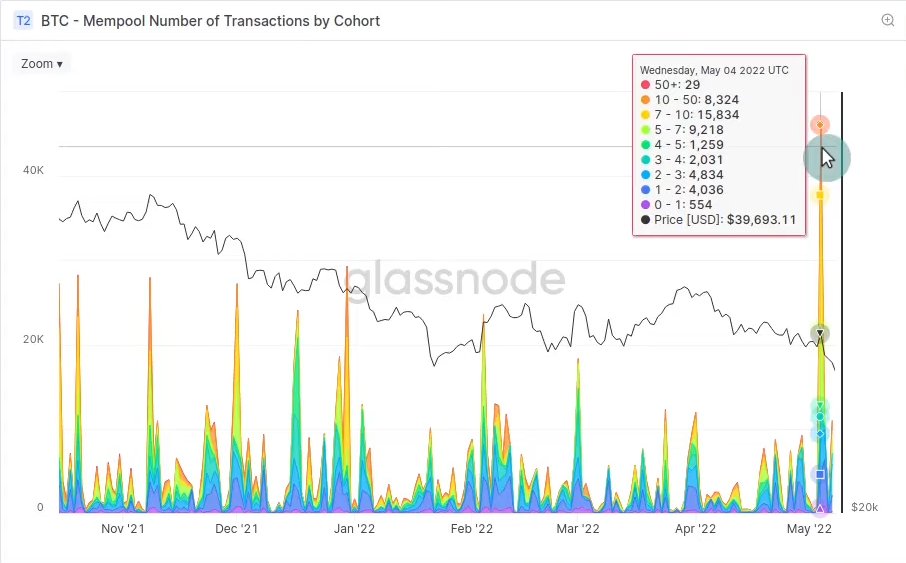
5/ Mempool Number of Transactions by Cohort
From Wed 4th to Thu 5th we see a massive increase of transactions during the big spike in price from 39.5k down to 35k.
People were suddenly reacting to the big price drop.
Orange/red shows they paid high fees for fast transactions.
We are now even closer to the last previous bear market where the maximum pain level was reached at around 50% of addresses and entities being in profit.
That doesn't mean the bottom is an and that there couldn't be more downside. Historically speaking we are very close though!
Week 19 On-chain summary from @glassnode
"Rate Hikes Drive Markets Lower"
[A Thread 🧵]
Starting with:
1/ Accumulation Trend Score
This tool tracks when large entities/whales and/or large portions of the market (aka shrimps in large numbers) are adding to their coin holdings.
6/ Exchange Fee Dominance
The big drop from Wed 4th to Thu 5th can also be seen on the exchanges inflow of #Bitcoins
(🟣 Wave)
Traders were sending their coins to exchanges to cash them out which led to a further price decrease.
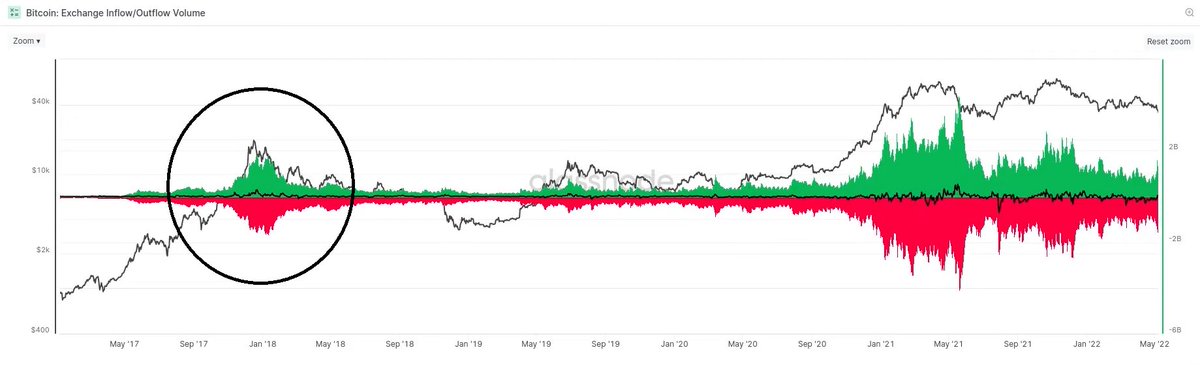
7/ Exchange Inflow/Outflow Volume
This metric shows the 🟢 inflowing and 🔴outflowing #BTC to exchanges.
The highlight here is the comparison of '17/'18 to every single day right now. The volume increased significantly and shows how much bigger the #crypto space got over time!
10/ Conclusion
The before shown metrics lead to the conclusion that weakness has appeared across numerous sectors on-chain & off-chain.
Capital outflows in stablecoin markets have occurred and weak prices are driven by poor sentiment.
Investors are derisking due uncertainty.
Thanks for reading and I hope you got some useful information out of this thread.
Follow me for weekly updates @_FreedomTrades
If you want to see all the details take a look at the
@glassnode video linked below:
https://t.co/wVnva8u6Cc
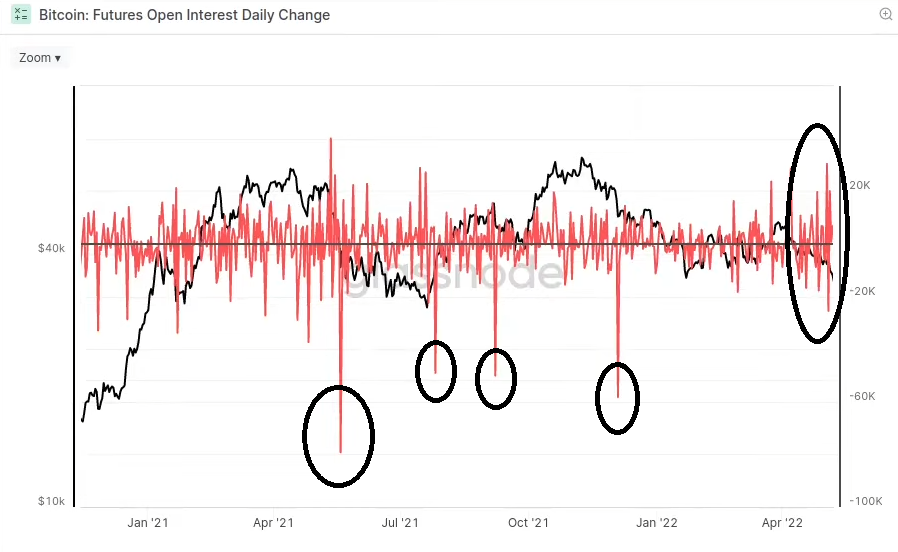
8/ Futures Open Interest Daily Change
Sometimes major drops in price are because of big liquidation cascades of leveraged trades.
The recent big drop in price was not a liquidation driven event this time.
It is the market reacting to macroeconomic forces.
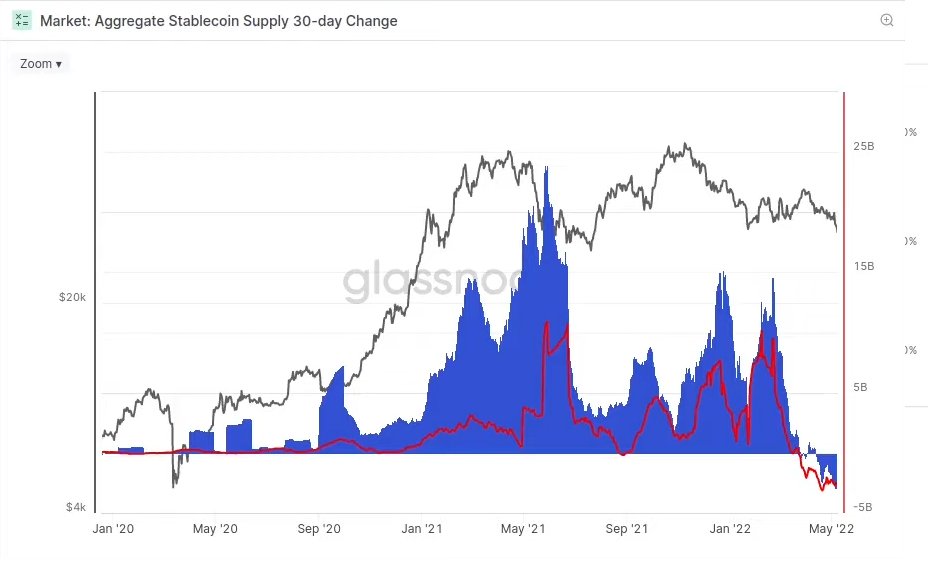
9/ Aggregate Stablecoin Supply 30-day Change
These last metrics show that the aggregate stable coin supply is currently decreasing, people are redeeming their stable coins (especially $USDC).
There is an overall desire to risk off.
We see a slowdown in the #crypto industry.


![_FreedomTrades's tweet photo. Week 19 On-chain summary from @glassnode
"Rate Hikes Drive Markets Lower"
[A Thread 🧵]
Starting with:
1/ Accumulation Trend Score
This tool tracks when large entities/whales and/or large portions of the market (aka shrimps in large numbers) are adding to their coin holdings. https://t.co/7ZpIiXOa36](https://pbs.twimg.com/media/FSUs0SsXIAEEYFb.jpg)


![_FreedomTrades's tweet photo. Week 19 On-chain summary from @glassnode
"Rate Hikes Drive Markets Lower"
[A Thread 🧵]
Starting with:
1/ Accumulation Trend Score
This tool tracks when large entities/whales and/or large portions of the market (aka shrimps in large numbers) are adding to their coin holdings. https://t.co/7ZpIiXOa36](https://pbs.twimg.com/media/FSUs1lOXEAIG7w8.jpg)