Hey Batman!
To me, RWA tokenization is like owning a slice of the real world, on-chain. Hear me out...
Imagine the Mona Lisa is worth $1 billion.
Nobody can buy it.
But what if you split it into 1,000,000 digital pieces and sold each for $1,000?
Now? Anyone can own a piece of the Mona Lisa!
Sounds crazy right?!?!
Alright, haha, enough with the jokes. Here is what RWA TOKENIZATION means for ME as an investor and its benefits:
First, it means access. I can now own a fraction of a Manhattan skyscraper for $50, which is previously impossible.
Second, liquidity. Real estate used to take months to sell. But since they are now tokenized? Easy as cake, sell them in seconds.
Third, they are borderless. A farmer in Indonesia can earn yield from US Treasury bonds, no bank account needed, no complex rules.
Fourth, transparency. Ownership of my assets are PUBLIC via Blockchain.
Lastly, yield. They are not just JPEG pictures... They actually give us yield, productive, exactly like how assets are supposed to be.
Now, my wish is so that i can tokenize a picture of my dog, so he can actually start paying rent now...
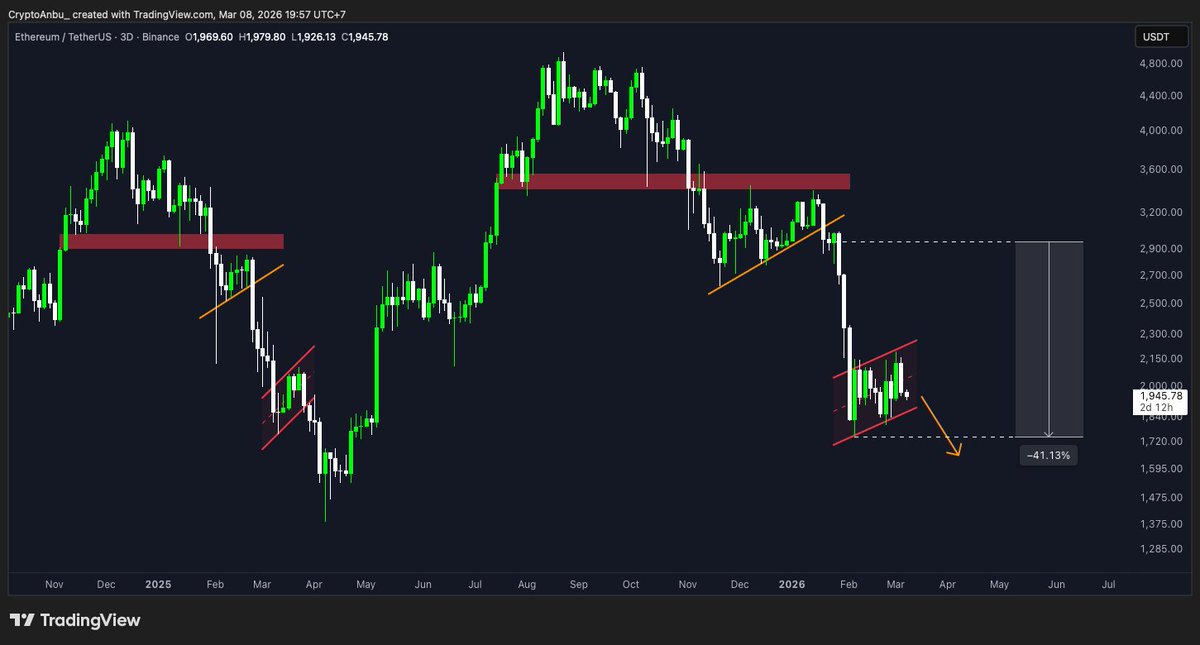
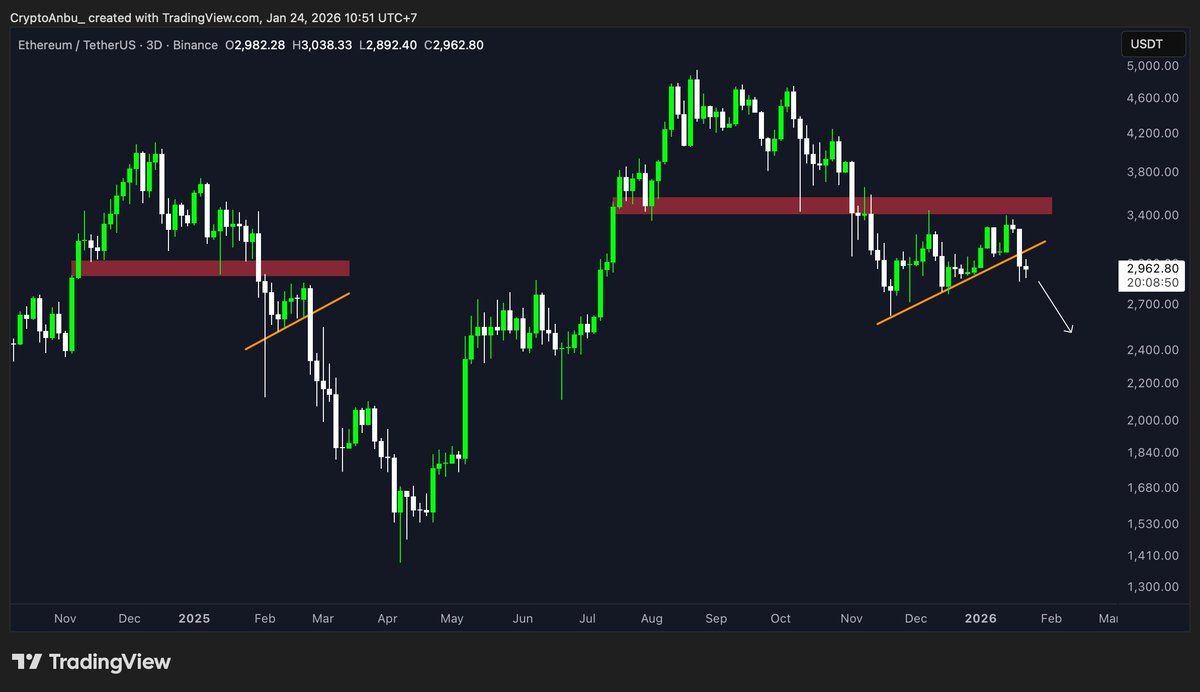
Yes, we should worried about Ethereum.
It’s showing the exact same structure that played out before a -50% crash.
Don’t stay in denial, this setup on $ETH looks no different.
This is all just Trump’s game.
It’s market making at the global elite level.
What’s the goal? Simple: let him and the big players buy cheap at the bottom.
But don’t panic. We’ve seen this play before. Let me walk you through it.
In 2025, tariffs basically turned into a “toy weapon” to control sentiment and steer markets.
Here I’m using $BTC as the asset class to study.
- In January, Bitcoin was trading around its ATH.A lot of people, especially early holders, had already taken profit and were just waiting for a chance to buy back lower.
So how do you create that opportunity?
You crush the market first. Here’s the shortened timeline:
- 1 Feb 2025 – Tariffs on Canada, Mexico, and China are announced.
- Feb–Mar – More tariffs, extensions, and constant “trade war” headlines.
- 2 Apr – Trump announces “reciprocal tariffs”.
- 3–8 Apr – Things escalate. China responds, raising some tariffs from 34% to 84%. Trade war mode ON.
- 9 Apr – Trump suddenly pauses reciprocal tariffs for 90 days for most countries (except China).
Clean execution. Bring prices down, spread fear, buy the dip, then press the "bottom" button. All recreational.
So get ready. Get your mindset ready. Get your capital ready.
Moves like this will keep happening as long as Trump is in office. The weapon will just rotate: tariffs, geopolitics, or whatever new headline they choose.
But at the end of the day? Money will be made. And that’s the whole game.
Seems like i was a couple of weeks too early.
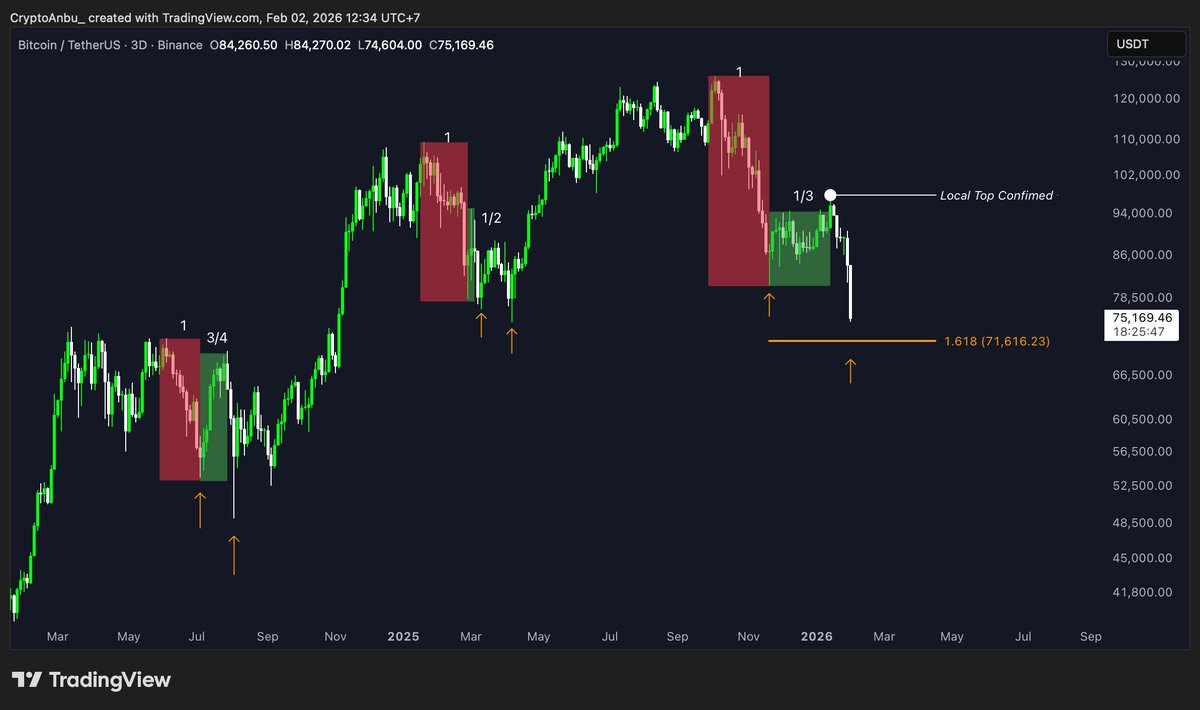
Nonetheless, Bitcoin still made it here.
Now that the local top has recently been confirmed, i can mark the potential bottom area through the 1,618 fibonacci area.
$71K-ish, that's a solid number.
Generational opportunity, $BTC.
A deep dive on Bitcoin's price structure.
If you’ve been following my recent $BTC updates, you can tell that my bias has been leaning bearish.
More accurately, it’s not “bearish forever,” but I do believe that sooner or later Bitcoin will still print a new low before it can properly kick off the next leg higher.
Can it go straight up from here? Sure, it’s possible, but in my view, it’s unlikely.
Here are the key points I’m watching:
- The Drop vs The Rebound
You always have to measure the size of the rebound against the size of the dump.
If the selloff is big, but the bounce is small, it tells you that the downside wasn’t met with equal buying interest.
That usually means either there’s no one eager to absorb the sell pressure, or people are simply too pessimistic to buy the dip.
We could see that in past bottoms, the rebound is much more equal relative to the drop.
That shows how the market is optimistic in buying the dip, hence pushing the prices to a newer high much quicker.
- Lower low structure
It’s very rare for a sharp dump to get fully absorbed and then price just teleports back to the previous high.
Historically, Bitcoin’s major bottoms tend to form with a fresh lower low, at a point where most people have already given up on the idea.
Right now, $BTC has already dropped a lot, but the rebound so far doesn’t match the magnitude of the move down, in fact, it is the weakest rebound we've seen since the bull run started.
That’s why I’m still skeptical in the short term, but I still believe we’ll see a new ATH sometime in 2026.
There is nothing new under the sun.
Every human experience, event, and innovation is cyclical and repetitive.
The same goes for financial markets and price structures.
Here’s a closer look at $BTC and how its last cycle top was formed:
In the last cycle, extreme price volatility, both up and down, created a massive sideways range. That’s what formed the two massive tops.
Funny enough, that’s exactly what we’re seeing now with Bitcoin, with the $125K high in October acting as the second top.
The final trigger that started the bear market was price nearing the 50% level of that range, backed by a clean bear flag.
And once again, that’s exactly what we’re seeing now.
Now, all my recent posts have been leaning bearish. Not because I’m a hater, but because what’s happened before often becomes the roadmap ahead.