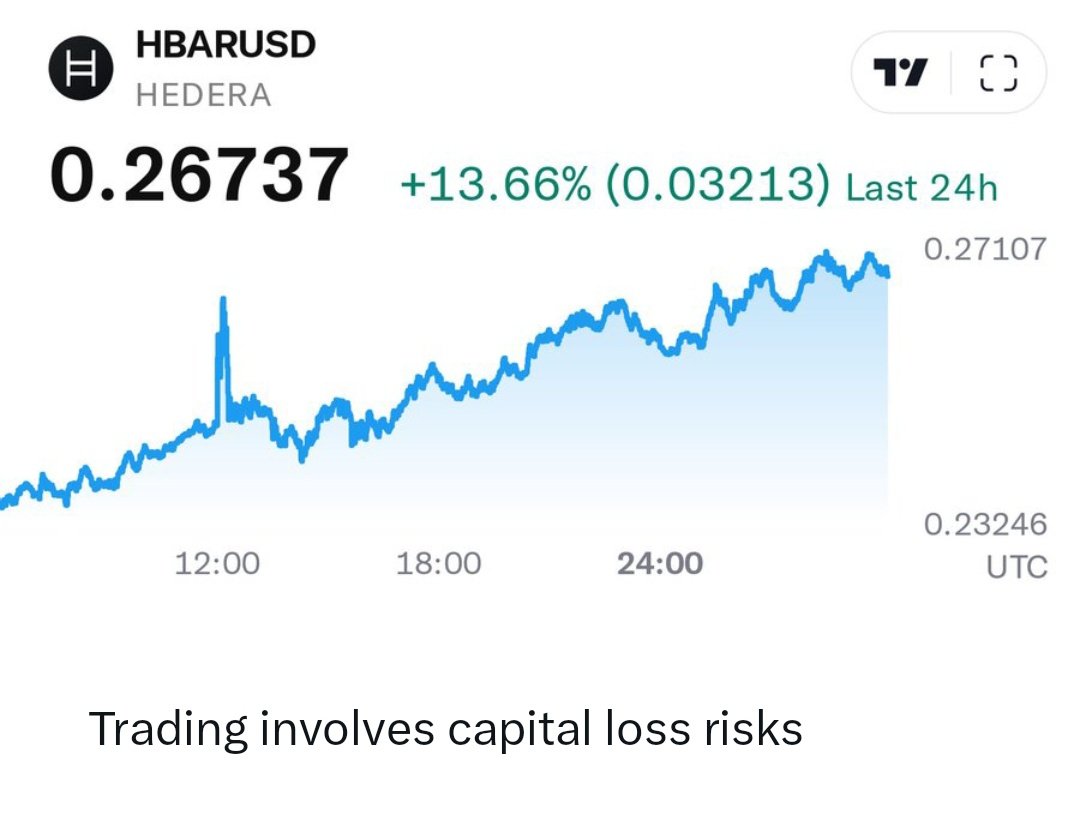
$HBAR reaching $5 may happen sooner than expected.
@Hedera continues to gain momentum, with major enterprises building on the network — and thriving.
All signs point to #Hedera becoming a key player in the future of decentralized tech.
🔥 *Sigma AI Browser – Powered by CRYPTO CRED* 🔥
🚀 Grab the next‑gen AI browser that’s boosting your crypto game! 📈
👉 *Download Now* and ride the green line to smarter browsing & secure crypto deals.
@SigmaAI#CryptoBrowser@Sigma_Browser
Sigma Built Different Control_
Yo, that video slaps! The vibe is straight‑up futuristic with that neon graph and the “built different” energy. Looks like a hype reel for someone who’s mastering the game of control—whether it’s data, finance, or personal grind. @Sigma_Browser
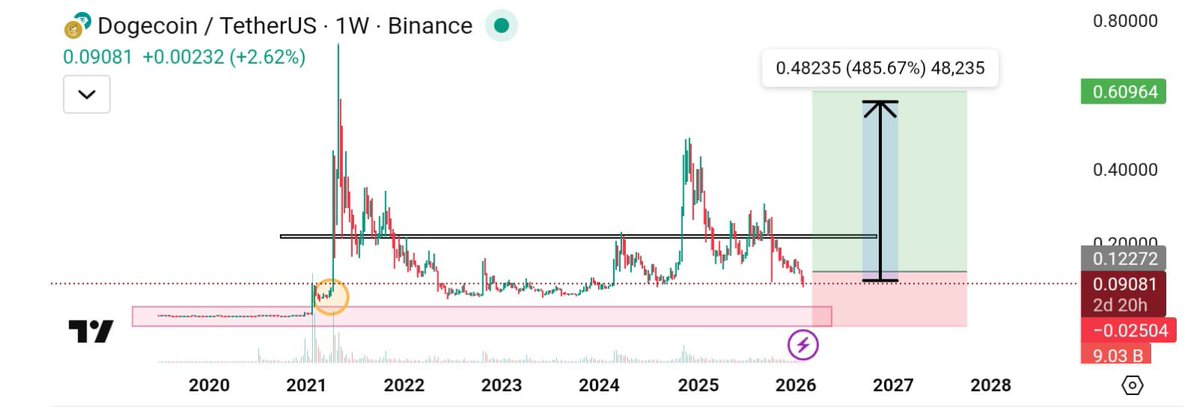
$Dogecoin (DOGE) is up +2.62% in the last week, trading at 0.09081 USDT on Binance.
Watching the breakout zone – could be setting up for a big move!
#DOGE#Crypto#Binance
Bitcoin/TetherUS (BTC/USDT) weekly chart
BTC is trading at *77,314.04 USDT*, down 1.84% (-1,449.07). The price is testing the lower end of a consolidation zone after a strong 2023–2024 rally. Watch for a breakout above the upper gray resistance (~120k) for bullish momentum
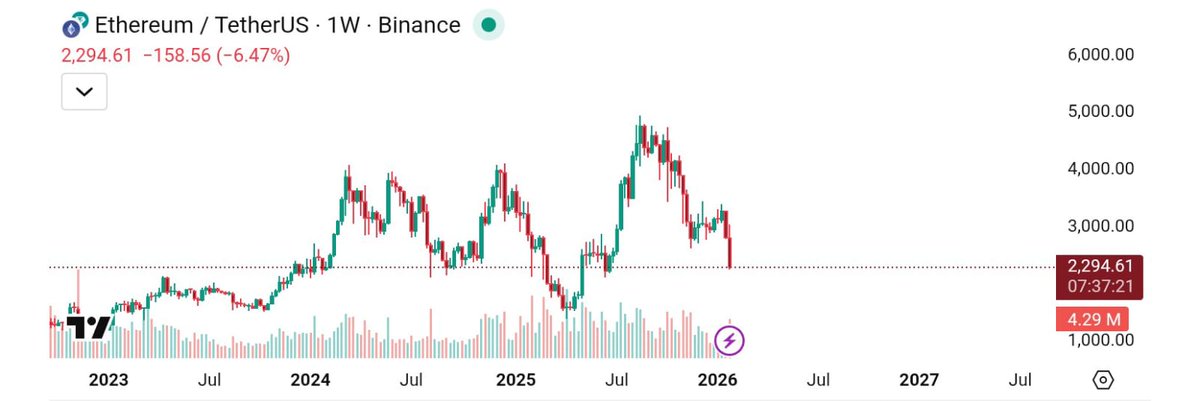
$Ethereum (ETH/USDT) weekly chart on Binance shows ETH trading at 2,294.61* with a drop of *₮158.56* (−6.47%).
The price has slipped below the key support around 2,300, signaling a bearish short‑term trend after the mid‑2025 peak.
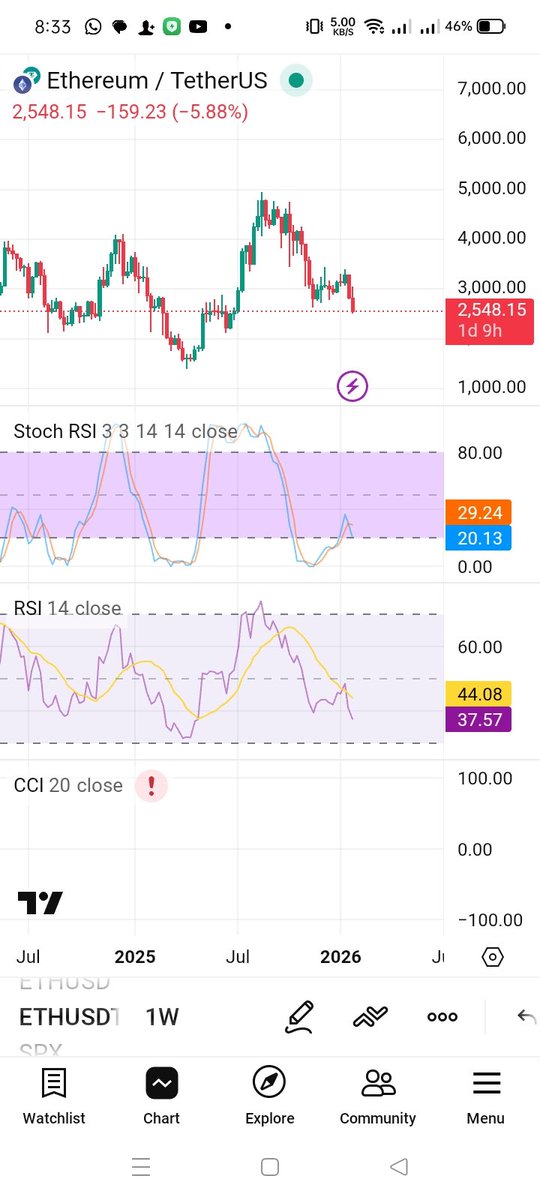
$Ethereum/USDT is down *5.88%* today, trading at 2,548.15 after a 159.23 drop.
Stoch RSI shows values 29.24/20.13 (oversold zone).
RSI (14) sits at 44.08, near neutral.
CCI (20) is 37.57, signaling bearish momentum.
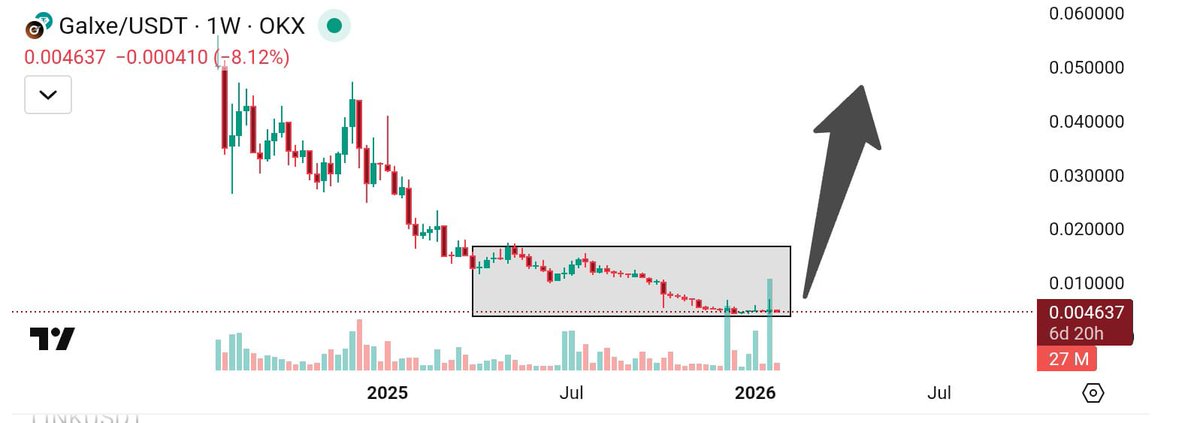
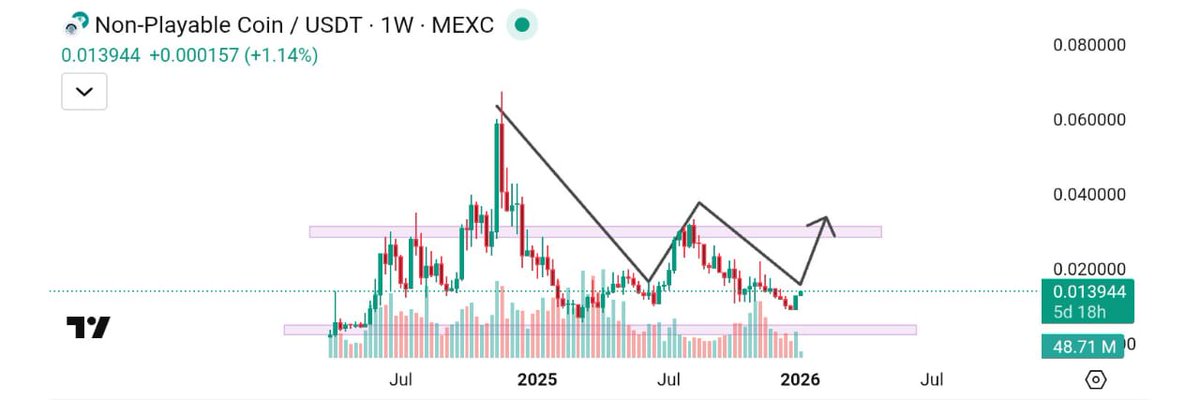
$Galxe/USDT* weekly chart
Current price: *0.004637 USDT* -0.000410 (-8.12%).
The pair has been in a sharp downtrend since early 2025 breaking below key support around 0.010000.
The highlighted box shows consolidation in 2025–2026, with weakening volume (volume bars shrinking
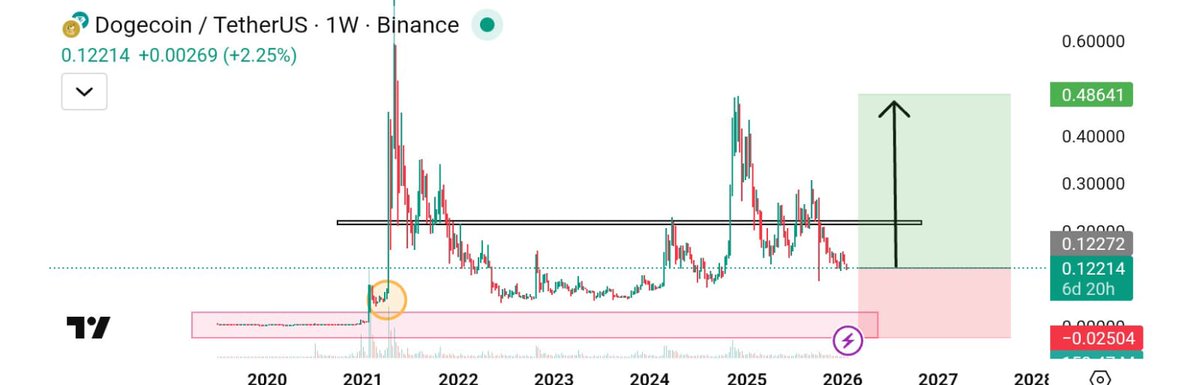
$Dogecoin / TetherUS (DOGE/USDT) weekly chart
Current price: 0.12214 USDT (+2.25% in the last week).
Technical outlook: DOGE is sitting in a key support zone (pink area).
The orange circle marks a past breakout that could hint at a similar move now.
#Dogecoin#DOGE
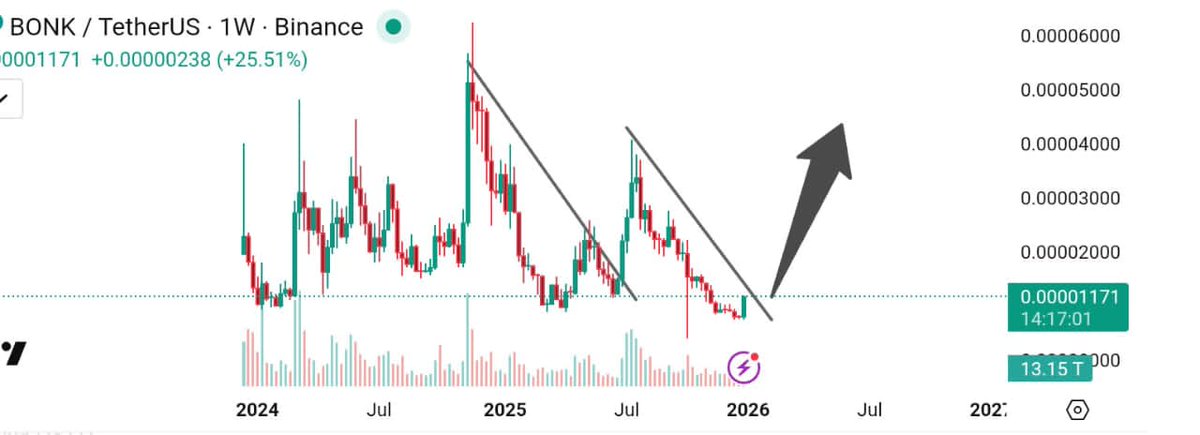
$BONK (BONK/USDT) weekly chart is shouting breakout vibes!
The price has ripped through a descending trendline & just hit a fresh
support level around 0.00001171, up 25.51% in the move. The arrow signals potential bullish
$Zcash (ZEC/USDT) is breaking out!
Current price: *449.60 USDT* (+1.26%
The 1D chart shows a bullish move with the green arrow pointing to a potential upward swing toward the next resistance near 600–800 USDT.
#Zcash#ZECUSDT#Crypto
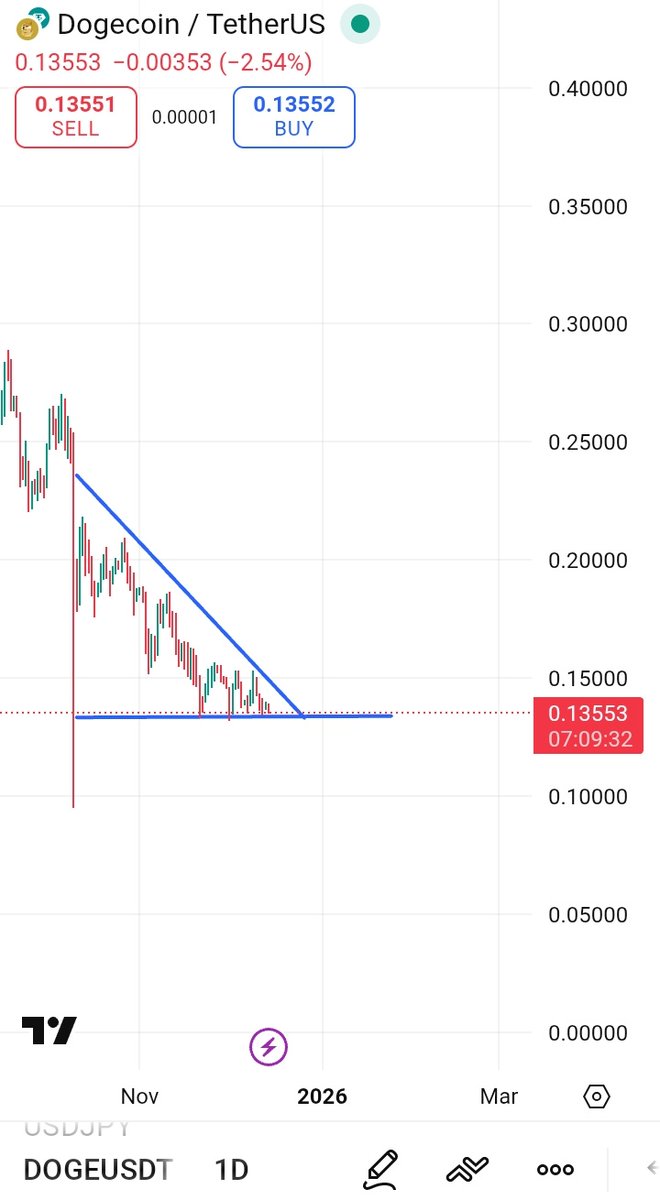
$DOGE Technical Analysis
Dogecoin/USDT is trading at 0.13553 with a -2.54% move. Price is compressing near a descending trendline and a strong horizontal support at ~$0.136.
📊Key Levels
- Support: $0.136 (critical zone)
- Resistance: Descending trendline (breakout target)
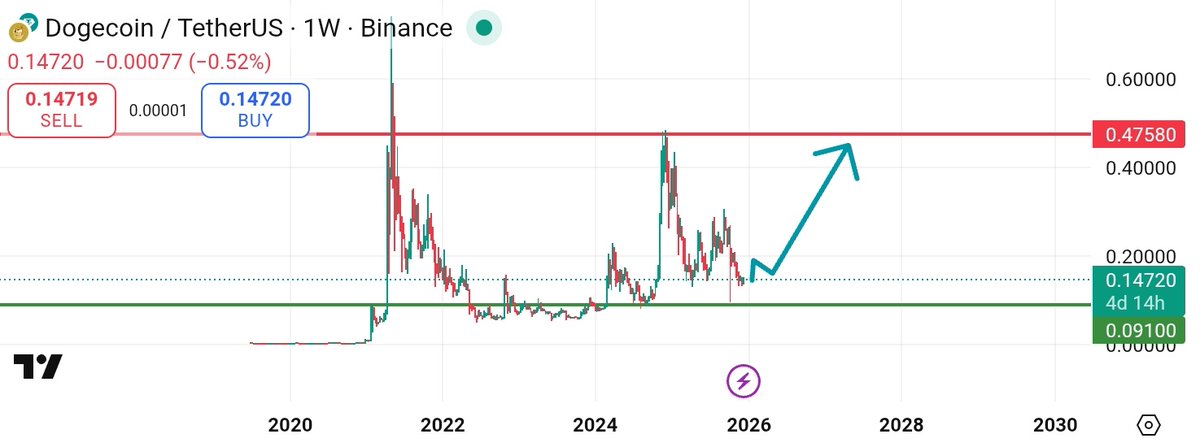
$Dogecoin / TetherUS (1W) chart on Binance is looking bullish!
Current price: *0.14720 USDT* (-0.52% drop today).
Sell at *0.14719* | Buy at *0.14720*.
Key levels: resistance at *0.47580* (red) & support at *0.09100* (green).
#Dogecoin#DOGE#Crypto