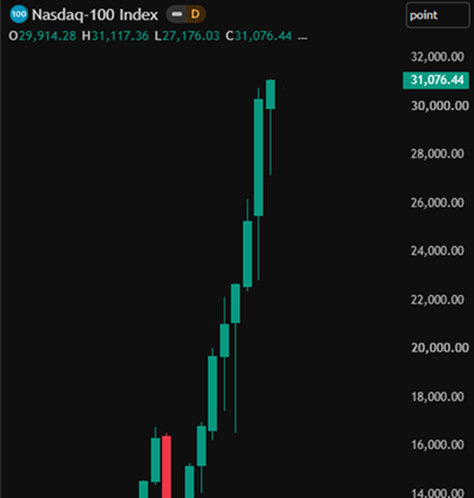
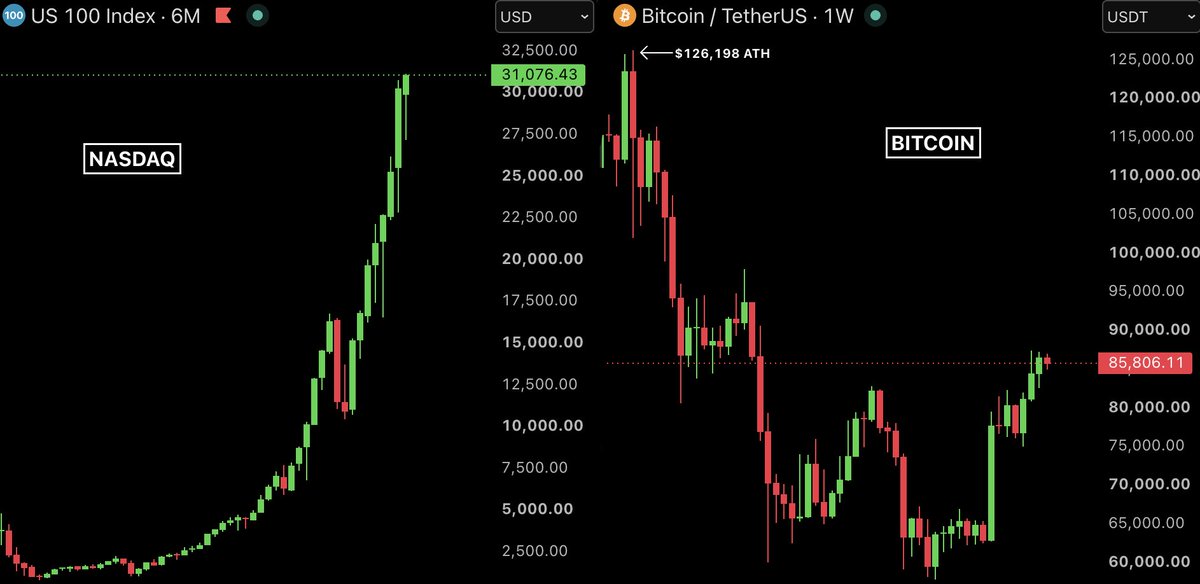
🚨BREAKING: The Nasdaq 100 is now up more than 150% since Michael Burry warned investors to sell in January 2023.
It closed at a historic high of 31,076 today, its second record close in a row.
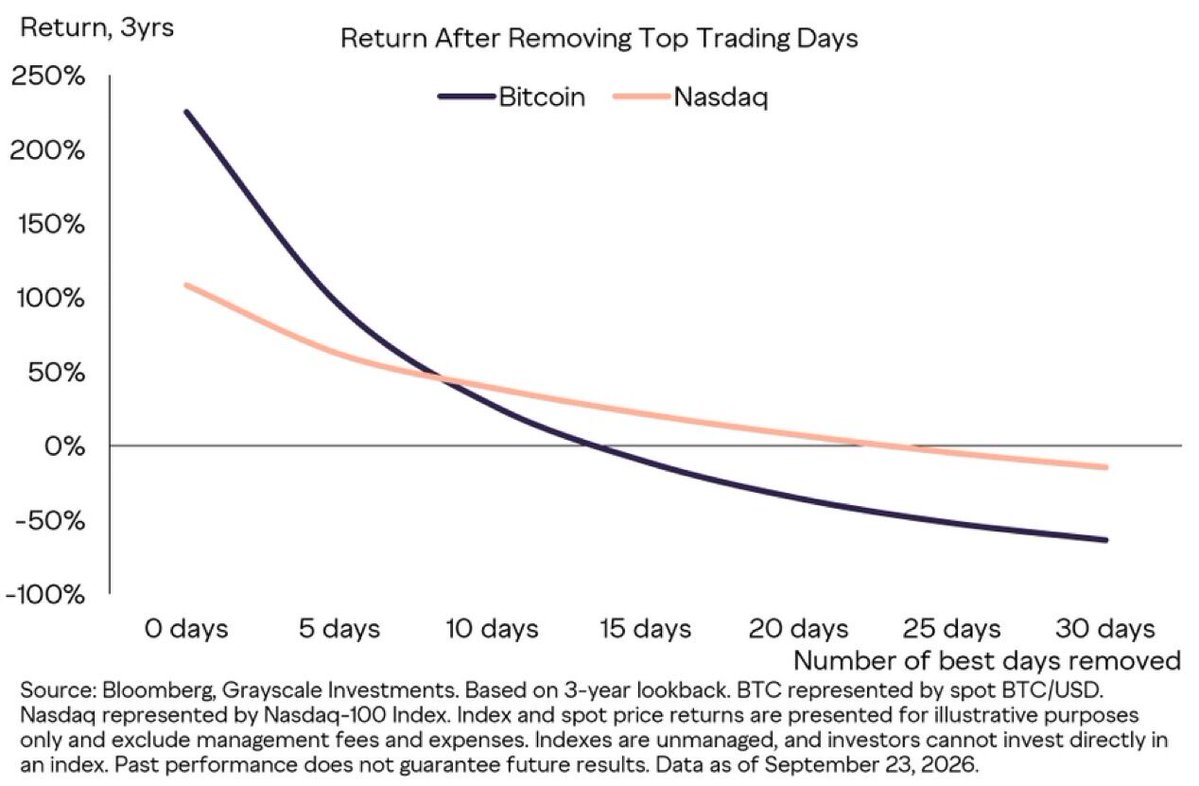
🚨 INSIGHT: Grayscale says Bitcoin returned 225% over three years versus Nasdaq’s 109%, but missing BTC’s five best trading days cuts its return to 95%.
🚨 DOGECOIN IS TURNING BULLISH 🚨
$DOGE is moving up from a multi-year support zone and has broken above a multi-year downtrend line. DOGE pumped more than 500% from this level in 2024.
Will Doge repeat history this time? 🚀
LATEST: 🇺🇸 CFTC Chair Michael Selig says Congress "failed to deliver" the CLARITY Act but pledges to establish a crypto regulatory framework anyway, using the CFTC's existing authority.
It happened again.
The original post was pretty much the top for GOLD.
During that time, the metals guys were absolutely euphoric, grave dancing on Bitcoin.
The Bitcoiners were also being doomers saying that when GOLD drops, Bitcoin will go with it.
Fear was everywhere, as usual.
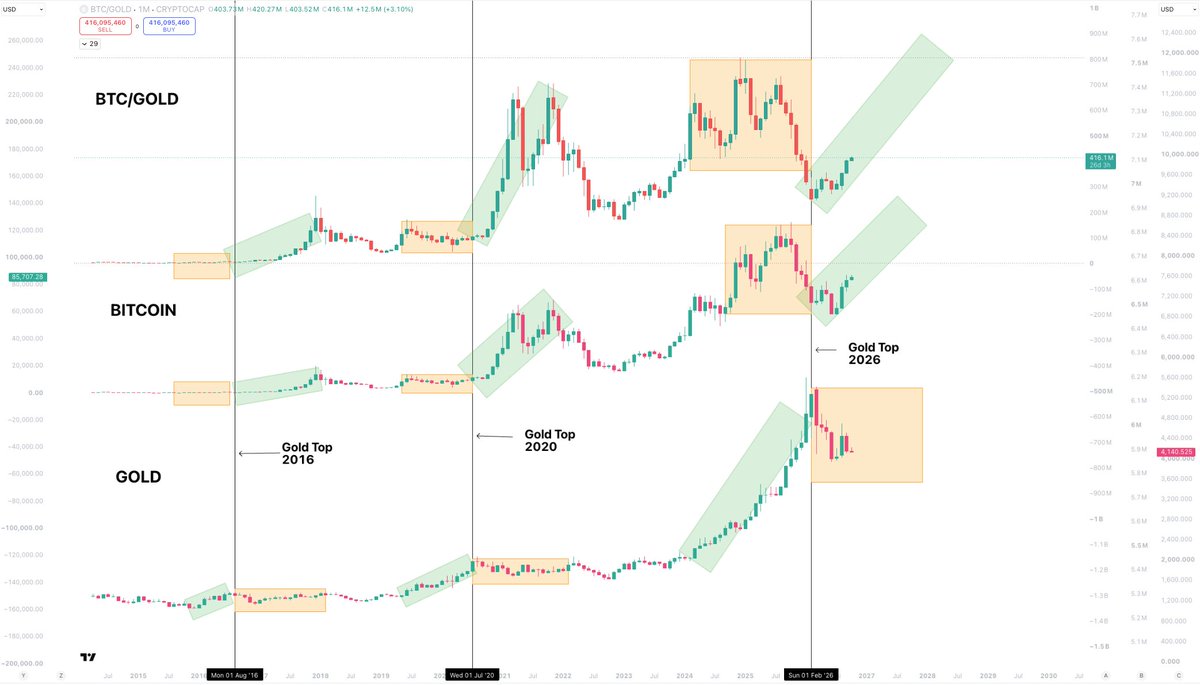
But back then, when I analysed the situation, it was very clear to me that things were just playing out like they always have with GOLD/BTC rotation.
This setup here, back in Jan/feb last year, was already showing us how much different of an overall cycle position we were compared to what everyone thought.
But this analysis was getting laughed at.
Now, 9 months on, we can see it played out exactly like it always has, and exactly how I expected it to.
As GOLD topped, Bitcoin bottomed.
Then, GOLD has gone on to drop/consolidate...
And Bitcoin has gone on to bottom/reverse.
BTC/GOLD literally bottomed a week after my original post.
Which was the time metals guys were euphoric and crypto was in a dark depression.
After every major GOLD run and subsequent top, Bitcoin has entered its most explosive phase of its cycle.
Every single time.
This is simply another large piece of data that now confirms we did not see a full cycle high.
That is yet to come.
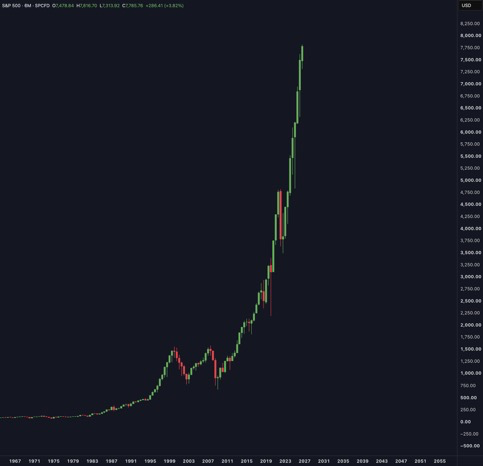
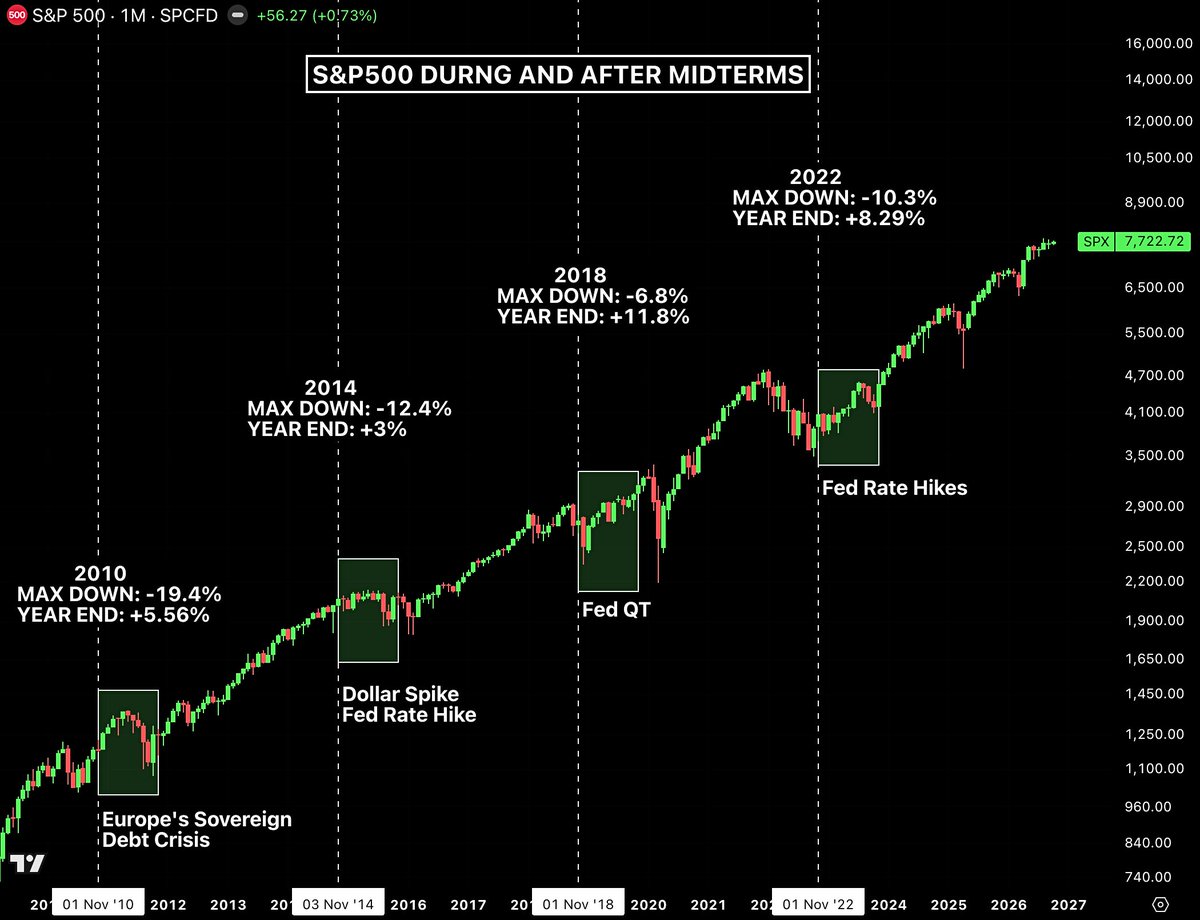
HISTORY SAYS THE NEXT 12 MONTHS COULD BE VERY BULLISH FOR S&P500
Since 1950, the S&P 500 has gone up in the 12 months after every single US midterm election.
A separate dataset going back to 1942 finds the same thing in the November to June window after a midterm: 21 for 21, also positive every time.
Year 3 of the presidential cycle, the year right after the midterm, has also historically been the strongest year of the entire 4-year cycle.
Fidelity's 1961-2024 data puts the average at 18.7%.
Here's why this keeps happening.
Before an election, markets have to price every possible outcome at once: who controls Congress, which taxes get cut or raised, which regulations pass or die.
Nobody can commit real money when 5 different futures are still live.
That's why midterm years are historically the weakest part of the 4-year cycle, averaging just 3.8% from 1945 to 2025, compared to 10.9% in the other three years, with an 18% average drawdown along the way.
Once the result is locked in, that entire range of outcomes collapses into one.
Markets don't need the winner to be market friendly. They just need the unknown removed, and removing the unknown alone lowers the risk premium investors demand to hold stocks.
This pattern has survived completely different crises, for completely different reasons, every single cycle:
After the 2010 midterms, the US was still digging out of the financial crisis.
The Fed launched $600 billion of QE2, buying long term Treasuries to push yields down and force money into riskier assets.
It worked, until 2011, when the US debt ceiling standoff led to the first-ever downgrade of US credit, and Europe's sovereign debt crisis exploded at the same time.
The S&P fell almost 19% at its worst point that year. It still finished the year positive.
After the 2014 midterms, the US economy and labor market looked fine, but oil prices collapsed and the dollar spiked, gutting earnings across the entire energy sector.
Then in 2015, China devalued its currency and its economy slowed sharply, triggering a global risk off panic, right as the Fed prepared its first rate hike since 2006.
The S&P barely survived, finishing up just 3%, the weakest year in the entire 76 year record.
But It still didn't break the streak.
After the 2018 midterms, the Fed had hiked rates 4 times that year and was still shrinking its balance sheet.
Trade war fears with China pushed the S&P to the edge of a bear market by Christmas Eve.
Then Fed Chair Powell reversed course in early 2019, signaled patience, stopped hiking, and eventually cut rates 3 times.
Big tech earnings stayed strong and the US and China moved toward a trade truce. The S&P went on to gain nearly 29% that calendar year.
After the 2022 midterms, inflation had just peaked at 9.1%, the Fed was still raising rates, and most of Wall Street was calling for a recession.
A cooler than expected inflation report landed right after Election Day, convincing investors the Fed was close to done hiking.
Stocks can explode while a central bank is still raising rates, because markets price where policy is heading, not where it sits today.
Through 2023, the expected recession never came, the Fed slowed down then paused, and a generative AI boom sent Nvidia and the rest of mega cap tech into one of the biggest rallies in years.
Four different decades.
Four completely different crises, a debt downgrade, an oil crash, a trade war, and the fastest rate-hiking cycle in 40 years.
The S&P 500 closed positive after every single one.
This just keeps happening again and again.
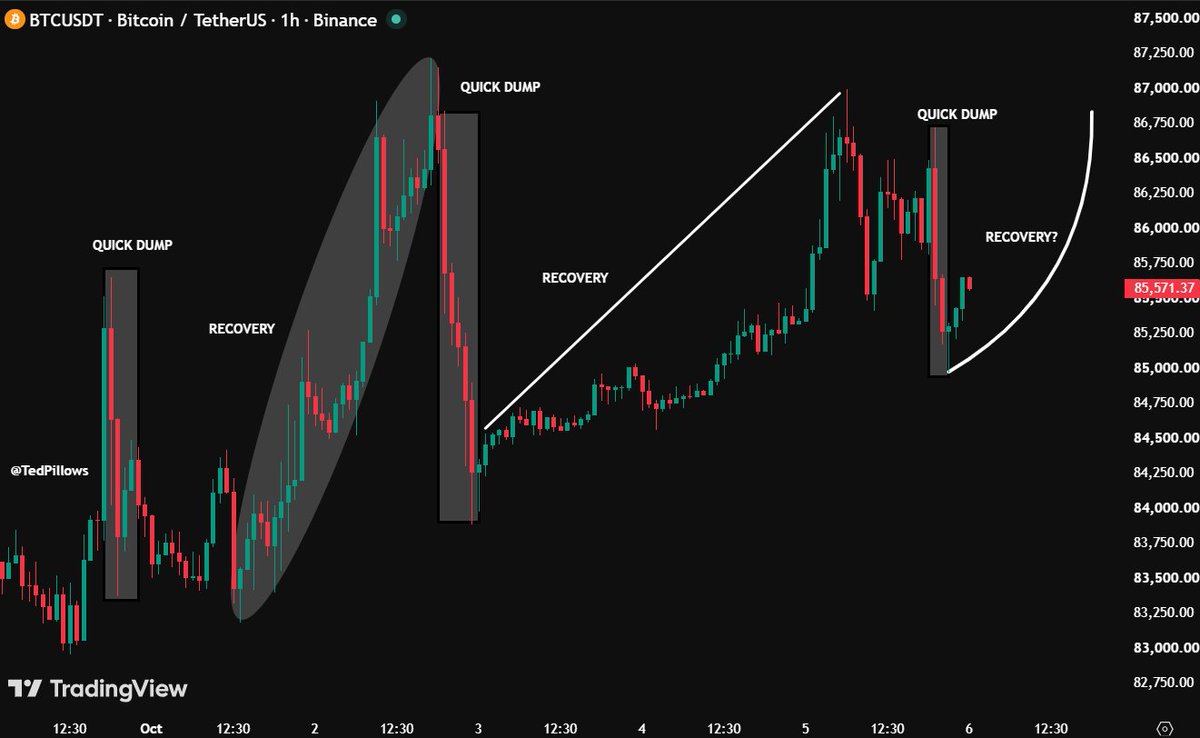
$BTC slowly grinds down.
Someone slams it hard.
Recovery and Bitcoin go even higher.
Someone slams it again.
And the process repeats.
What's even more interesting is that every dip is forming a higher low here, which means buyers are stepping in aggressively.