Trying to rebuild my profile because X decided to X me for NO REASON. Cautionary Tale for any Influencer with a moderate amount of followers. @IntractAmbassador
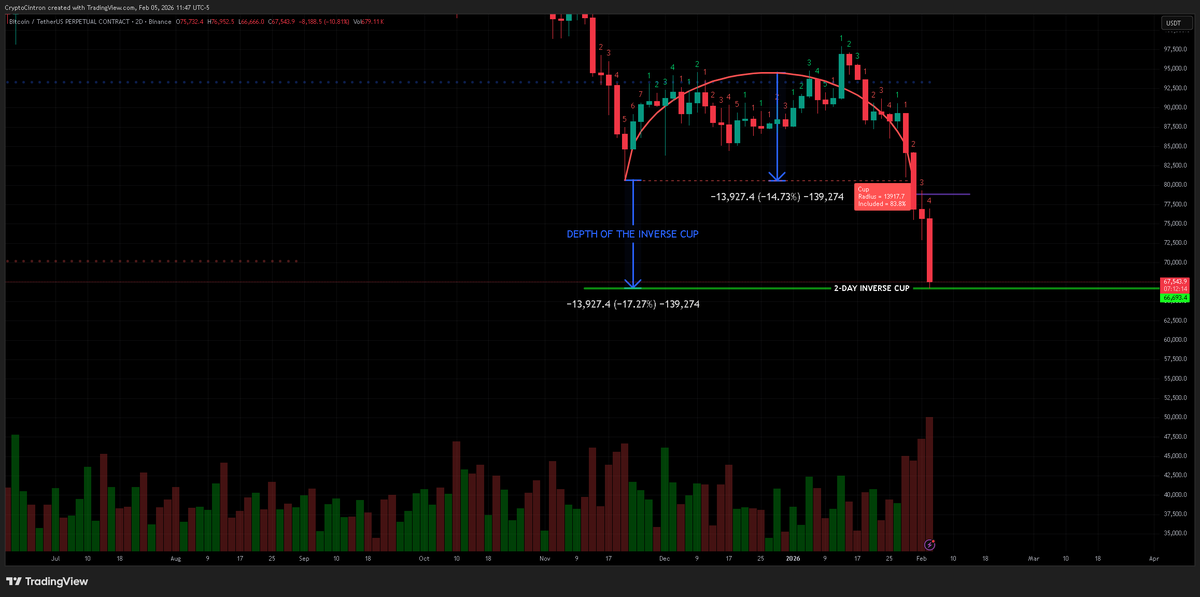
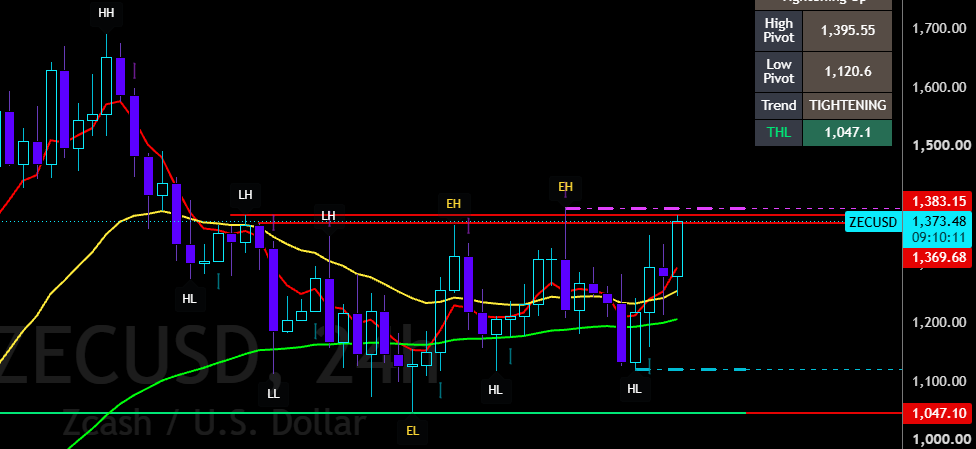
Look how accurate this Cup Finder (by LonesomeTheBlue) Trading View indicator can be. 👀🤯
It's FREE starting from the lowest tier subscription.
I typically measure the depth of the cup and apply that distance to the rim of the cup. Voila.... you have an important level marked out. Sometimes the exact trend reversal point.
https://t.co/K6HKnN8pbV
#TradingView #Crypto #StockMarketCrash #Bitcoin #BTC #CryptoRecovery
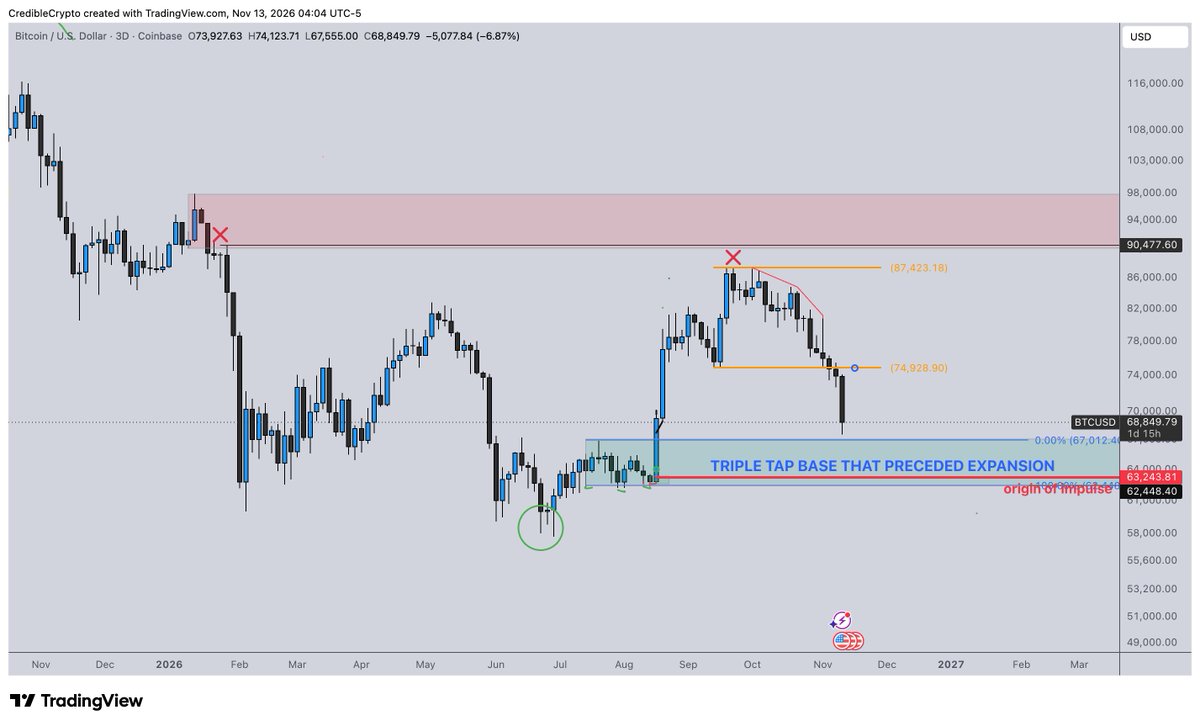
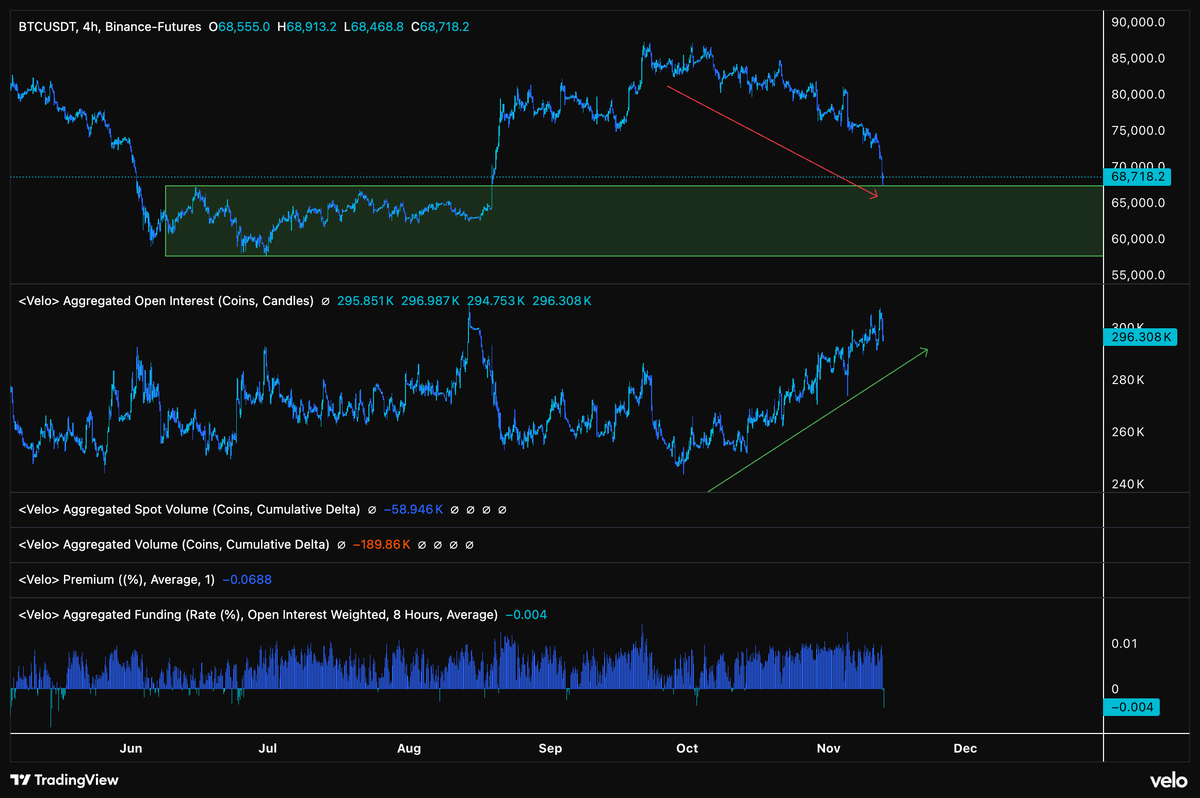
Was expecting this zone on $BTC to be tested *after* our squeeze to 90k+- leaving this zone behind is what had me concerned about a push to 90k+ not sustaining.
Now that we are getting it sooner rather than later- that is no longer a concern for me- so once we reverse should be looking for higher than 90k targets now.
Don't think we are headed for new lows aka expect our lows at 59k to hold. Still haven't tested our blue zone so think we have a bit more to go, but almost there.
As per recent charts on $XRP, $ETH, $CRV, $CVX, hedera-hashgraph:native, etc, everything else is lining up for a macro bottom across the board as well, so the confluence is nice to see.
Under the hood OI is still at local highs and funding is actually starting to flip negative, which tells me that short squeeze is likely still coming and it will be big when it does.
Hang in there folks, worst of the drop should be over imo.
How I actually draw support and resistance
Zones on candle bodies, not wicks.
Two closes beyond a level before I call it broken.
A 3rd or 4th touch is a warning, not a confirmation.
This is what keeps me out of most fake outs. Free lesson + full video:
https://t.co/ZbJjzcNHC8
10,000 is coming.
The pullback I called for is here, and it was part of both paths.
Now the question is which one plays out:
Path 1: the bottom is in or close, and we head higher from here.
Path 2: a deeper correction first, then 10,000.
I’m leaning Path 1.
Which one are you betting on?
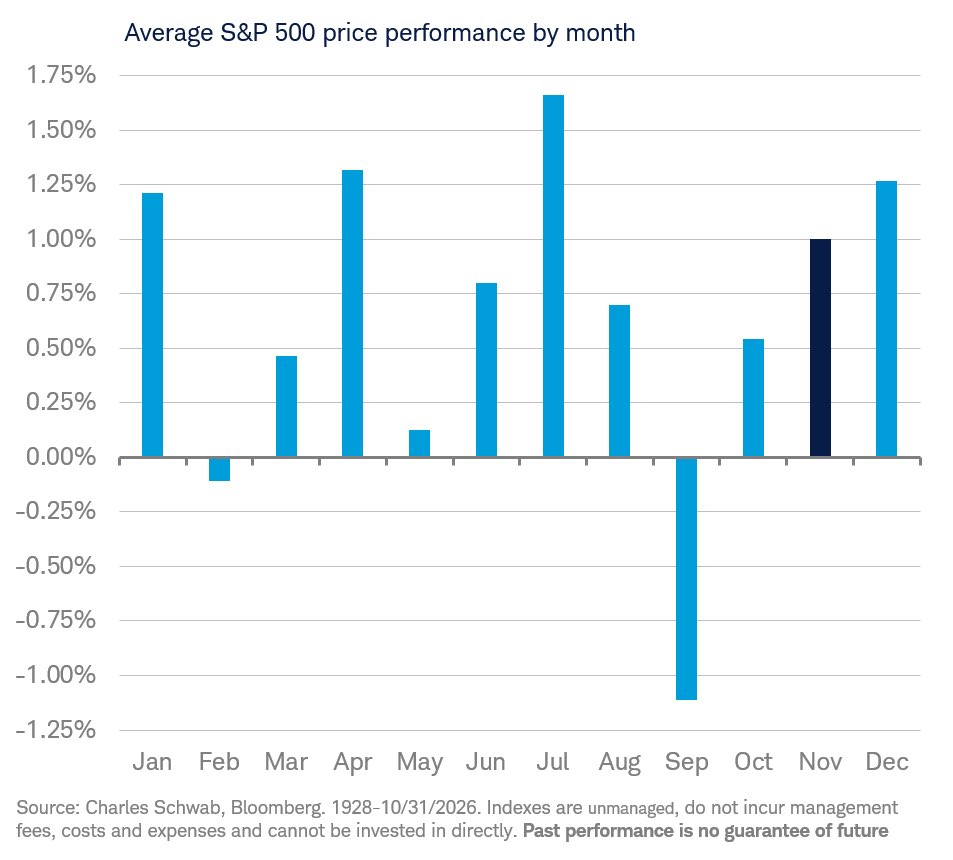
Since 1928, the S&P 500 has posted an average return of +1.0% in November … gains were recorded 62% of the time … best November +12.0% and worst November -13.4%
The shorts may have a problem.
Tech just printed one of its biggest hammer candles in years. Sentiment is approaching capitulation, and the post-midterm playbook is turning bullish.
This could get violent.
https://t.co/I2uhQbs997
@WallStreetApes Doubling down on misleading posts again, I see. The results mostly check out. The campaign slogans dressed up as ballot descriptions? Less so. Conveniently leaving out who pays, who’s taxed, and what actually changes is quite the commitment to “informing” people.
@WallStreetApes Just take the MAJOR loss as a lesson....stop listening to Grifting pedo's and the KOL's that peddle their nonsense..What did you say 2 years ago? THE PEOPLE HAVE SPOKEN...deal with it.
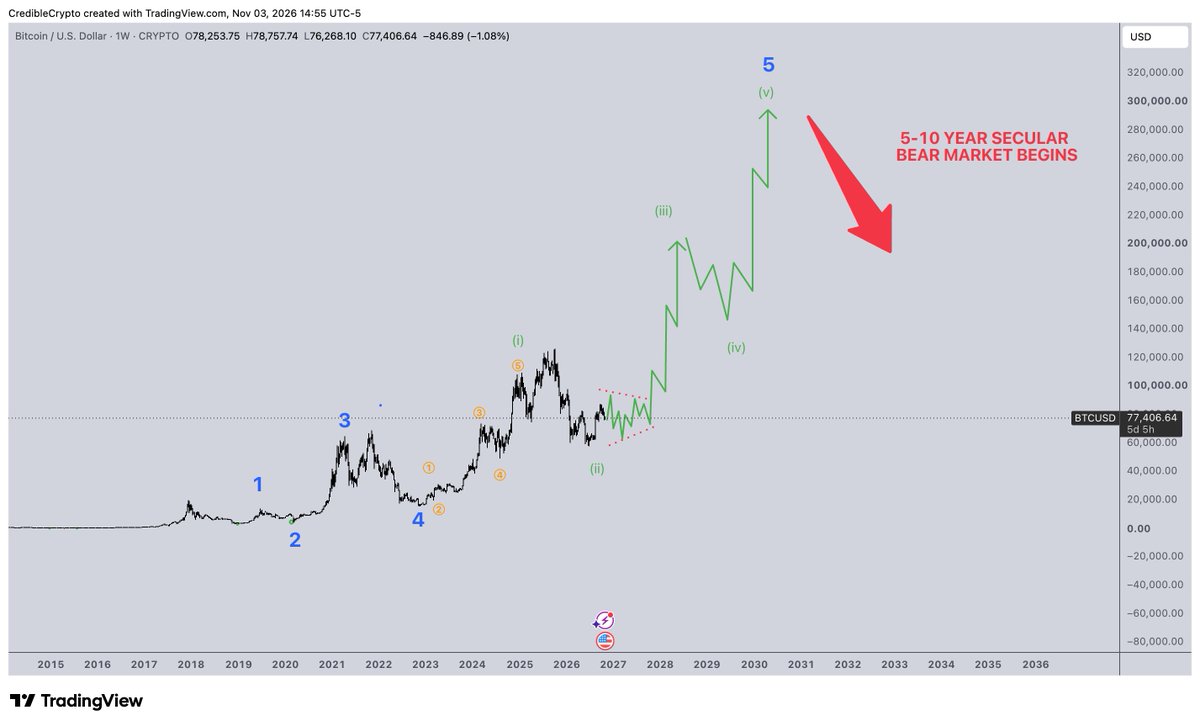
In my last macro $BTC update on Youtube, I shared two "primary" scenarios that I believed were most likely to play out.
We've been in the current correction long enough at this point to eliminate the first, which means it's now my belief that the 2nd of the two is now the most likely macro idea to play out.
Higher, for longer.
But first, you gotta make it through the current correction/chop.
$SPY
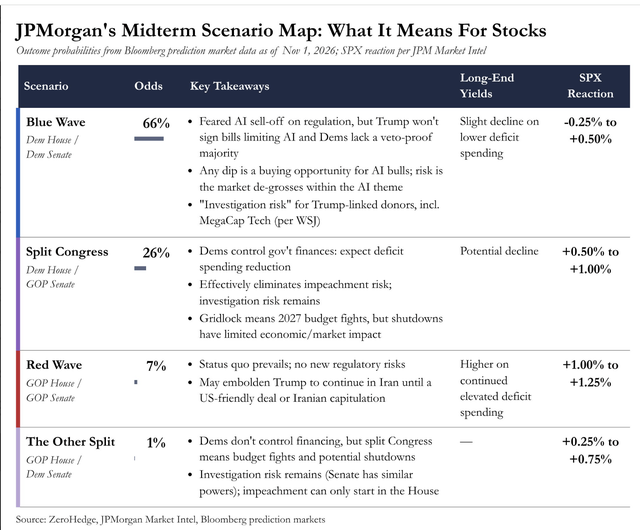
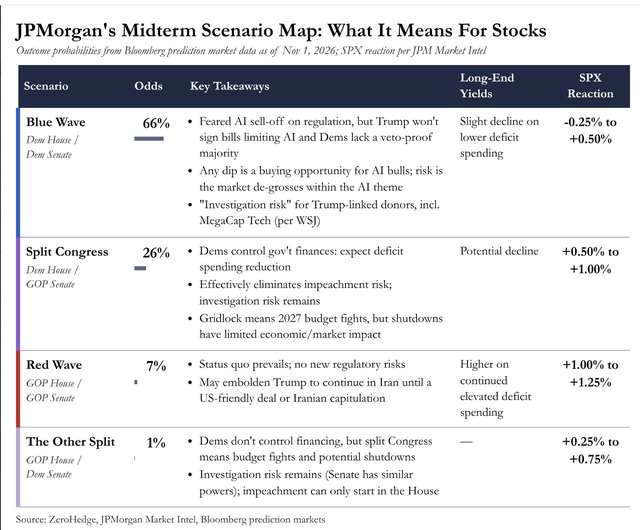
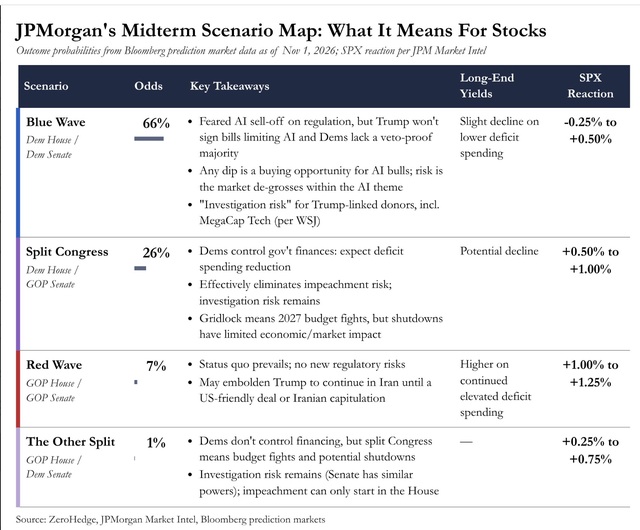
JPMorgan's (JPM) Market Intel desk has mapped out each outcome in a very useful chart, shown below.
Birinyi Associates tracked data from 1962 to 2006 and found that the S&P 500 averaged a 13.9% return when a Republican president faced a Democratic House and Senate.
#CryptoTrading #Nasdaq100 #Stocks #STONKS #SPX #trading #TradFi #BTC #Ethereum
#BTC
Bitcoin rejected from the 3-Day Lower High resistance (black)
Bitcoin has since dropped into the orange region for a retest attempt which it has since failed
In fact, Bitcoin is showcasing of turning this orange region back into resistance
Price would need to continue resisting from here and lost ~$75.5k support to confirm entry into additional downside continuation
$BTC #Bitcoin