@MithunSarkari Carrying the pre-IndAS line is what makes this readable. It grew 65% against reported EBITDA at 46.6% on the same revenue, so the underlying margin widened ~270bps against ~210bps reported. Lease accounting lifts the level and understates the gain.
@Salman_2911 H1 collections at 17% against 29% revenue is the one to sit with. Revenue running that far ahead means part of FY27 was collected last year. It supports this year’s 30% and, unless H2 lands, leaves FY28 opening from a thinner book.
@REDBOXINDIA Revenue added Rs 120 Cr. Operating costs added Rs 306 Cr. That’s the entire margin move. And profit fell 27% against EBITDA down 27%, so nothing below the operating line cushioned or caused it.
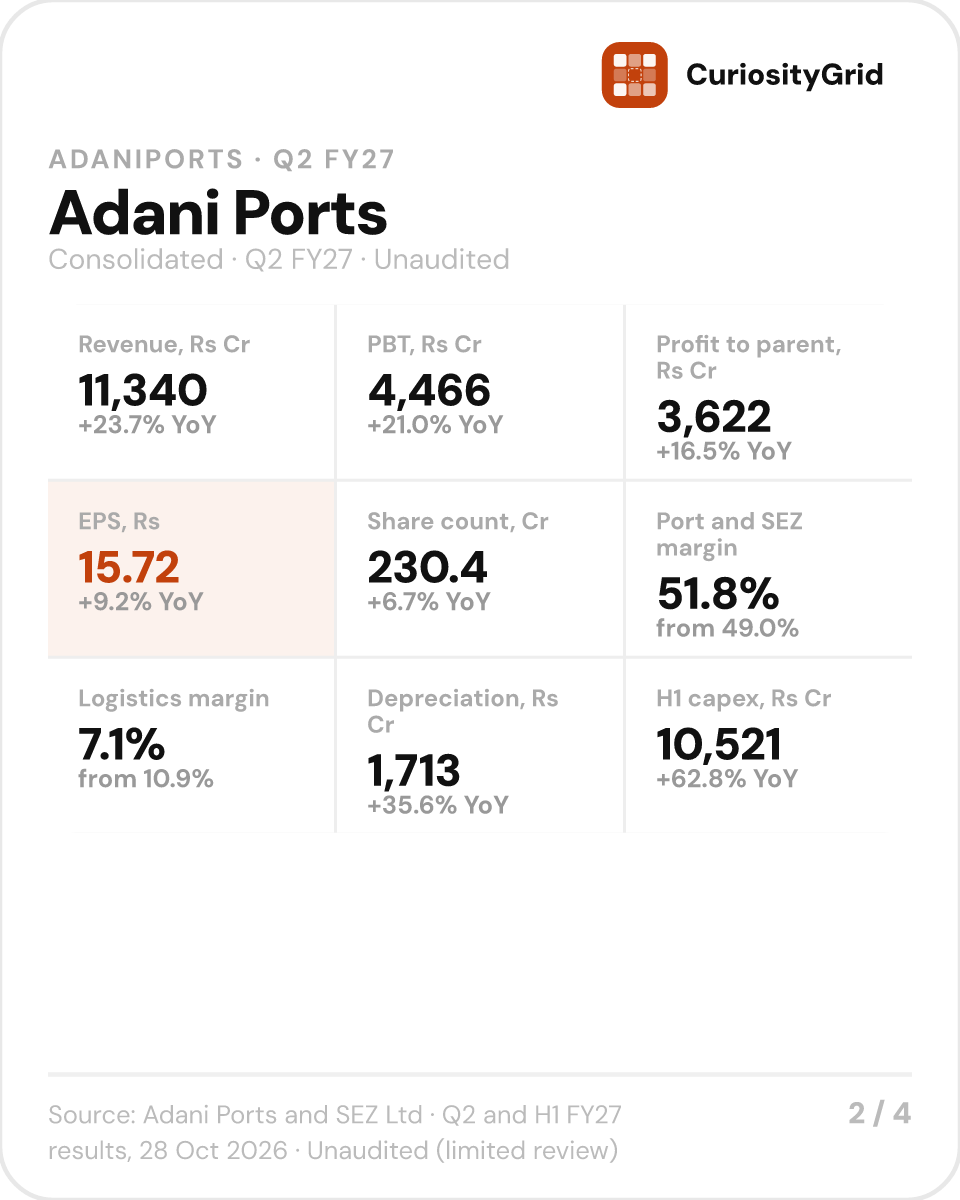
Adani Ports has 14.4 crore more shares than it did a year ago. That is why a 23.7% rise in revenue arrives as a 9.2% rise in earnings per share.
→ Revenue Rs 11,340 Cr, up 23.7%
→ EPS Rs 15.72, up 9.2%
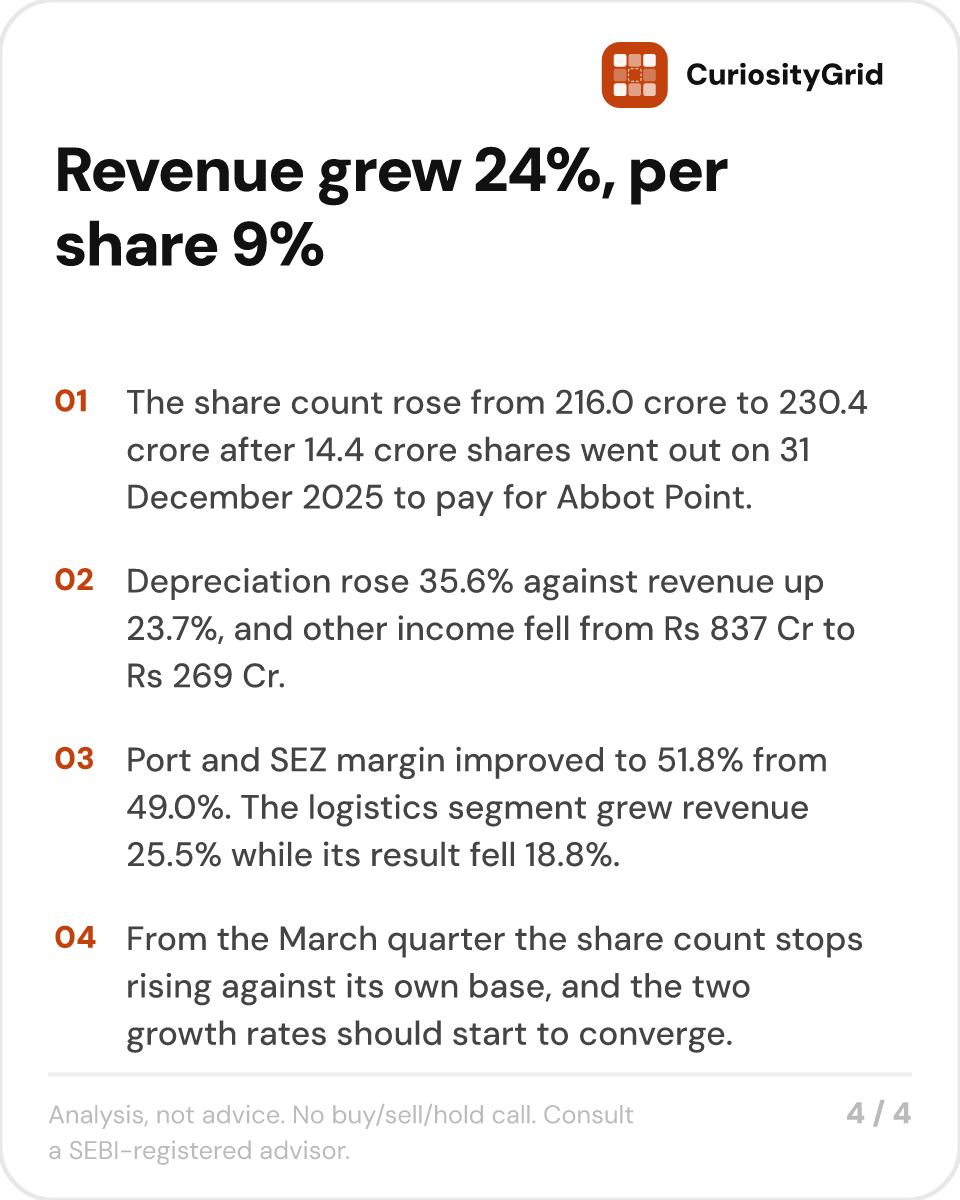
→ Depreciation up 35.6%
→ H1 capex Rs 10,521 Cr, up 62.8%
Profit attributable to shareholders came in at Rs 3,622 Cr, up 16.5%.
Depreciation accounts for much of the gap to revenue, rising 35.6% to Rs 1,713 Cr as acquired and newly built assets began carrying their charge.
Other income fell from Rs 837 Cr to Rs 269 Cr. A Rs 322 Cr swing on derivatives, from loss to gain, covered part of that.
The rest is the denominator. Adani Ports issued 14.4 crore shares on 31 December 2025 as consideration for Abbot Point Port Holdings. The count went from 216.0 crore to 230.4 crore. Those shares bought assets that now sit in the top line, and they sit underneath it as well.
The ports themselves got better. Port and SEZ revenue rose 22.9% and the segment margin went from 49.0% to 51.8%. Logistics went the other way, revenue up 25.5% and segment result down 18.8%.
Cash has the same shape. Operating cash for the half rose 40% to Rs 13,327 Cr. Capex rose 63% to Rs 10,521 Cr. That is 79 paise of every rupee of operating cash, against 68 paise a year earlier. What was left over fell.
A port spends before it earns, so a rising capex share is what building capacity looks like from the inside. Capacity paid for this year carries tonnage in later ones.
The shares went out on 31 December 2025. From the March quarter the count stops rising against its own base, and the two growth rates should start to converge.
#ADANIPORTS #result #FY27 Source: Adani Ports and SEZ Ltd, Q2 and H1 FY27 unaudited consolidated results (limited review), filed 28 October 2026.
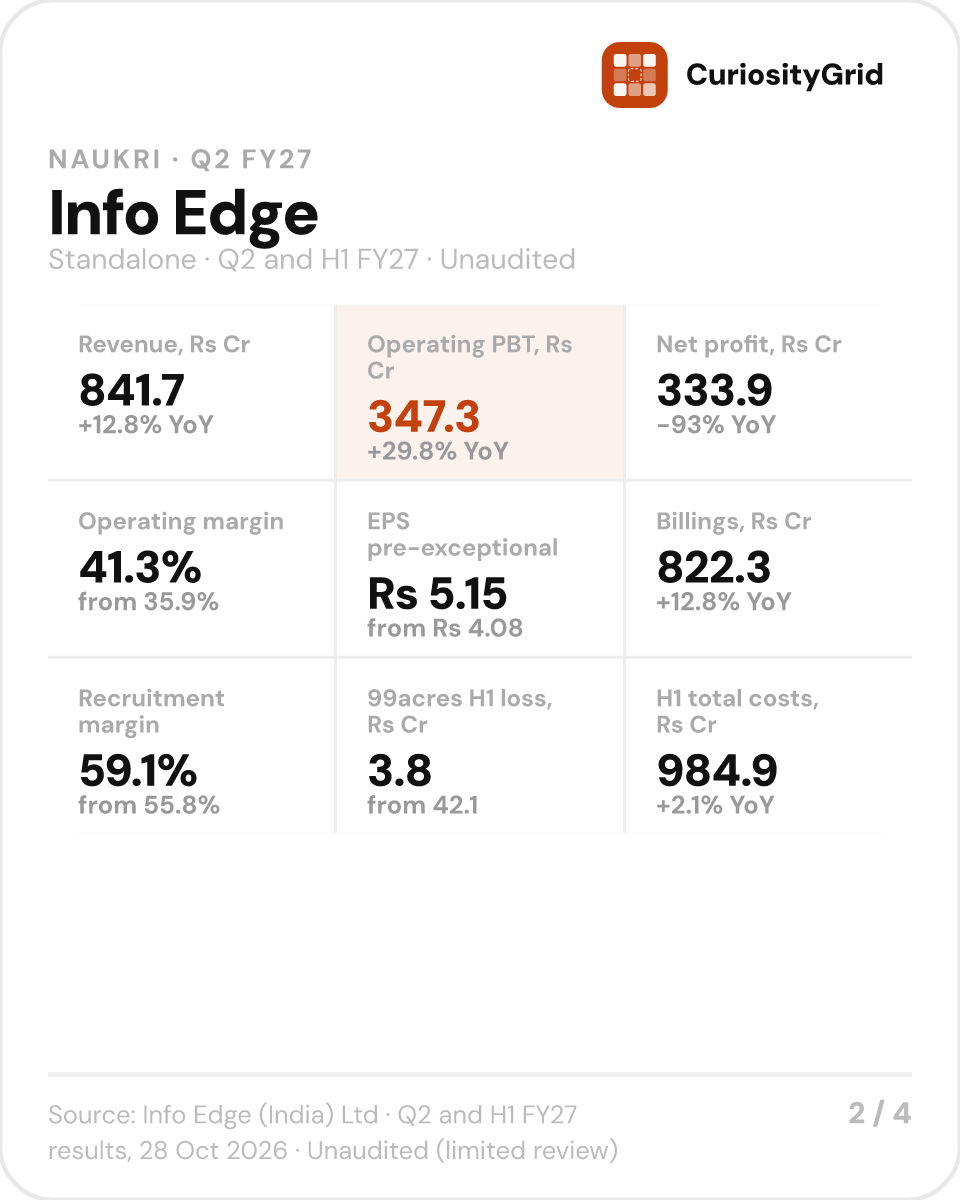
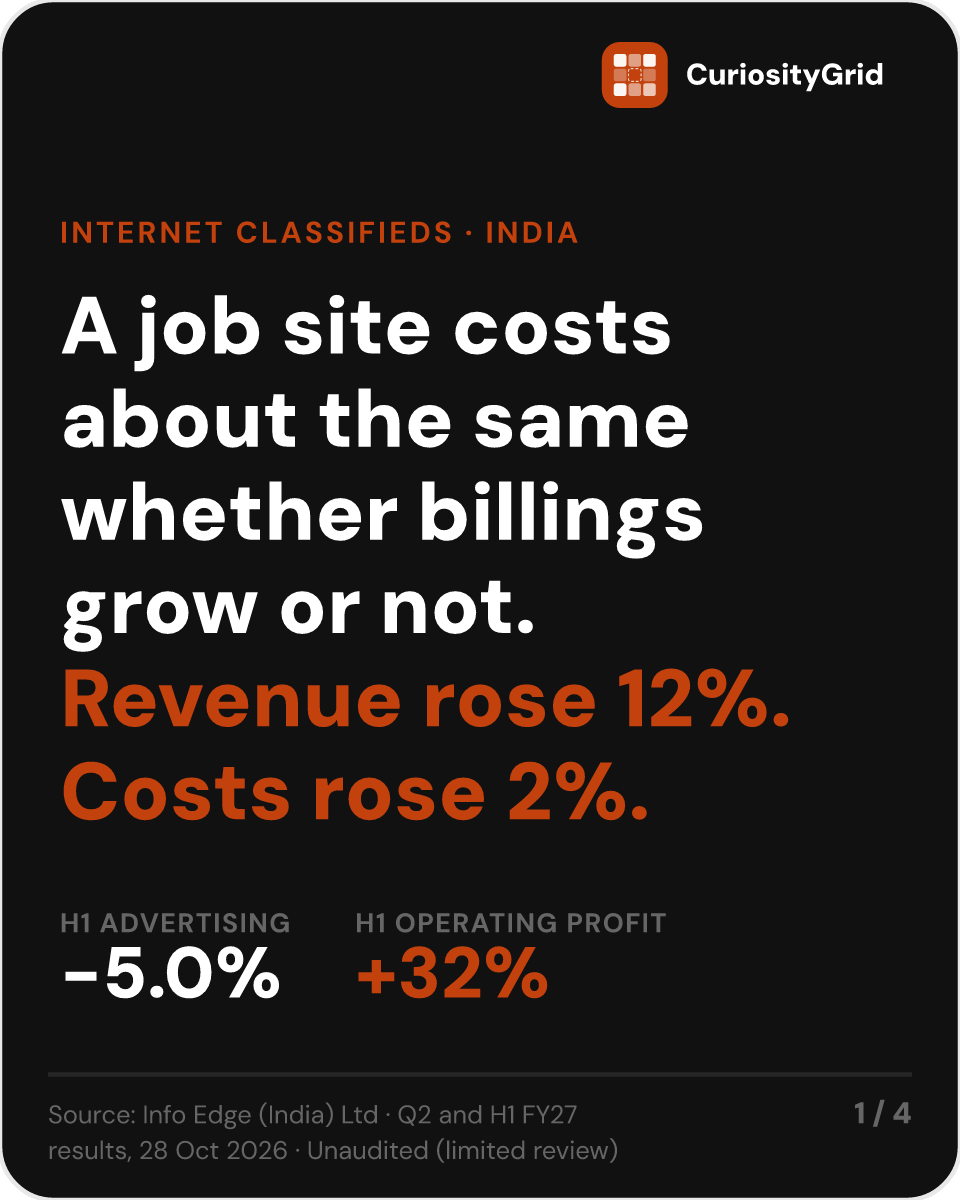
Info Edge grew half-year revenue by Rs 183.7 Cr and spent Rs 20.2 Cr more to do it. The reported profit line says something else entirely: down 93%.
→ Q2 revenue Rs 841.7 Cr, up 12.8%
→ H1 costs up 2.1% against revenue up 12.4%
→ 99acres half-year loss Rs 3.8 Cr, from Rs 42.1 Cr
→ Recruitment billings up 12.6% in Q2, 14.9% in H1
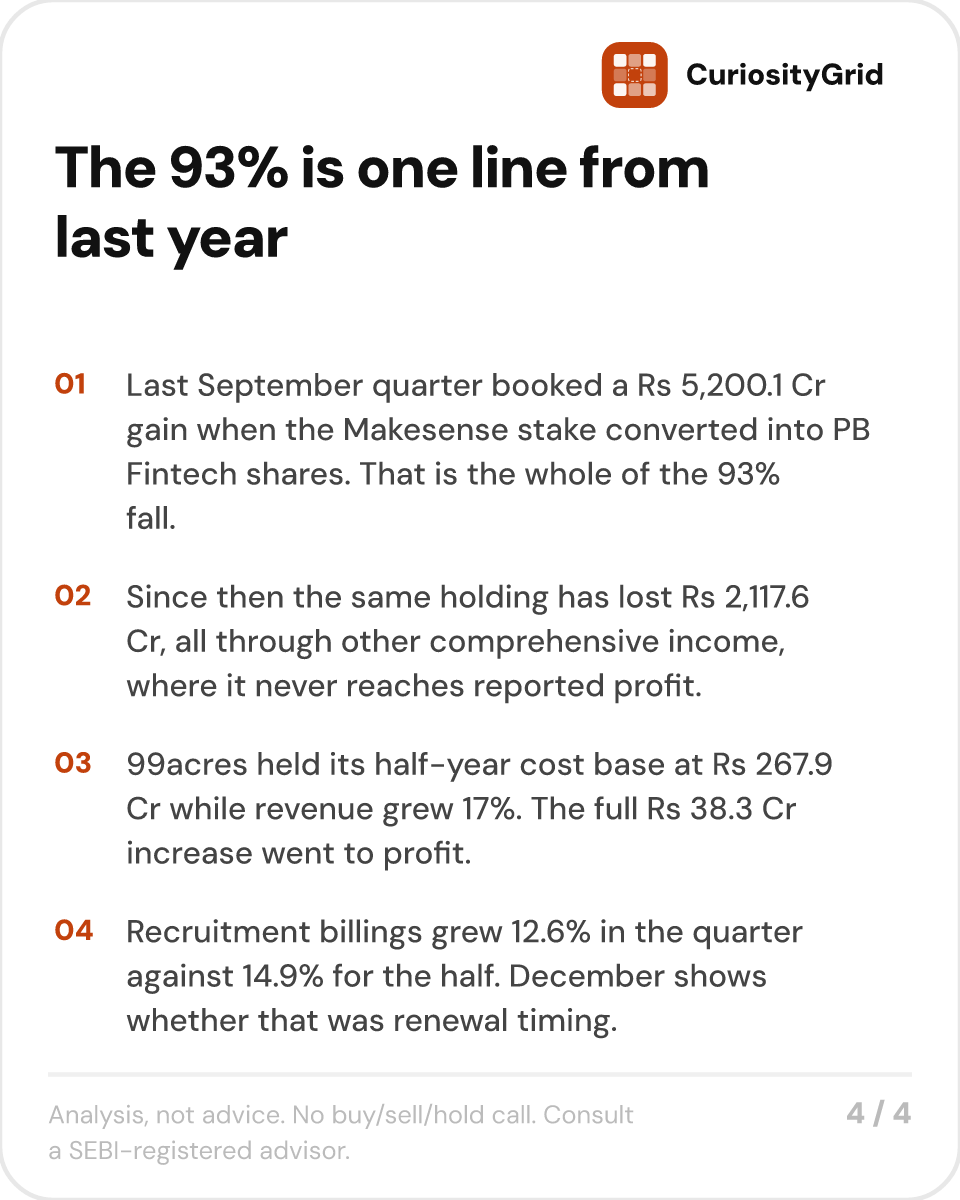
The 93% is one line. Last year's September quarter booked a Rs 5,200.1 Cr gain when the Makesense joint venture was approved for merger into PB Fintech and the shares received were fair valued.
No cash moved. Earnings per share before exceptional items ran Rs 5.15 this quarter against Rs 4.08. Since that approval the same holding has lost Rs 2,117.6 Cr, all of it through other comprehensive income, where it never reaches reported profit.
Half-year revenue rose 12.4% to Rs 1,666.1 Cr. Total costs rose 2.1%, to Rs 984.9 Cr. Advertising and promotion fell 5.0% outright. Operating profit rose 32% to Rs 681.2 Cr. The margin went from 34.9% to 40.9%.
99acres is the sharpest version. Its half-year cost base came in at Rs 267.9 Cr, the same as a year earlier, while revenue grew 17% to Rs 264.1 Cr. The platform was already built, so the extra billings arrived without extra spend. The whole Rs 38.3 Cr of new revenue became profit and the loss fell from Rs 42.1 Cr to Rs 3.8 Cr. Billings there accelerated to 21.2% from 16.5% in the June quarter.
Recruitment ran the same way at nearly five times the size, with a 59.1% quarterly margin against 55.8%.
Holding spend flat lifts margin, but it cannot lift revenue. Recruitment billings grew 12.6% in the quarter against 14.9% across the half, so June was the faster one. Management puts that down to the timing of customer renewals.
The stakes move the net worth, the job site moves the profit. Rs 4,889.6 Cr of unrealised gains on the Eternal and PB Fintech holdings ran through other comprehensive income this quarter, about fifteen times reported profit. Equity went from Rs 34,747.3 Cr to Rs 43,482.2 Cr in six months on Rs 579.4 Cr of profit.
Renewal timing would reverse in the December quarter. A real slowdown would not. Whether recruitment billings return above 14% settles whether this is discipline or under-investment.
Analysis, not advice. No buy/sell/hold call. Consult a SEBI-registered advisor.
#NAUKRI #result #FY27 Source: Info Edge (India) Ltd, Q2 and H1 FY27 unaudited standalone results (limited review) and earnings release, 28 October 2026.
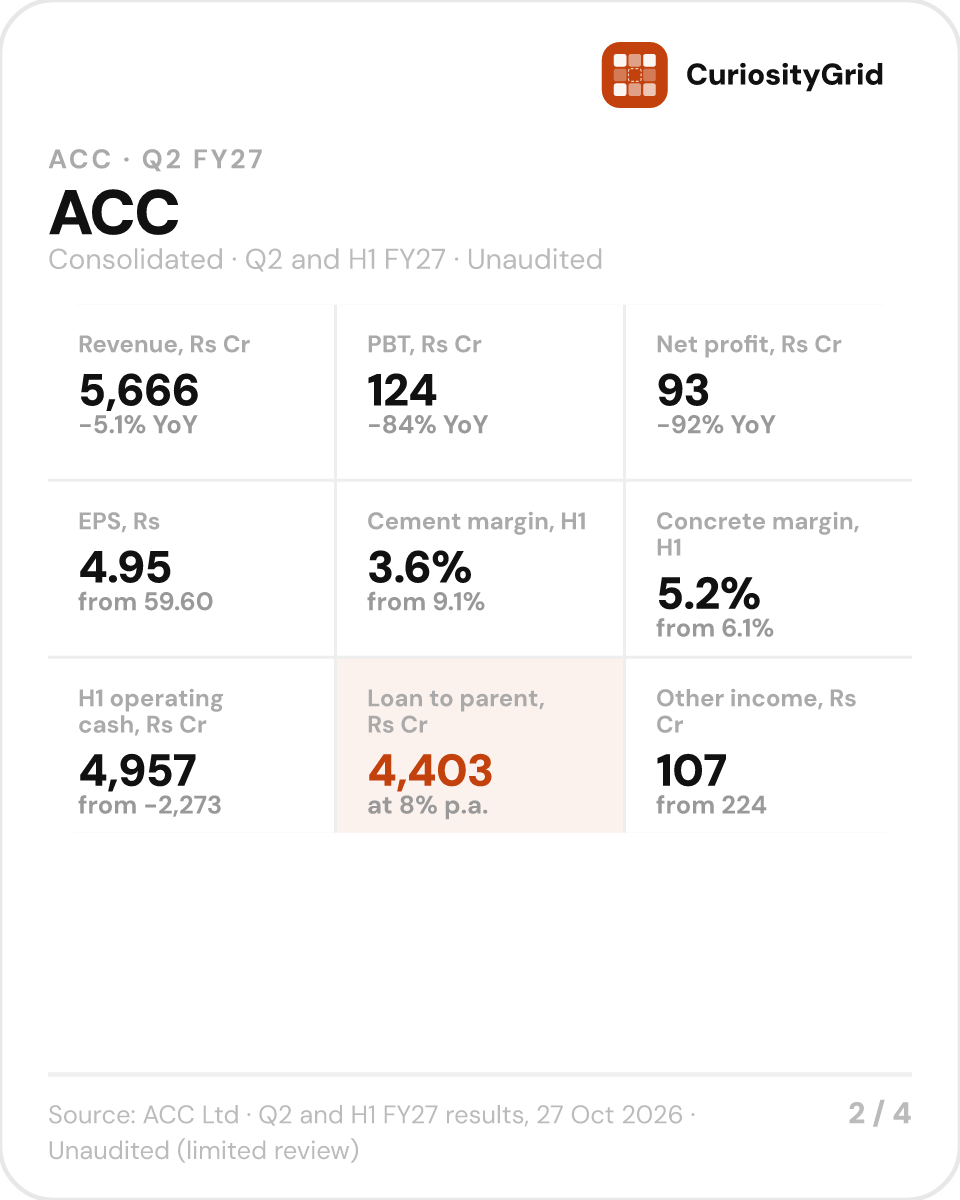
ACC earned Rs 93 Cr this quarter against Rs 1,119 Cr a year ago. Most of that gap belongs to last year's number, not this one.
→ Revenue Rs 5,666 Cr, down 5.1%
→ Cement margin 9.1% to 3.6% across the half
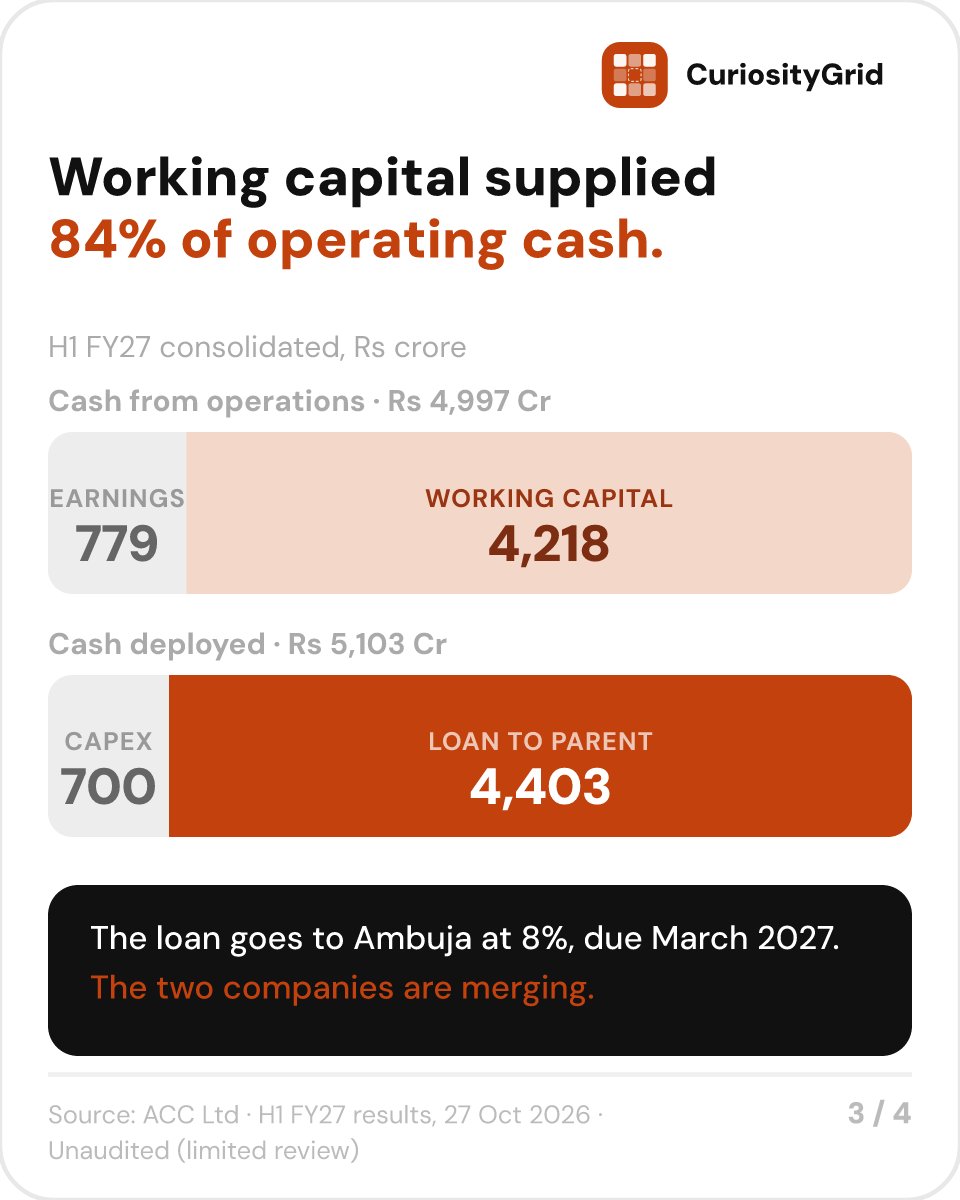
→ H1 operating cash Rs 4,957 Cr, Rs 779 Cr of it from earnings
→ Rs 4,403 Cr lent to parent Ambuja at 8%
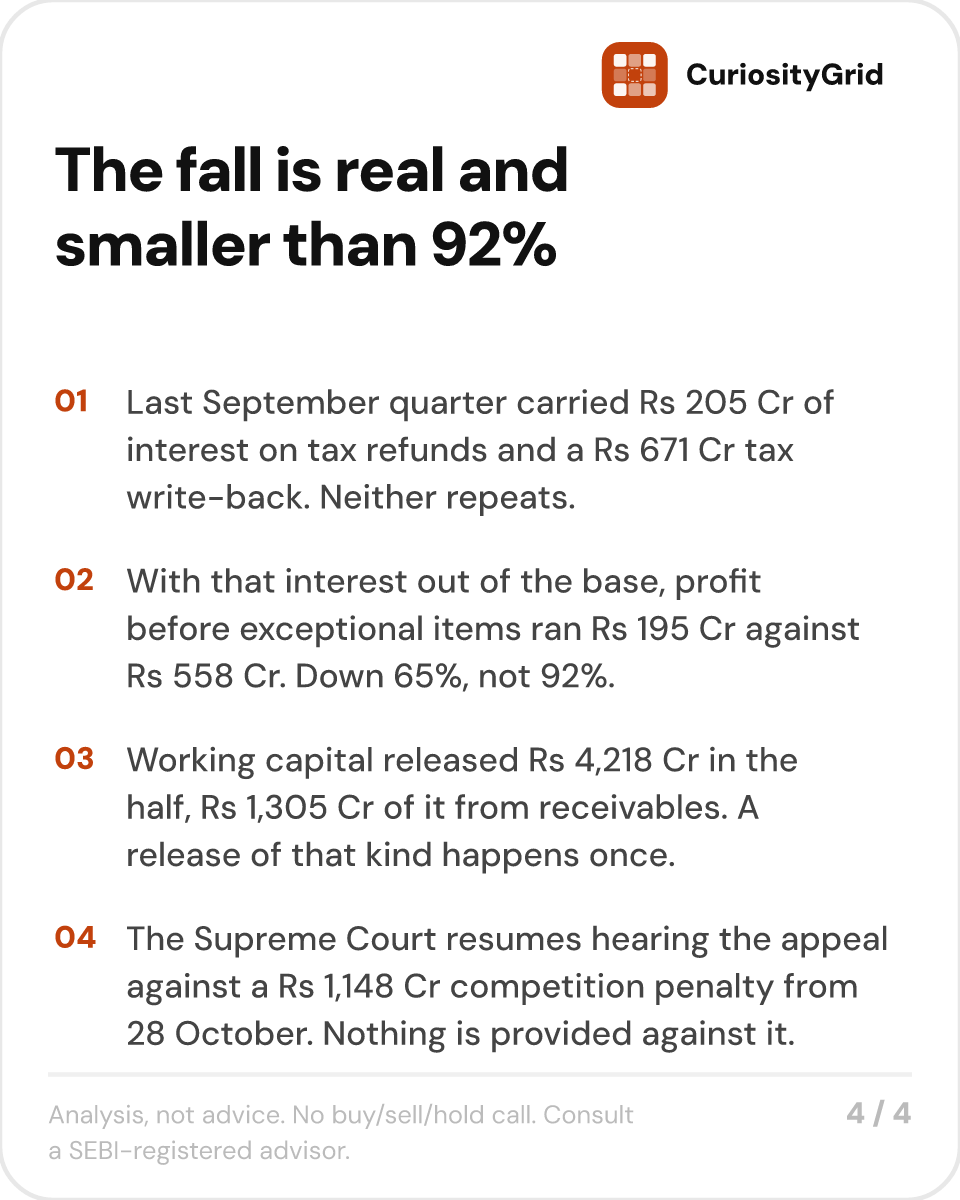
The September quarter last year carried two things that are gone. Other income held Rs 205 Cr of interest on tax refunds.
The tax line carried a Rs 671 Cr write-back relating to earlier periods. With that interest out of the base, profit before exceptional items runs Rs 195 Cr against Rs 558 Cr. The fall is 65%, not 92%.
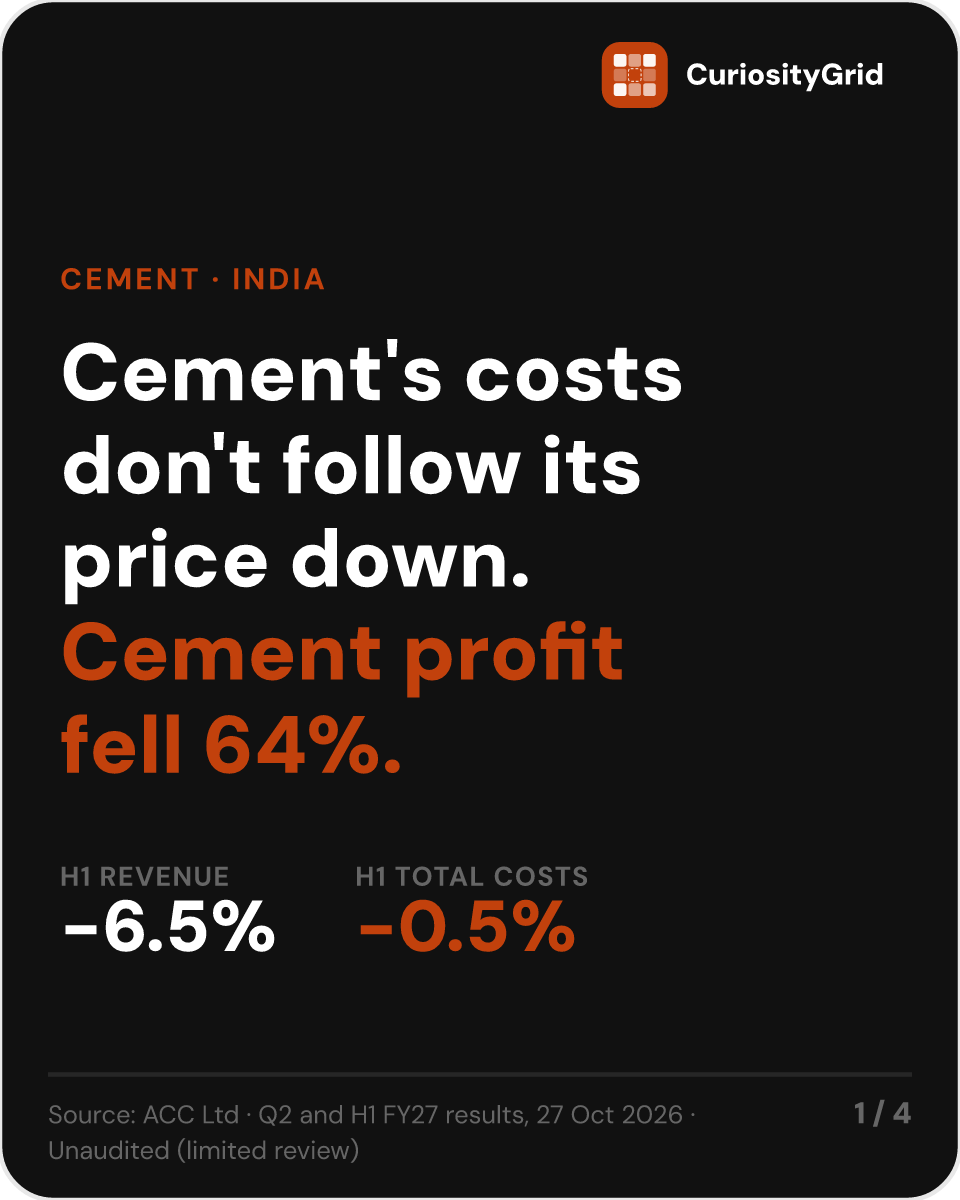
Costs are the problem underneath. Half-year revenue fell 6.5% while total expenses fell 0.5%. Power, fuel and freight took Rs 3,743 Cr of Rs 11,456 Cr of sales, and those track how much cement moves rather than what it fetches. Cement segment profit went from Rs 1,052 Cr to Rs 376 Cr. Rs 95 Cr of severance ran through the half with production at some plants suspended.
Ready-mix concrete now out-earns cement per rupee of sales, 5.2% against 3.6%. That's cement falling, not concrete improving: its own margin slipped from 6.1%.
Operating cash for the half came in at Rs 4,957 Cr against negative Rs 2,273 Cr, a swing of Rs 7,230 Cr. Operating profit before working capital changes halved, Rs 1,639 Cr to Rs 779 Cr. The rest is working capital coming back, Rs 4,218 Cr of it, with Rs 1,305 Cr from receivables.
Almost all of it went straight out again. Rs 4,403 Cr went to Ambuja Cements as inter-corporate deposits at 8%, due by March 2027. Capital spending took Rs 700 Cr.
This isn't cash leaving the group. Shareholders cleared it in April, it carries a rate, and the NCLT hears the scheme merging ACC into Ambuja on 19 November. A Rs 4,957 Cr cash figure read as recovery is still a one-time release read as a trend.
Receivables were carrying too much to begin with. Last year's first half absorbed Rs 2,518 Cr into working capital, so part of this release is that unwinding on a smaller base. It happens once either way.
The Supreme Court resumes hearing the appeal against a Rs 1,148 Cr competition penalty on 28 October. Interest of 12% a year would run from 2016 if it fails, and nothing is provided against it. Whether cement realisations hold into December decides the rest, because the cost base won't come down to meet them.
#ACC #result #FY27
@vsvicky_ ₹1.4 lakh Cr of revenue landing in one go is the real scale shift here. Tata’s own deal deck puts that perimeter at €891M adjusted EBIT on €14.1bn, a 6.3% margin. So the top line roughly doubles while the blended margin steps down. Closing that gap is the JLR-style job.
@Sahilpahwa09 Midcap funds took in ₹7,835 Cr in September alone, per AMFI. That money arrives on a date, not at a level, so there’s a standing bid sitting under the whole index. Doesn’t tell you whether this triangle holds, but it’s part of why midcap supports keep getting defended.
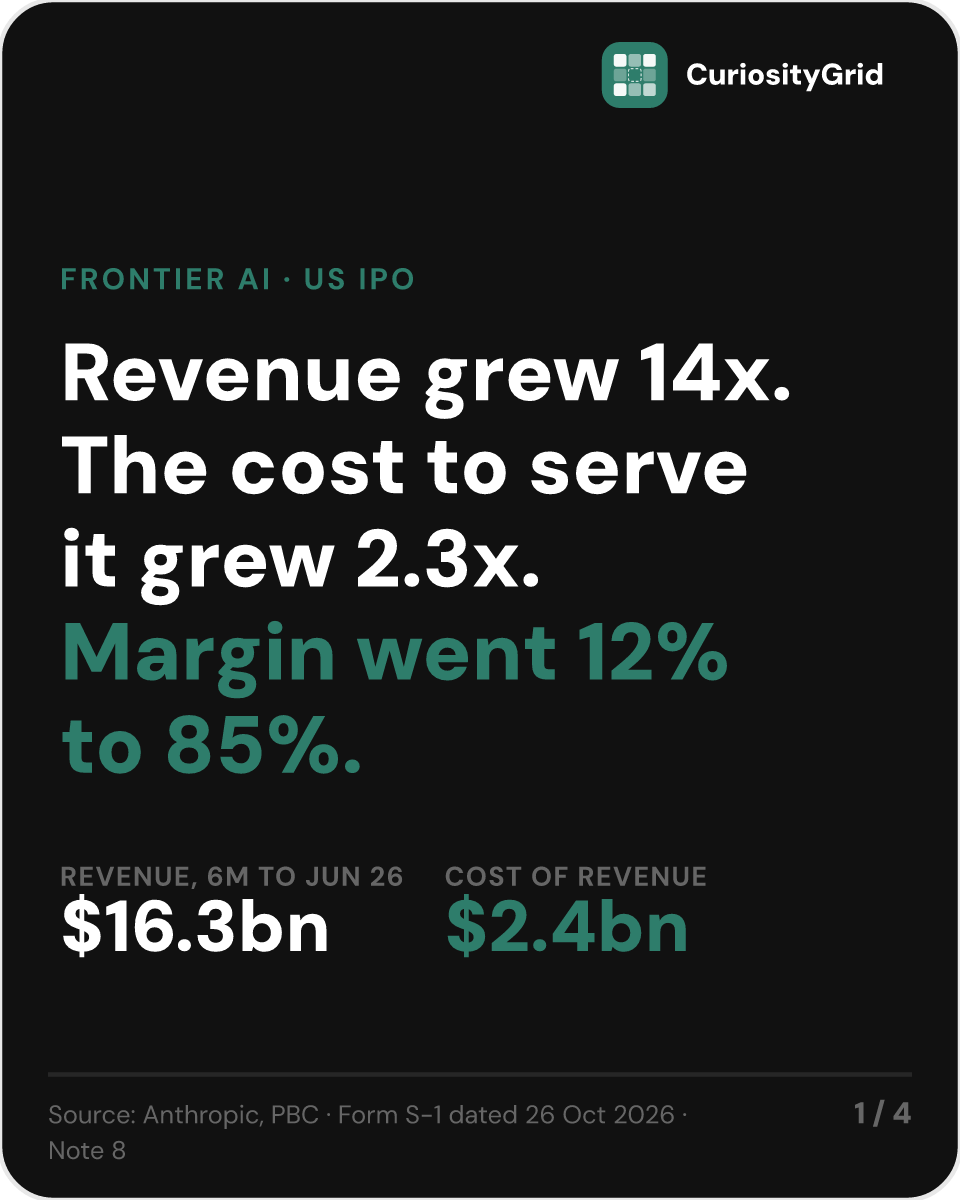
#Anthropic served a dollar of revenue for 88 cents in the first half of 2025. A year later it cost 15 cents.
Revenue for the six months to June 2026 reached $16.3bn against $1.2bn in the same half of 2025. Cost of revenue moved from $1.0bn to $2.4bn. Fourteen times the revenue on 2.3 times the cost to serve it. Gross margin went from 12.4% to 85.4%.
Models get cheaper to run as they improve. Opus 5.5 cut customer cost per task by about 40% against Opus 5, and cheaper tasks pull more usage. Most compute is contracted 12 to 18 months ahead under multi-year commitments, so a largely fixed cost base spreads across a revenue line growing far faster than it.
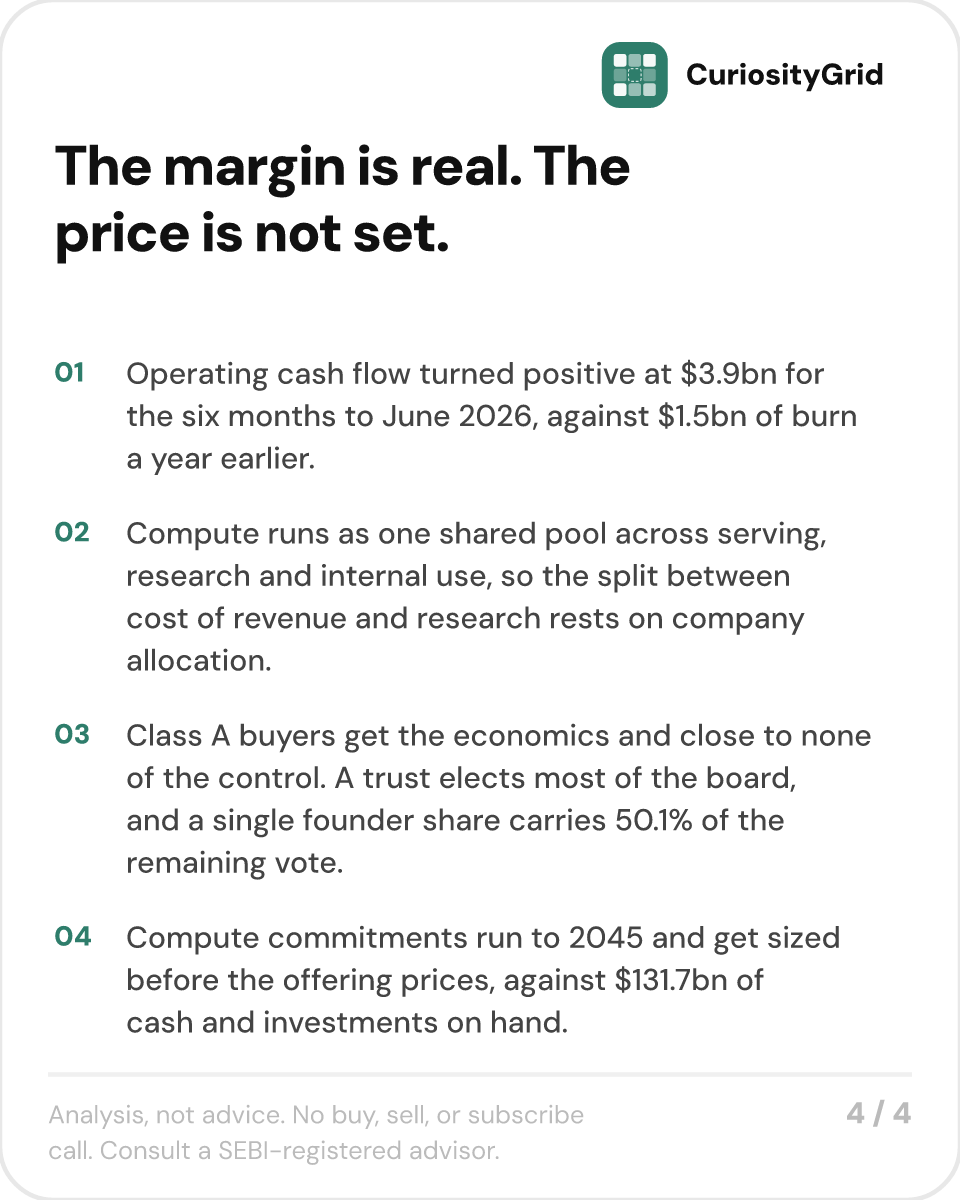
Net loss for the half was $80.7bn. Of that, $72.4bn is the rising fair value of convertible notes, which moves up as the company's own valuation moves up. Operating loss was $693m. Operating cash flow came in at positive $3.9bn against $1.5bn of burn a year earlier, ahead of adjusted operating income of $1.6bn and adjusted net income of $2.7bn.
Compute runs as one shared pool across customer serving, research and internal use, planned on a total basis rather than per workload. Where the line sits between cost of revenue and research is a company allocation. Free-tier serving is booked to sales and marketing, internal #Claude usage to research. So 85.4% is the margin on paying workloads with some serving cost sitting elsewhere. The same policy produced 12.4% twelve months earlier, which is why the direction holds even where the level is soft.
Research absorbed $9.7bn in the half, 60% of revenue, down from 159%. The top five customers are about 25% of revenue for the nine months to September, with no single customer above 10%. The US is 72% of revenue, up from 70.5%. Remaining performance obligations stand at $10.8bn, three quarters of it due inside twelve months.
Price band, share count and proceeds are unfilled. So is the compute commitment, which runs to 2045 and gets sized before the deal prices. Set against $131.7bn of cash and investments, that figure decides whether 85% margins fund the build or fall short of it.
Class A stock carries the economics and close to none of the control. A trust elects most of the board. A single founder share holds 50.1% of the vote on everything else.
Source: Anthropic, PBC Form S-1 dated 26 October 2026.
Analysis, not advice. No buy, sell, or subscribe call. Figures will change in the final prospectus. Consult a SEBI-registered advisor.
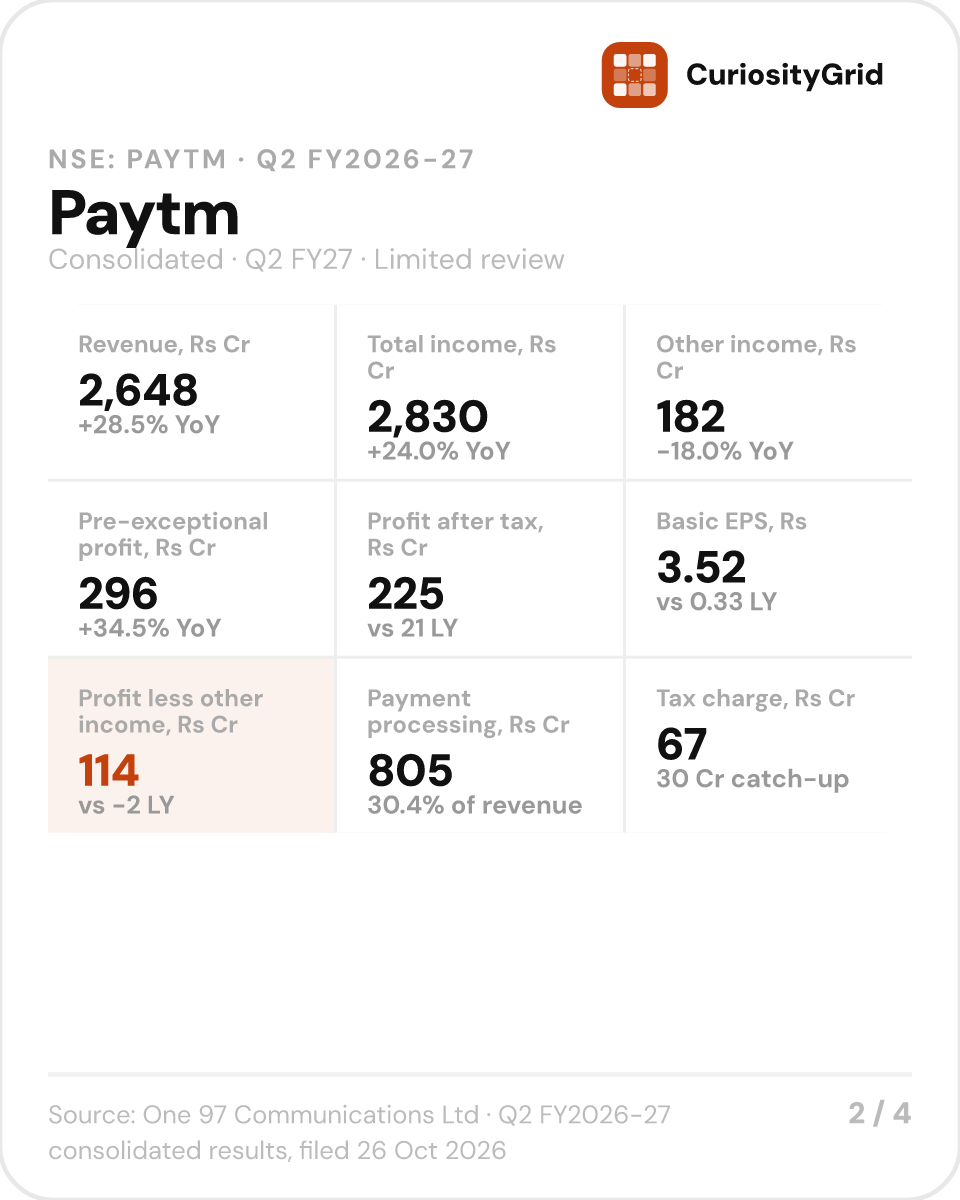
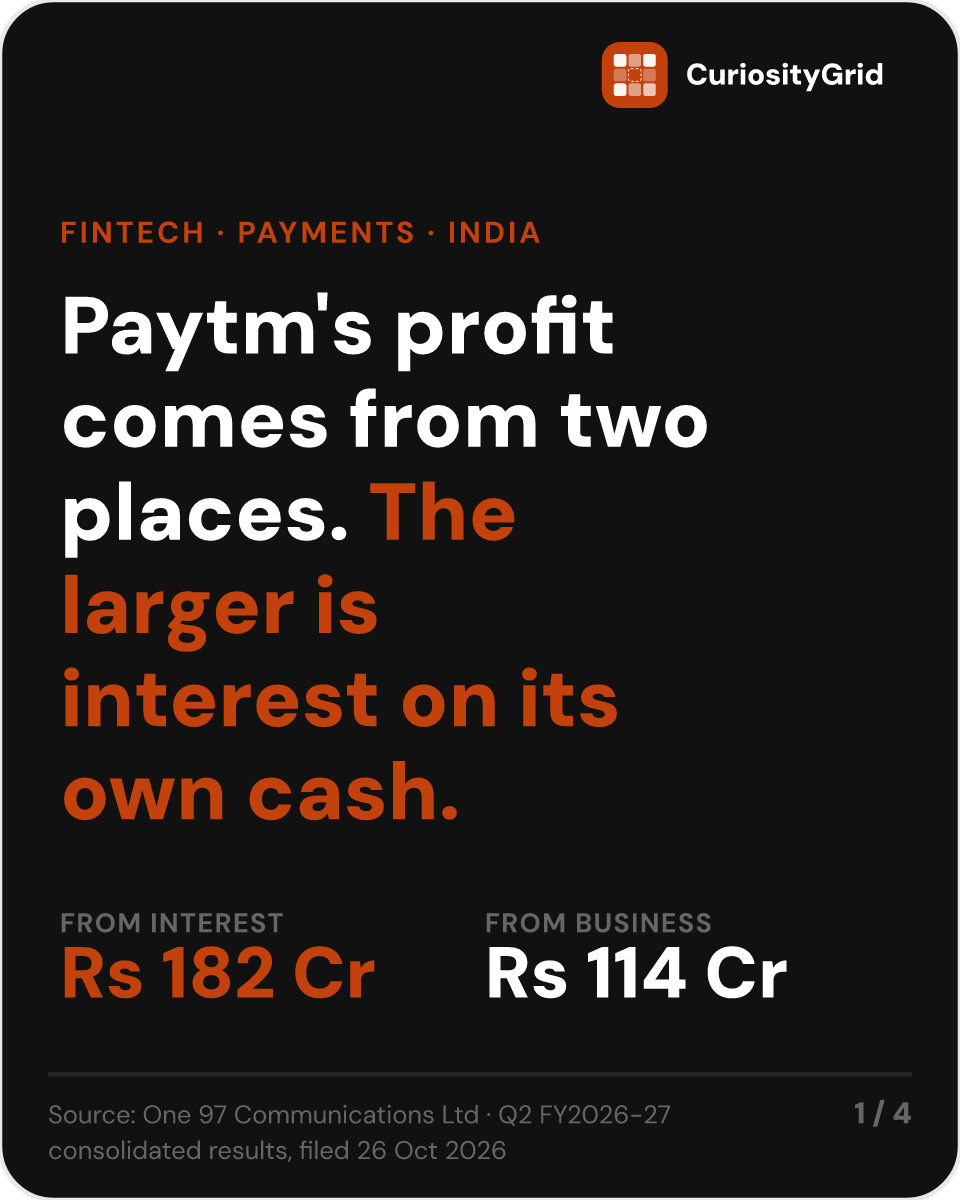
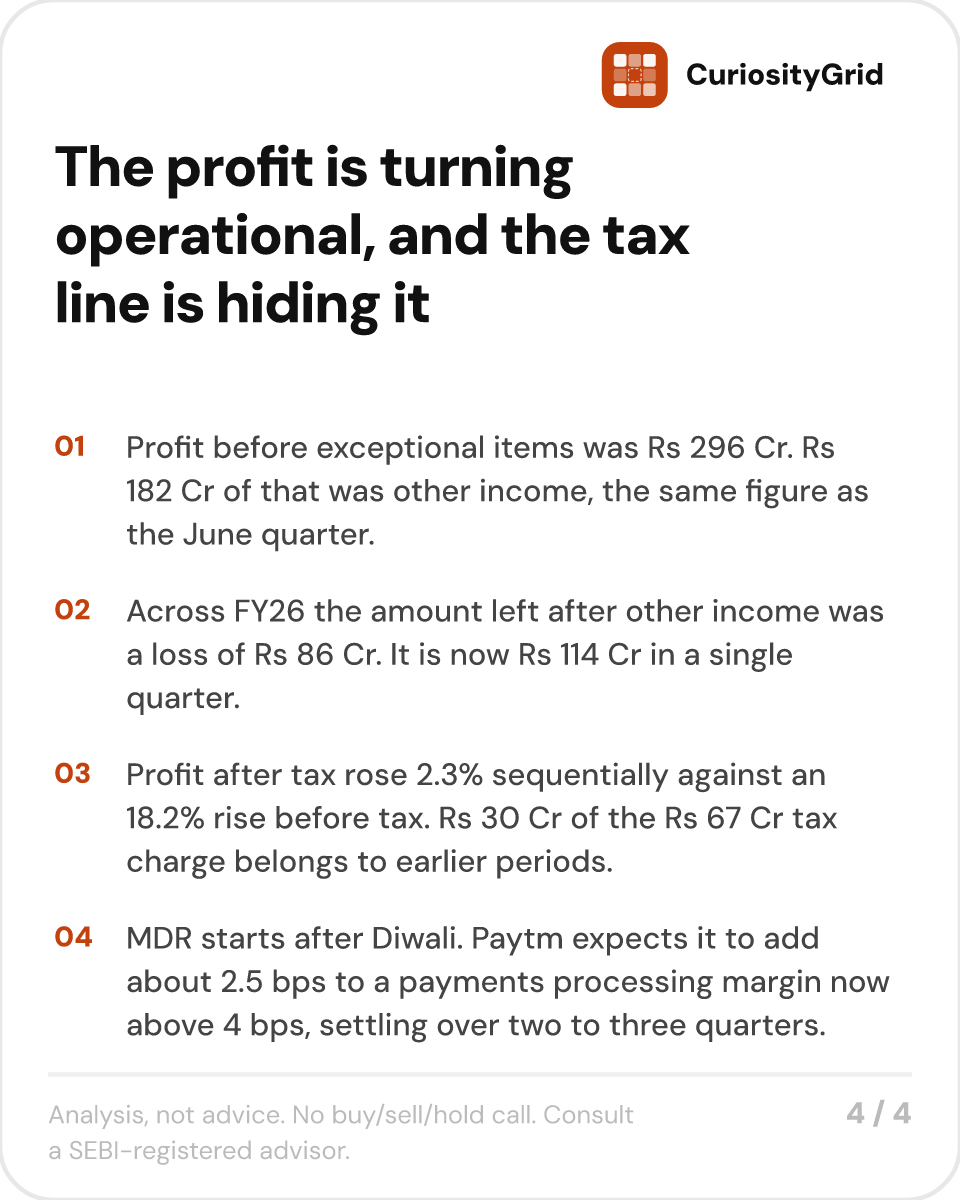
Paytm earned Rs 296 Cr before exceptional items this quarter. Rs 182 Cr of that was other income, mostly interest on its own cash.
→ Revenue Rs 2,648 Cr, up 28.5% from a year ago
→ Profit left after other income: Rs 114 Cr, against Rs 65 Cr in June
→ Profit after tax Rs 225 Cr, up 2.3% sequentially
A year ago that middle figure was minus Rs 2 Cr.
Across the whole of FY26 it was a loss of Rs 86 Cr, sitting underneath Rs 768 Cr of reported pre-exceptional profit.
The payments and lending business was running near breakeven and the cash pile was doing the earning. That money is real. It is not the operating business: in the first half, interest came to Rs 334 Cr and gains on investments to Rs 23 Cr, which covers almost all of the Rs 364 Cr booked as other income.
Other income was 74% of pre-exceptional profit in June and 61% now, on the identical Rs 182 Cr in both quarters.
Payment processing charges did most of that. They went from Rs 794 Cr to Rs 805 Cr while revenue added Rs 200 Cr, so nearly the whole increase dropped through. Employee cost is down to 28.7 paise of each revenue rupee from 32.2 paise a year ago. Pulling the other way, software, cloud and data centre spend went from Rs 159 Cr to Rs 211 Cr in three months.
Profit after tax rose 2.3% while profit before tax rose 18.2%. The gap is tax that belongs to earlier periods: Rs 23 Cr to last year, Rs 5 Cr to the June quarter, and Rs 2 Cr of current tax for earlier years. Rs 30 Cr of the Rs 67 Cr charge, or Rs 0.47 a share (my arithmetic). On current-period tax alone the rate works out at 12.7%, close to June's 10.9%.
The 10x year-on-year profit jump is the base, not the quarter. Last year's September quarter carried a Rs 190 Cr impairment on a loan to the gaming joint venture.
MDR arrives after Diwali. Paytm puts its payments processing margin above 4 bps today and expects the new regime to add roughly 2.5 bps, stabilising over two to three quarters. That lands on the operating side, not the treasury side.
The December quarter will carry the first MDR revenue and, barring another catch-up, a clean tax line. Rs 114 Cr is the number it has to beat.
$PAYTM #result #Q2FY27
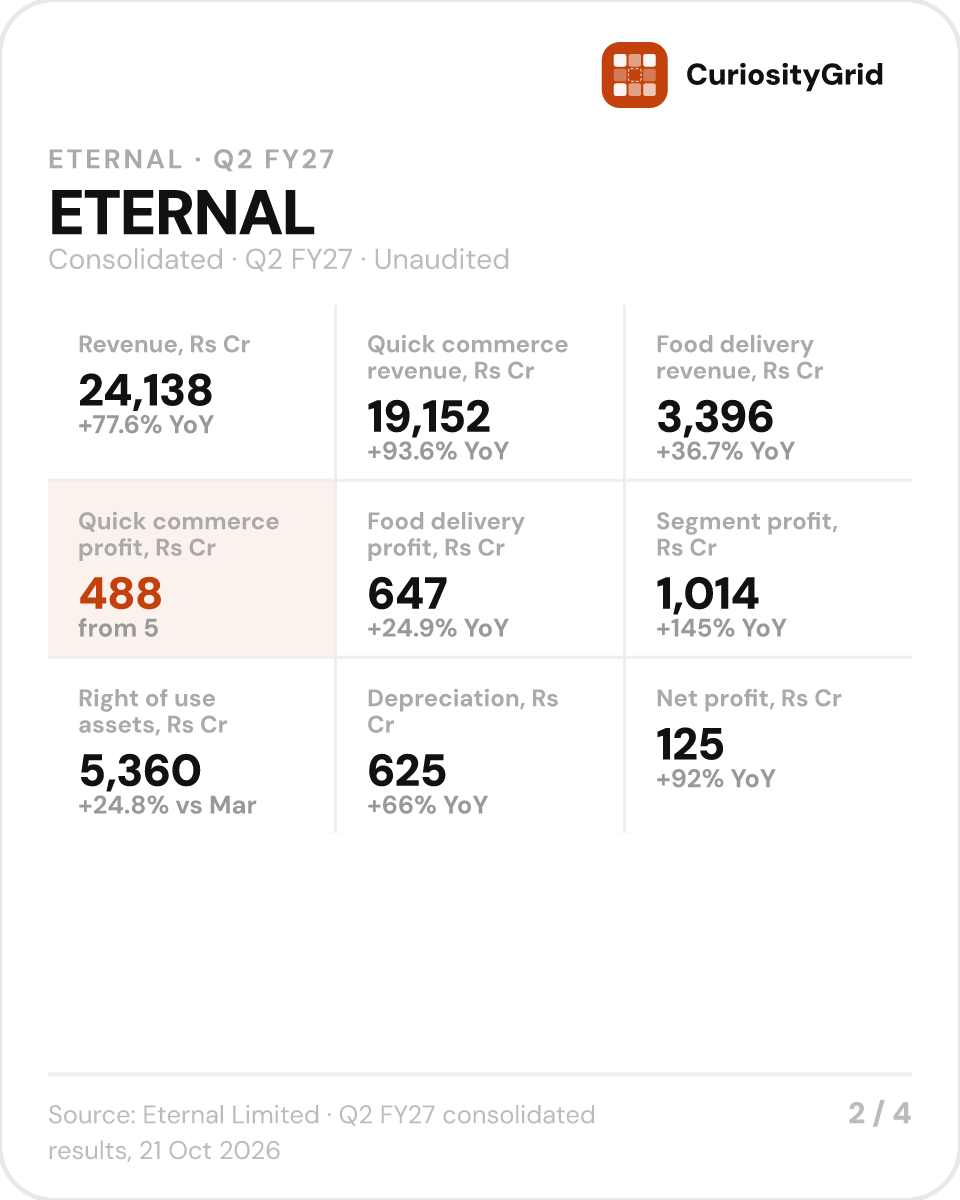
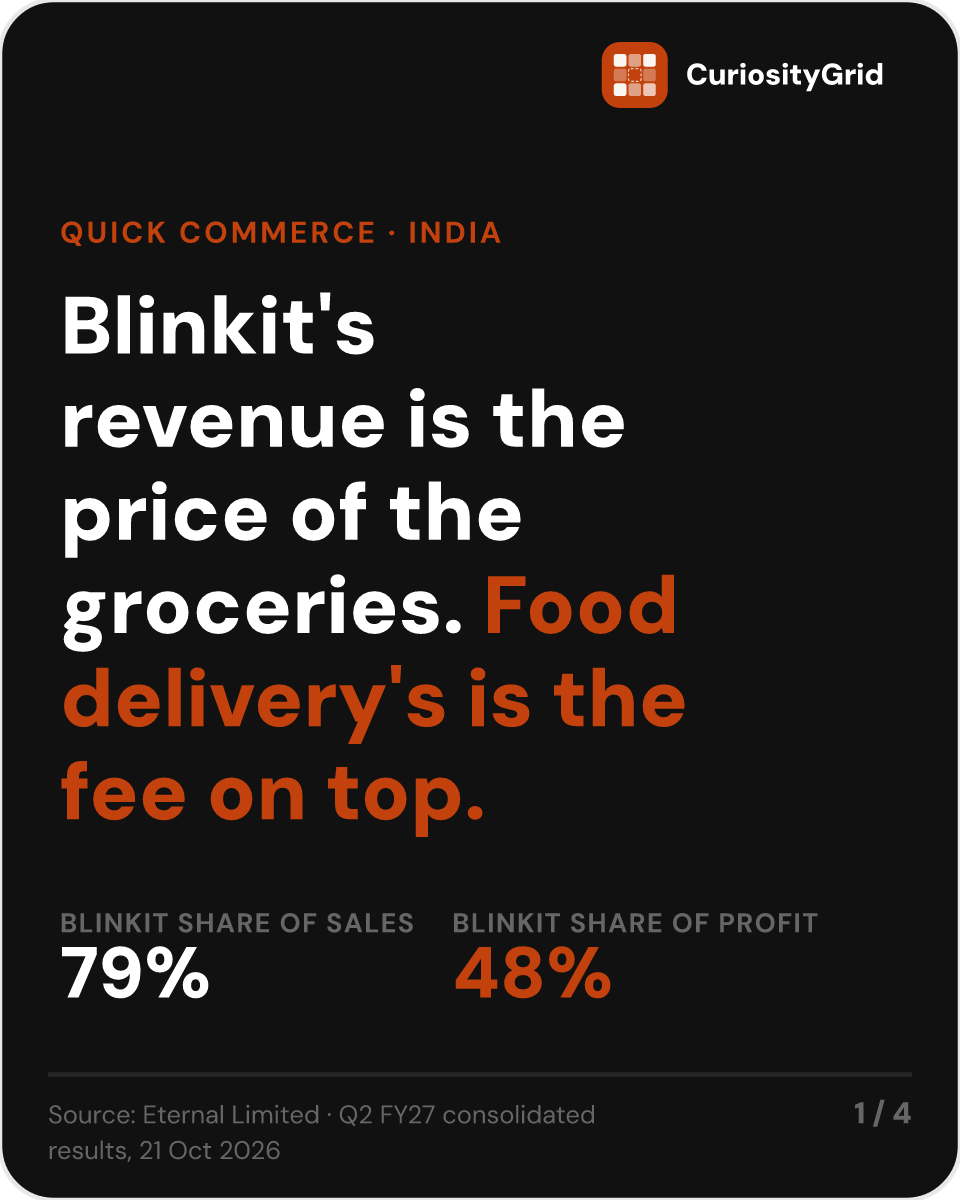
Quick commerce is 79% of what Eternal sold this quarter and 48% of what its segments earned. Food ordering and delivery is 14% of sales and 64% of segment profit.
→ Quick commerce revenue Rs 19,152 Cr, up 94%
→ Quick commerce segment profit Rs 488 Cr, from Rs 5 Cr
→ Food delivery profit Rs 647 Cr on Rs 3,396 Cr of revenue
→ Segment profit Rs 1,014 Cr, from Rs 413 Cr
That gap is not efficiency. Blinkit buys the groceries and sells them, so its revenue is the price of the goods. Food ordering and delivery never owns the food, so its revenue is the fee on top.
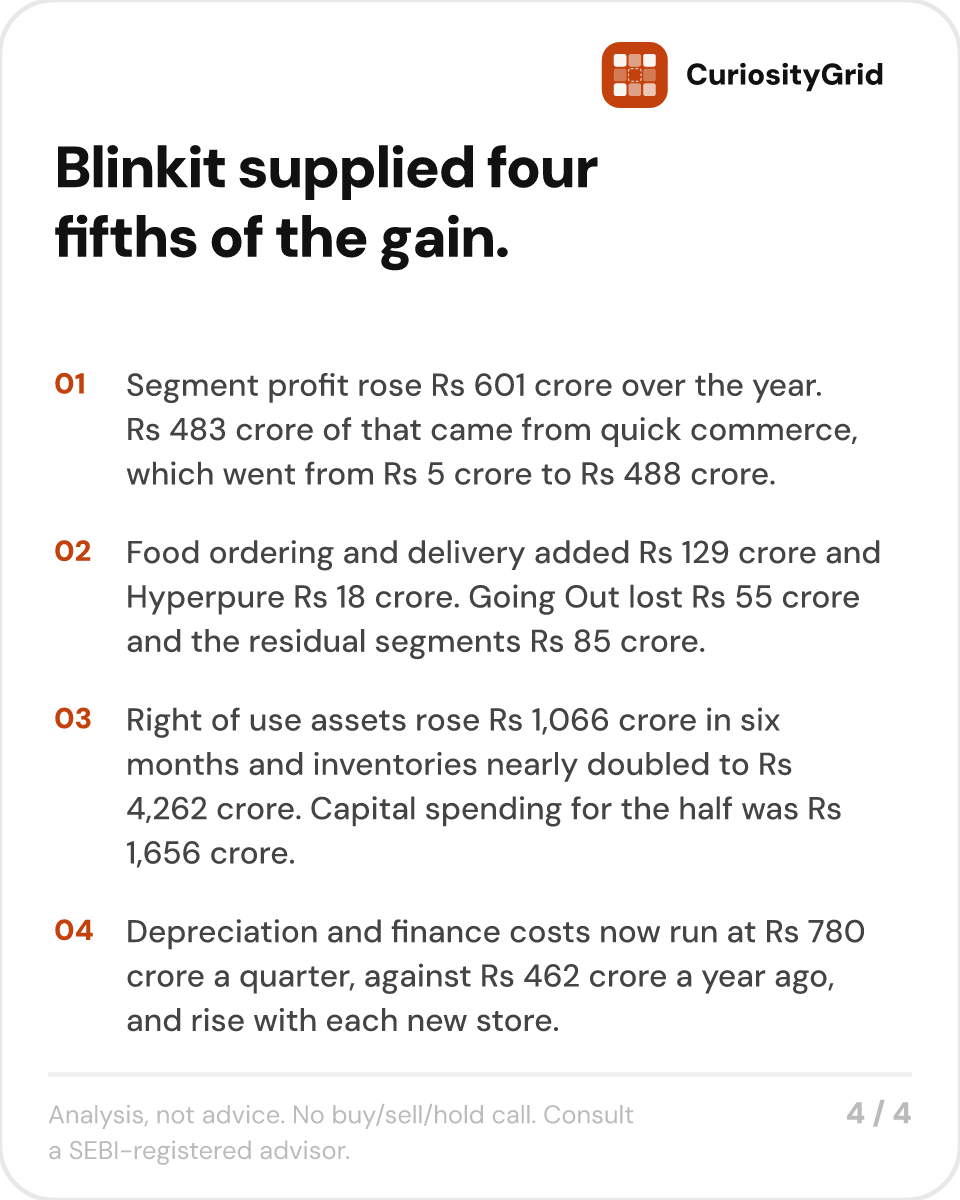
What the two can be compared on is movement, and there Blinkit carried the quarter. Segment profit rose Rs 601 crore over the year. Rs 483 crore of that came from quick commerce.
→ Food ordering and delivery added Rs 129 crore,
→ Hyperpure Rs 18 crore.
Two parts of the group still cost money.
Going Out (District) lost Rs 55 crore and the residual segments lost Rs 85 crore, together taking Rs 140 crore off the top.
#Blinkit rents its stores, so the money goes out as leases, equipment and stock. Profit comes later. Right-of-use assets rose Rs 1,066 crore in six months to Rs 5,360 crore, and own plant and equipment rose Rs 1,007 crore. Inventories nearly doubled to Rs 4,262 crore, which is what owning the goods costs in working capital. Capital spending for the half was Rs 1,656 crore against Rs 788 crore a year ago.
All of it lands as depreciation and lease interest. Those two are Rs 780 crore this quarter, up from Rs 462 crore. Add share options of Rs 262 crore and the costs below the segment line come to Rs 1,042 crore. So profit before tax of Rs 323 crore is other income of Rs 351 crore. Reported net profit was Rs 125 crore.
Blinkit's own margin is where the work is happening. Rs 488 crore on Rs 19,152 crore is 2.5%. The June quarter was 2.3%, and a year before that it was almost nothing. Every new store adds revenue at roughly that rate and adds depreciation from day one.
The segments earned Rs 1,014 crore. The costs below them came to Rs 1,042 crore. Every store added from here raises the second number.
$ETERNAL #result #FY27
Analysis, not advice. No buy/sell/hold call. Consult a SEBI-registered advisor.
Source: Eternal Limited, consolidated unaudited results (limited review), quarter and half year ended September 30, 2026, filed 21 October 2026. Segment shares, contribution splits and the Rs 1,042 crore total are our arithmetic from the reported numbers.
@Salman_2911 The one-less-headwind leg runs through the Indian basket more than Brent alone. The basket is weighted to Oman and Dubai sour, so the Dubai-Brent spread sits between a cool-off and the actual import bill, and the rupee leg sits after that.
@riteshmjn Self-generation gets pushed because the queue is the slow part. A US interconnection study and build runs years, and new gas turbine slots are booked out past that, so behind-the-meter is the only path that moves on a data centre timeline.
@cmagurvinder 55% against a 15% peer run rate is the gap worth pulling apart. Credit cost at 1.6% is a ratio on a growing book, so absolute provisions can rise while the percentage sits flat. Stage-2 movement and any writeback in that line is what shows whether quality held.
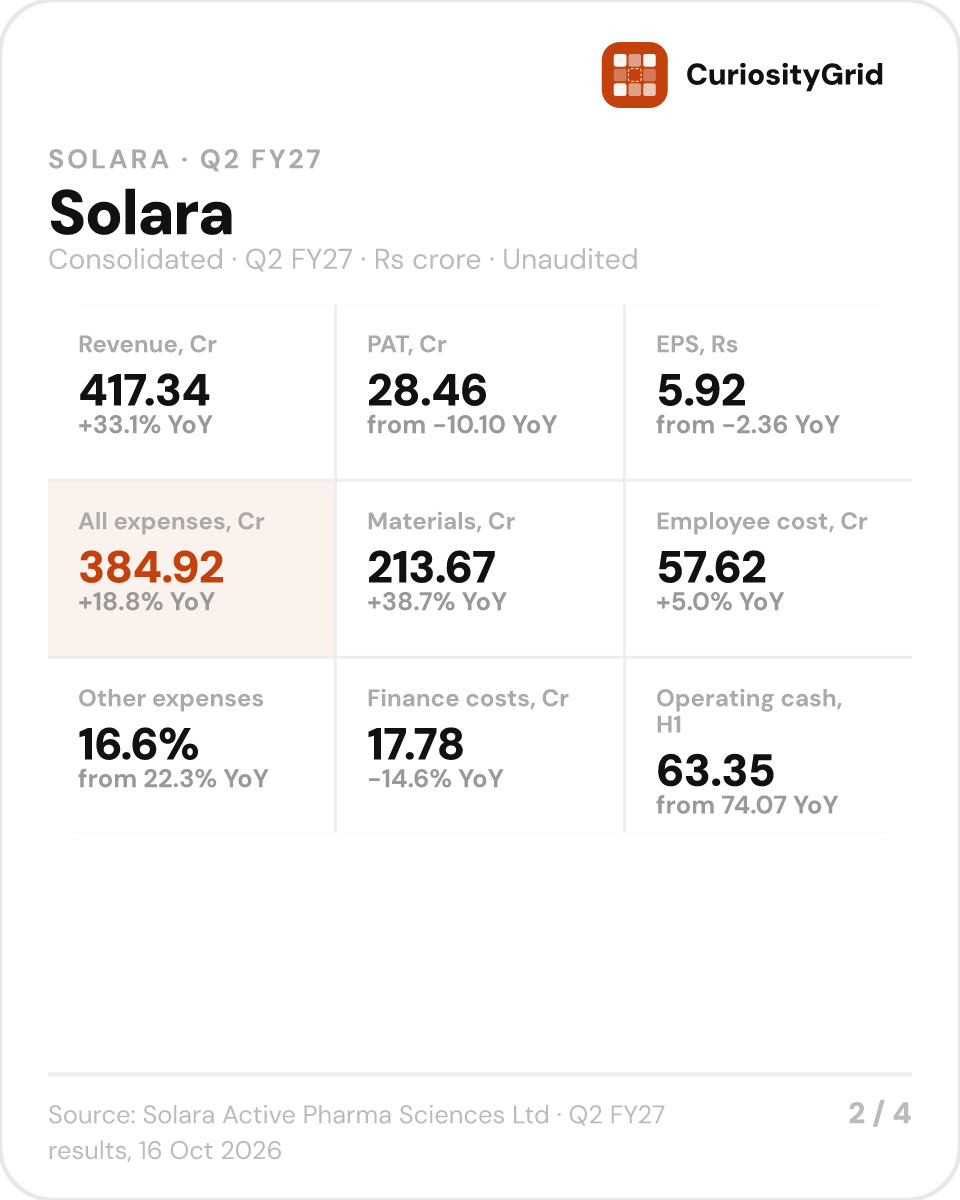
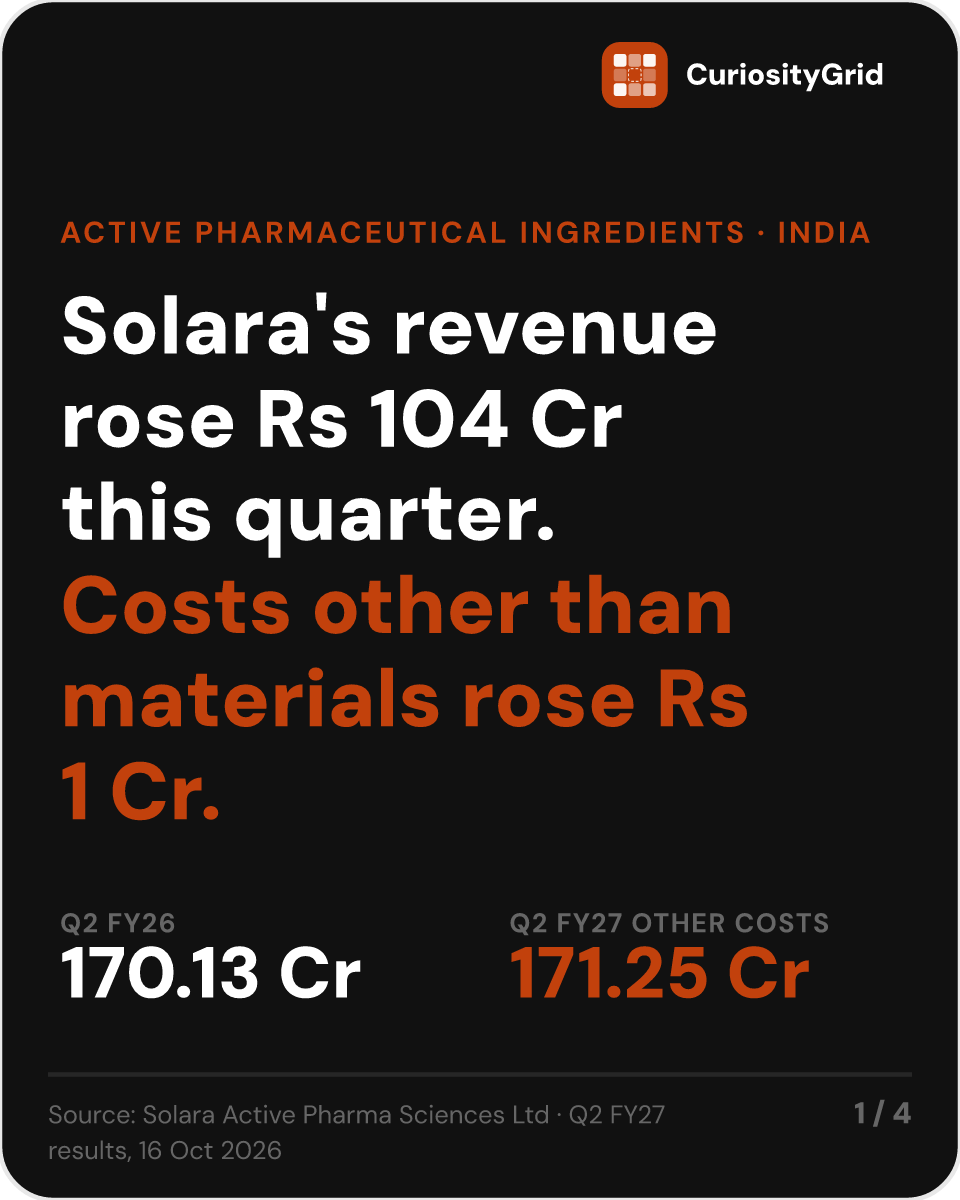
Solara swung from a ₹10 Cr loss a year ago to a ₹28 Cr profit this quarter. Materials are the only cost line that moved.
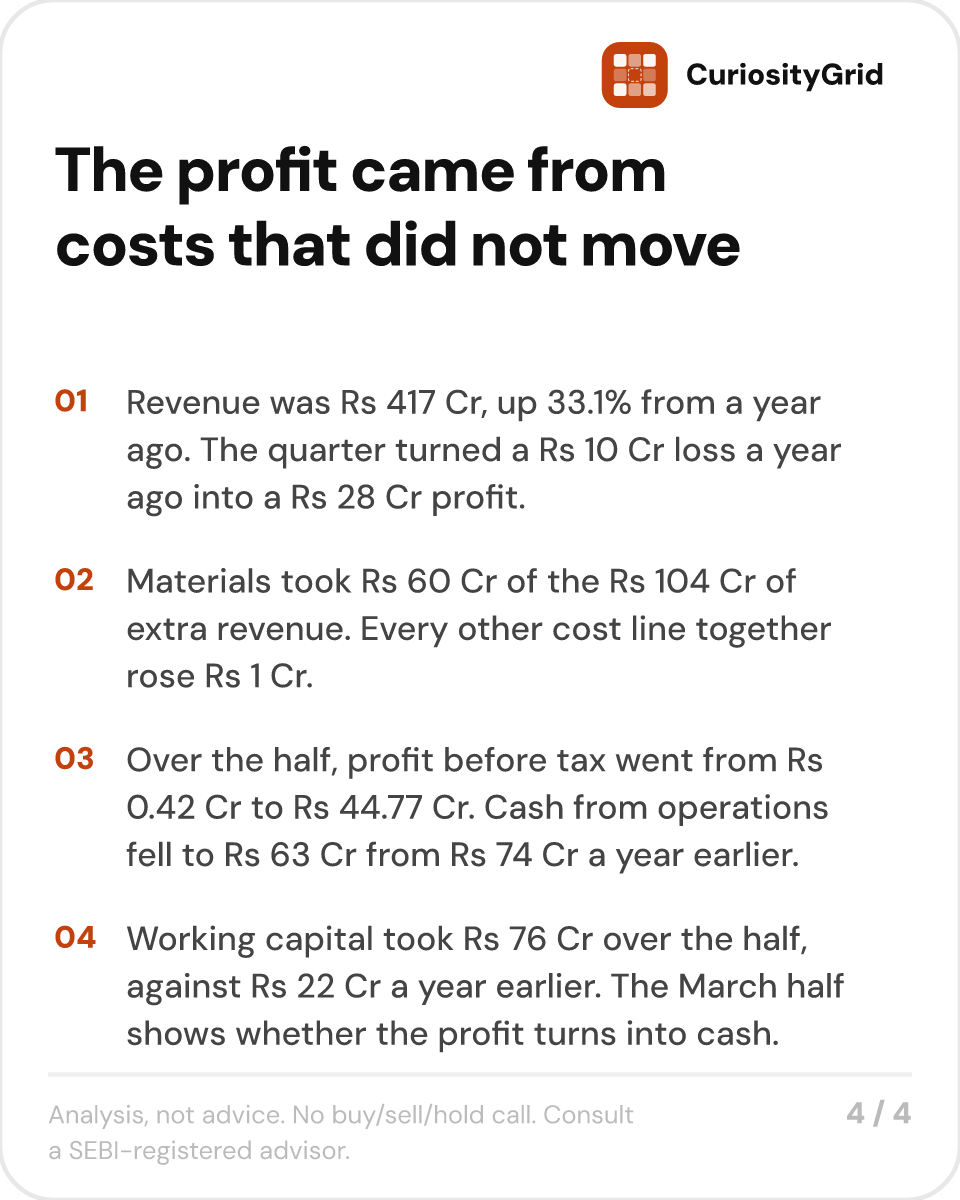
Revenue rose ₹104 Cr to ₹417 Cr, and materials took ₹60 Cr of that. Employee cost, other expenses, finance costs and depreciation came to ₹171 Cr between them, against ₹170 Cr a year ago. That is the whole swing to profit, a third more revenue arriving on a cost base that stood still.
→ Revenue ₹417 Cr, up 33.1% from a year ago
→ Total expenses up 18.8% from a year ago, against revenue's 33.1%
→ Employee cost up 5.0%, other expenses down 1.1% from a year ago
→ Finance costs down 14.6% as borrowings fell to ₹570 Cr from ₹665 Cr in March
Those four lines have sat near ₹171 Cr for three quarters now. Quarterly revenue over the same stretch went ₹314 Cr, ₹382 Cr, ₹417 Cr.
The profit has not reached cash.
Over the half, profit before tax went from ₹0.42 Cr to ₹44.77 Cr. Cash from operations fell to ₹63 Cr from ₹74 Cr a year earlier. Before working capital it rose to ₹140 Cr, from ₹98 Cr in the same half last year. Working capital then took ₹76 Cr of it, against ₹22 Cr a year earlier.
Receivables are most of that, absorbing ₹67 Cr over the half against ₹16 Cr a year earlier. Collection has not slipped, though. Receivables stood at about 115 days of sales in September against 117 days in March, so the build is the growth rather than slower payment.
Solara pays no tax, current or deferred, because it still carries accumulated losses of ₹274 Cr, down from ₹319 Cr in March. Reported profit and pre-tax profit are the same number until those are used up.
The March half shows whether the profit turns into cash.
#SOLARA #result #FY27
Source: Solara Active Pharma Sciences Limited, unaudited consolidated results, limited review, quarter and half year ended 30 September 2026, filed 16 October 2026.
Analysis, not advice. No buy/sell/hold call. Consult a SEBI-registered advisor.
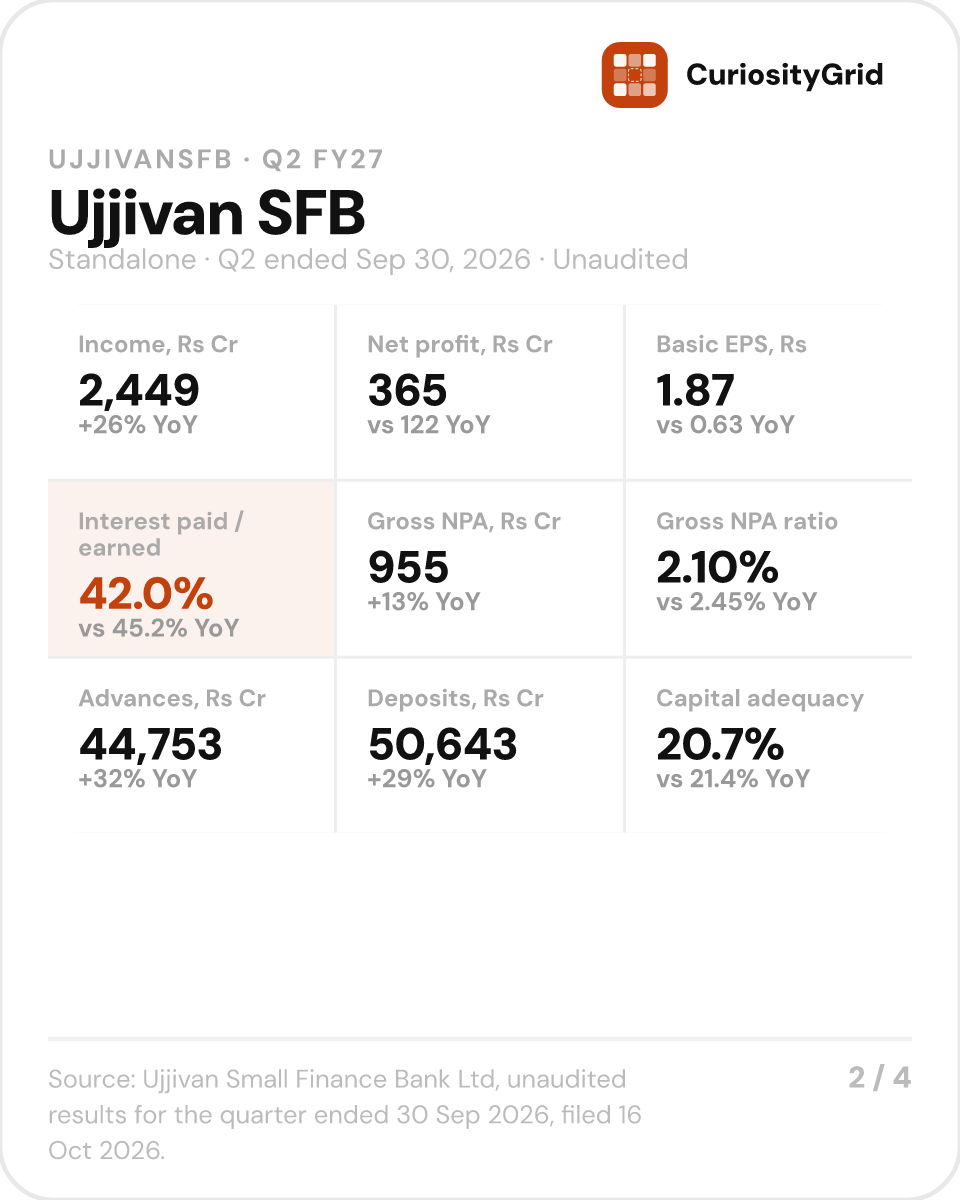
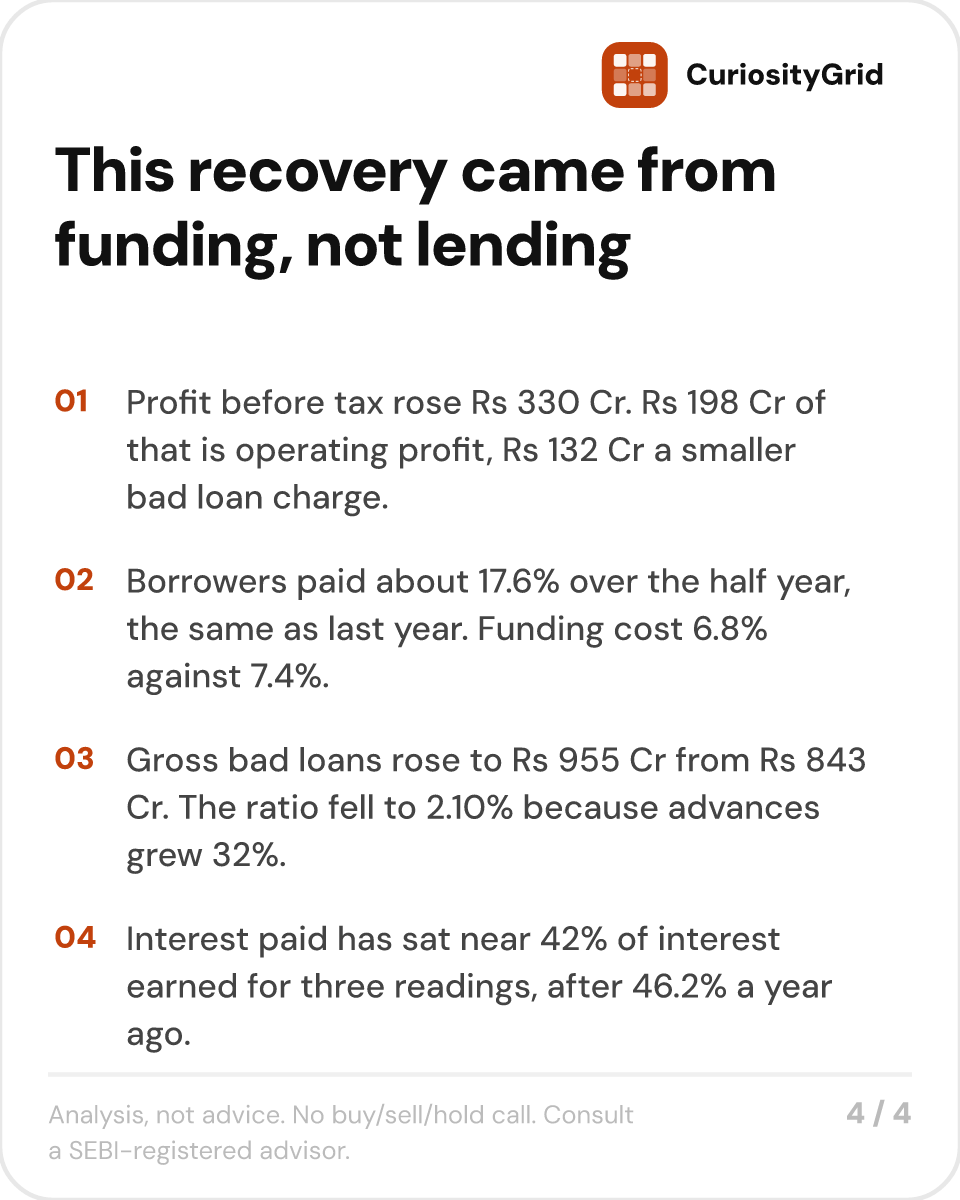
Ujjivan Small Finance Bank reported a bad loan ratio of 2.10% for the September quarter, against 2.45% a year ago. In rupees, bad loans went the other way, from Rs 843 Cr to Rs 955 Cr.
The ratio fell because the loan book grew faster than the trouble inside it. Advances are up 32% over the year, at Rs 44,753 Cr.
→ Net profit Rs 365 Cr against Rs 122 Cr a year ago
→ Interest paid took 42.0 paise of every rupee of interest earned, against 45.2 a year ago
→ Deposits up 29% to Rs 50,643 Cr, borrowings cut by Rs 710 Cr in six months
→ Capital adequacy 20.7%, down from 21.4%
Profit before tax rose Rs 330 Cr on the year-ago quarter. Rs 132 Cr of that is the bad loan charge falling, from Rs 235 Cr to Rs 103 Cr. The other Rs 198 Cr is operating profit.
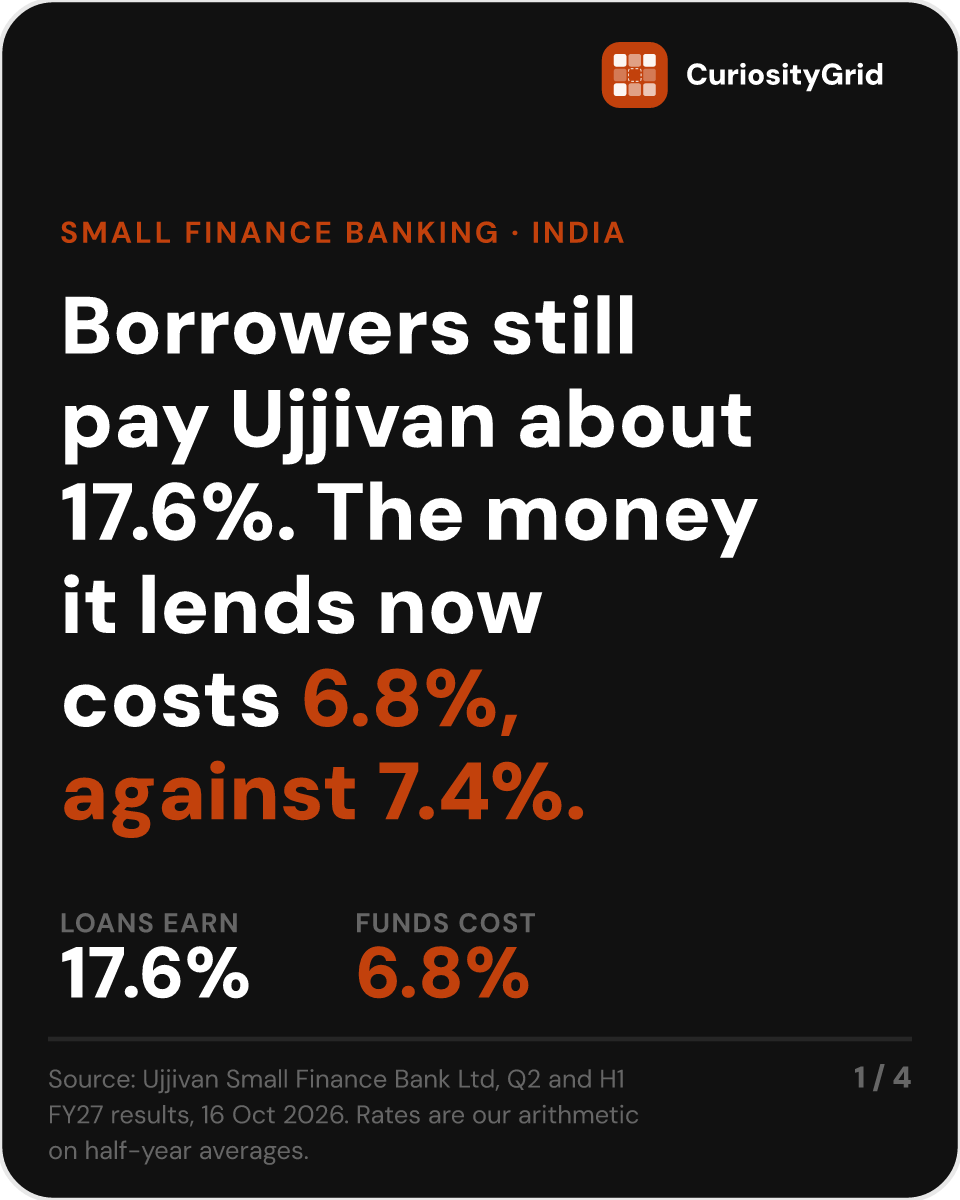
A lender like this earns the gap between what borrowers pay and what depositors are paid. The borrower side of that gap has not moved. Interest on advances worked out to about 17.6% of the average book over the half year, the same as last year (our arithmetic). The depositor side did move. Interest paid came to about 6.8% of average deposits and borrowings against about 7.4%, worth close to Rs 160 Cr a half year at this size.
That move is older than this quarter. Interest paid ran at 42.3% of interest earned across the second half of last year, 41.4% in June, 42.0% now. The 46.2% it ran at in the first half of last year is the base the tripling is measured against.
Costs and fees moved instead. Operating expenses took 61.5% of income after interest paid, against 66.5% a year ago and 62.0% in June. Other income rose to Rs 296 Cr from Rs 256 Cr in June. It carried Rs 40 Cr of the Rs 46 Cr sequential gain in operating profit. The Rs 61 Cr gain in net interest income went into a Rs 55 Cr rise in costs.
Treasury did less work. Gains on investments came to Rs 13 Cr for the half year against Rs 47 Cr. The treasury segment earned Rs 38 Cr against Rs 91 Cr. Other income still grew, which puts fees and recoveries ahead of what the headline carries.
Bad loan provisions and loans written off come as one figure, Rs 204 Cr for the half year, and the two are not broken out. Gross bad loans still rose Rs 31 Cr over the June quarter against that charge.
Three readings have now put interest paid near 42% of interest earned. December makes it four or breaks the line.
$UJJIVANSFB #result #FY27
Analysis, not advice. No buy/sell/hold call. Consult a SEBI-registered advisor.
Source: Ujjivan Small Finance Bank Ltd, unaudited results for Q2 and H1 FY27, filed October 16, 2026. Limited review.
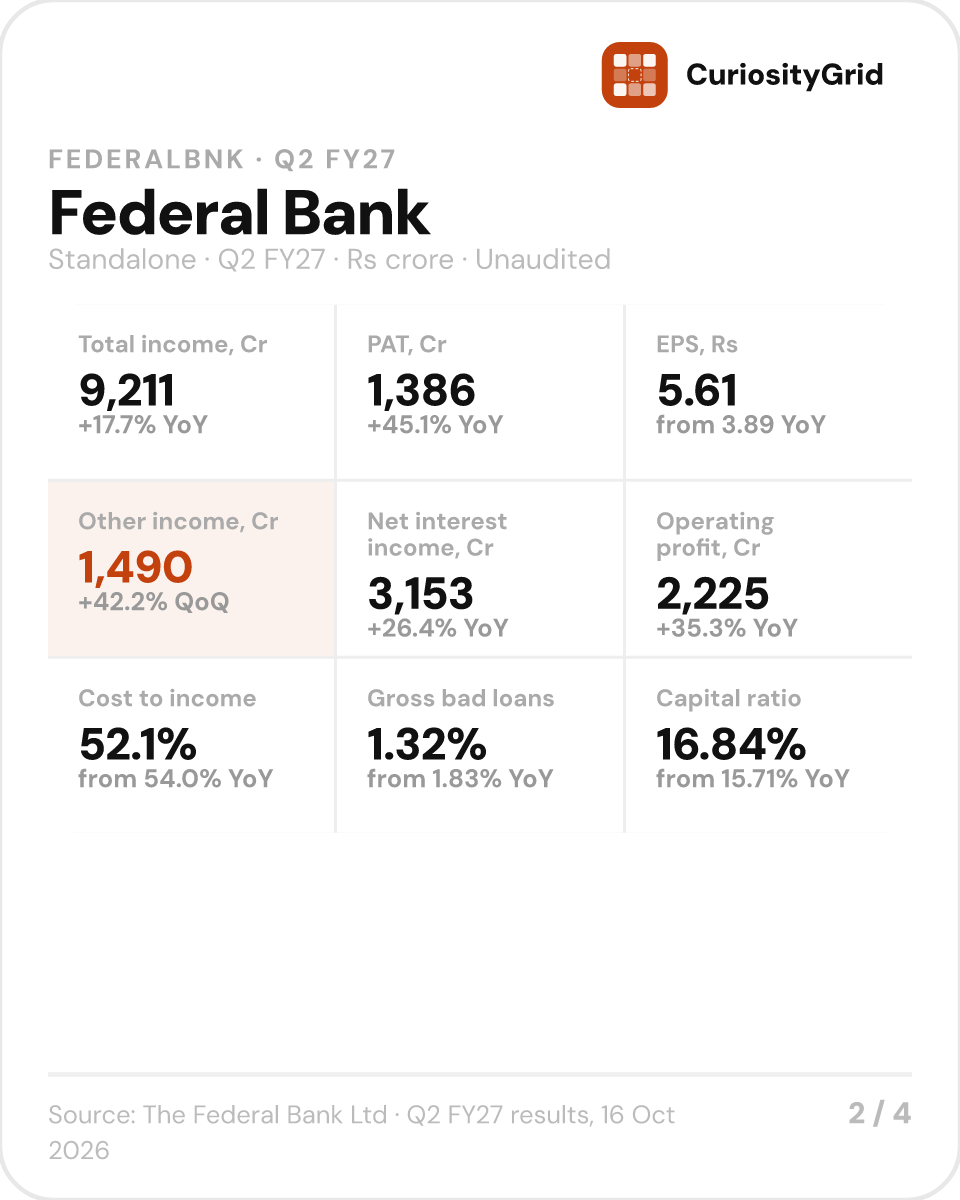
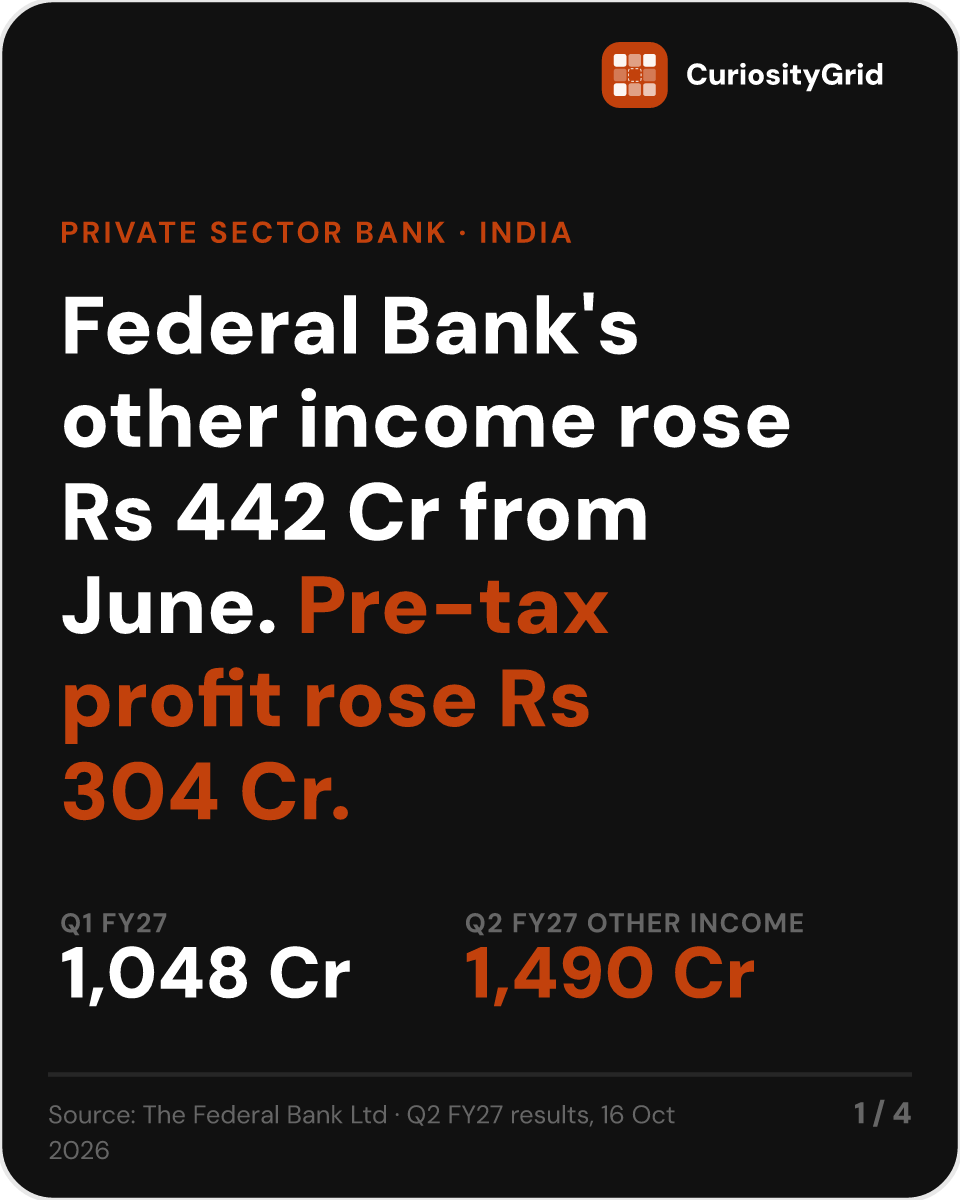
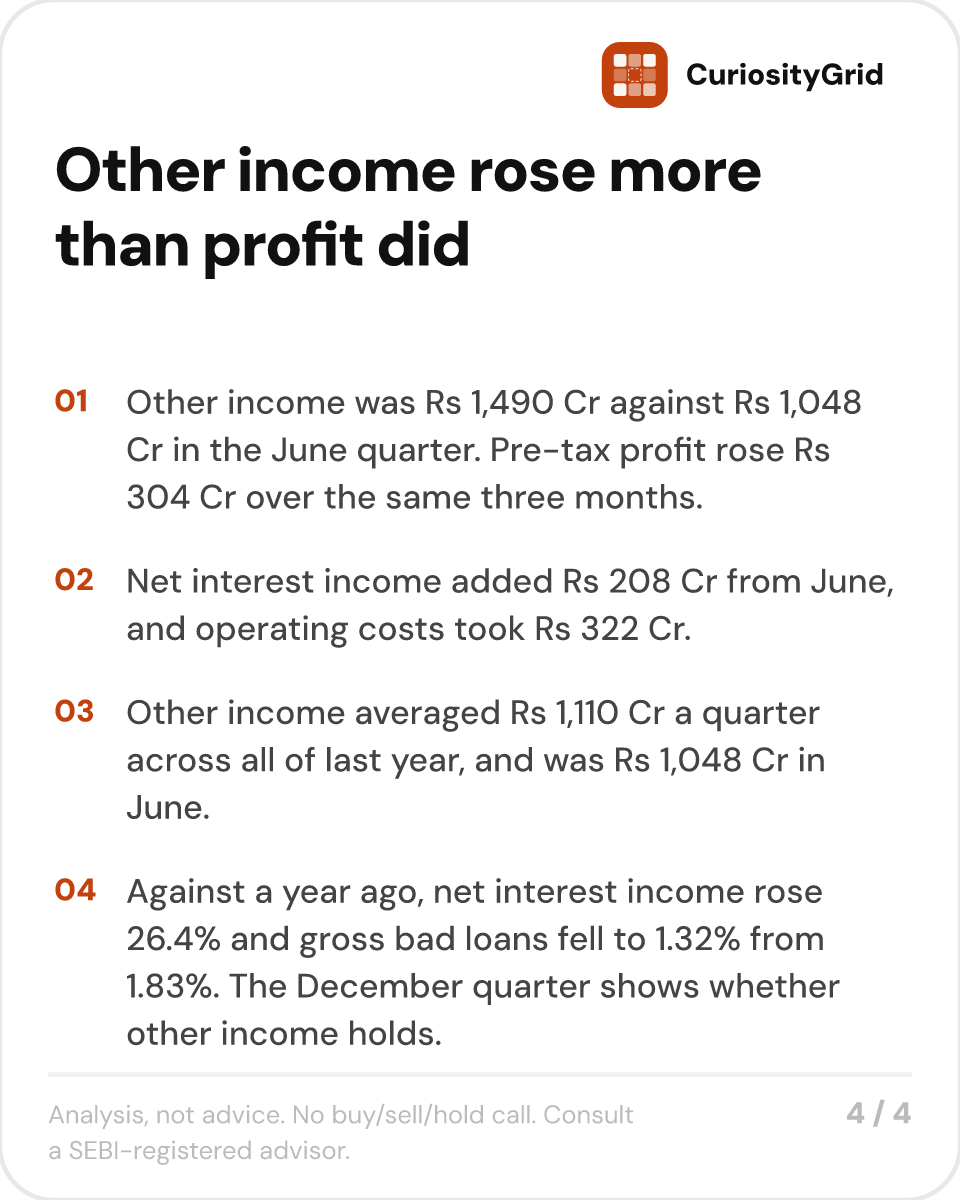
Pre-tax profit at Federal Bank rose ₹304 Cr from the June quarter. Other income, one of the lines inside it, rose ₹442 Cr.
The rest of the bank went backwards over those three months. Net interest income added ₹208 Cr and operating costs took ₹322 Cr, leaving the lending side ₹114 Cr worse off than in June. Provisions cost another ₹24 Cr.
→ Other income ₹1,490 Cr, against ₹1,048 Cr in the June quarter
→ Net interest income ₹3,153 Cr, up 26.4% from a year ago
→ Costs took 52.1 paise of each rupee of income, from 54.0 a year ago
→ Gross bad loans 1.32%, from 1.83% a year ago
That line had been sitting still for a year. Other income was ₹1,113 Cr in the June 2025 quarter and ₹1,082 Cr in the September 2025 quarter. Across all of last year it averaged ₹1,110 Cr a quarter, and in June it was ₹1,048 Cr.
Federal Bank puts fees, commission on non-fund business, foreign exchange and derivative earnings, third-party product sales, gains on investments, subsidiary dividends and recoveries from written-off loans into that one line, and the parts are not sized each quarter.
Over the half, investments were revalued to a ₹115 Cr profit, against a ₹17 Cr loss a year earlier. Dividends from subsidiaries came to ₹1 Cr, against ₹17 Cr a year earlier. Neither is near the size of the step.
Measured against a year ago rather than against June, the bank reads well almost everywhere. Net interest income rose 26.4%. Gross bad loans are 1.32% against 1.83%, and net bad loans 0.17% against 0.48%. Advances grew ₹34,124 Cr over the half, against ₹10,510 Cr a year earlier.
Employee cost is the exception, up 30.6% to ₹1,049 Cr. About ₹33 Cr of that is the move to fair-value accounting for stock options granted to all employees, which took ₹24 Cr off profit after tax.
The December quarter will show whether other income holds near ₹1,490 Cr or goes back to the ₹1,050 Cr it had been running at.
#FEDERALBNK #result #FY27 #Q2
Source: The Federal Bank Limited, unaudited standalone results, limited review, quarter and half year ended 30 September 2026, filed 16 October 2026.
Analysis, not advice. No buy/sell/hold call. Consult a SEBI-registered advisor.
@Normal_2610 The missing yield number does more work here than in a normal node step, since 4F² needs a vertical channel transistor, not the planar device in production today. Cell area also isn't die area, the periphery doesn't shrink with the array, so 50% more per wafer is a ceiling.
@Normal_2610 Beijing picking carefully works because of qualification. A coating gets specified into the tool, and requalifying another vendor runs in years. So a firm that looks replaceable by revenue is single source in practice, and one listing reaches that far.
@Normal_2610 5.5x revenue for a brand with no plant lands on the balance sheet as an intangible, so if it's carried as indefinite life there's no amortisation in the P&L at all. Reported earnings stay clean and the whole ₹1,250 Cr sits in one annual impairment test.