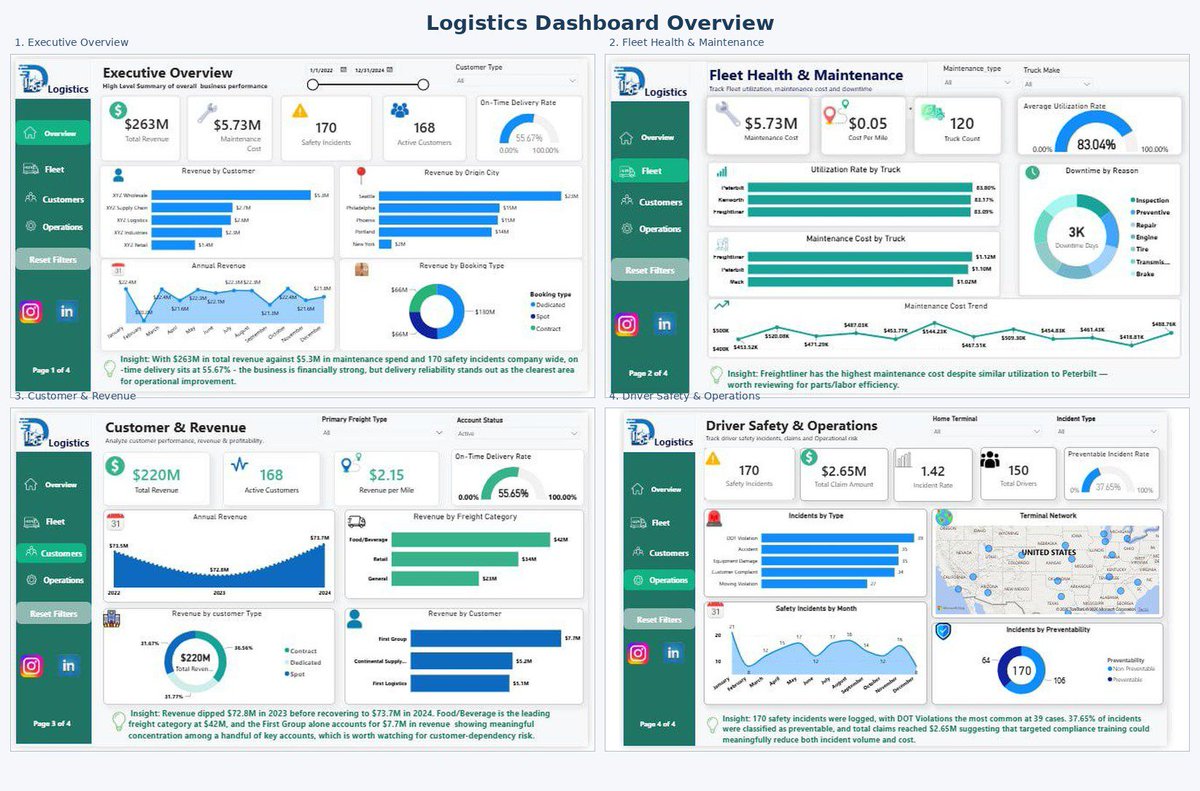
14 tables. 25+ DAX measures. 4 dashboards. Countless headaches 😂📊
My TS Academy capstone pushed me way out of my comfort zone — I doubted my design, nearly gave up, but made it to the finish line.
Thanks @TechSphereAcad & @ezekiel_aleke 🙌
Round two will be even better 🚀
14 tables. 25+ DAX measures. 4 dashboards. Countless headaches 😂📊
My TS Academy capstone pushed me way out of my comfort zone — I doubted my design, nearly gave up, but made it to the finish line.
Thanks @TechSphereAcad & @ezekiel_aleke 🙌
Round two will be even better 🚀
Dangote got ₦500k from his uncle in 1977.
Otedola got a £250k loan from his dad in 1999 for oil.
Rabiu took over his dad’s business at 24, then founded BUA.
Elumelu put in $7m to recapitalise a bank at 34.
Truth is, you need money to make more money.
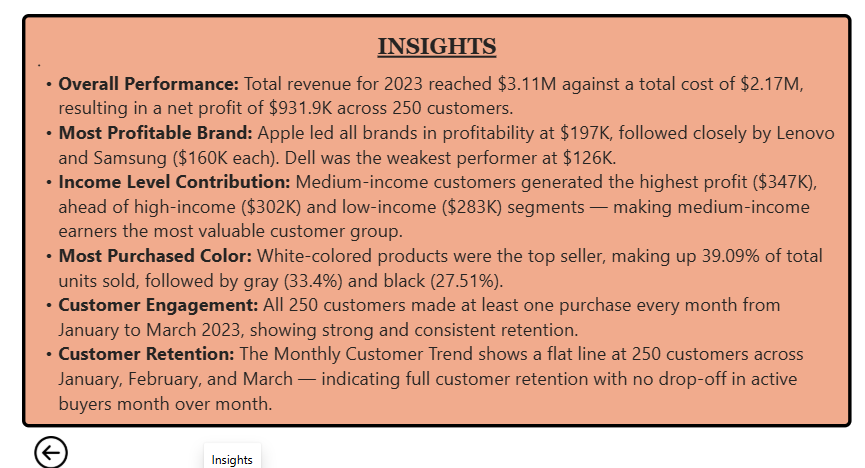
📊 My first Power BI project is complete! Built an interactive Sales Dashboard from raw Excel data using Power Query, DAX & data modeling. 🚀
🍎 Apple: $197K highest profit
💰 Medium-income: $347K profit
⚪ White: 39% of purchases
Thanks @ezekiel_aleke@TechSphereAcad 🙏
I Just Built my first interactive Dashboard from scratch using Excel; to present an actual Sales performance analysis from a given Dataset 📊
Taking one step at a time is the focus.
Shout-out to @ezekiel_aleke for knowledge shared, appreciate your role as an impactful tutor 🙏🏾
It’s 8:30 AM. Daniel, a Loan Portfolio Manager at Citi, has a management meeting in a few hours.
His director asks:
“How is the loan portfolio doing?”
He could open 4 different Excel files, pull numbers together and build another report.
Or… he could open one dashboard.
So I built one.
Started with 4 Excel tables → Power Query → Data Model → Calculated Columns → DAX → Power BI dashboard.
The dashboard gives him a quick view of:
• Total loan portfolio
• Expected interest
• Expected repayment
• Customers
• Segment performance
• Disbursement trends
But I didn't want it to look like another default Power BI dashboard.
So I built the visuals with HTML Content Visuals, including interactive KPI cards that flip when clicked to reveal more context.
I used Claude as a coding partner to help turn some of the visual ideas I had into HTML.
This project had actually been sitting unfinished for a while.
I finally decided to bring it back.
Because the goal wasn't just:
“Can I build a Power BI dashboard?”
It was:
“If I managed a loan portfolio, what would I need to see the moment I opened my dashboard?”
Still just page 1.
But we're back. 👀