$TSLA
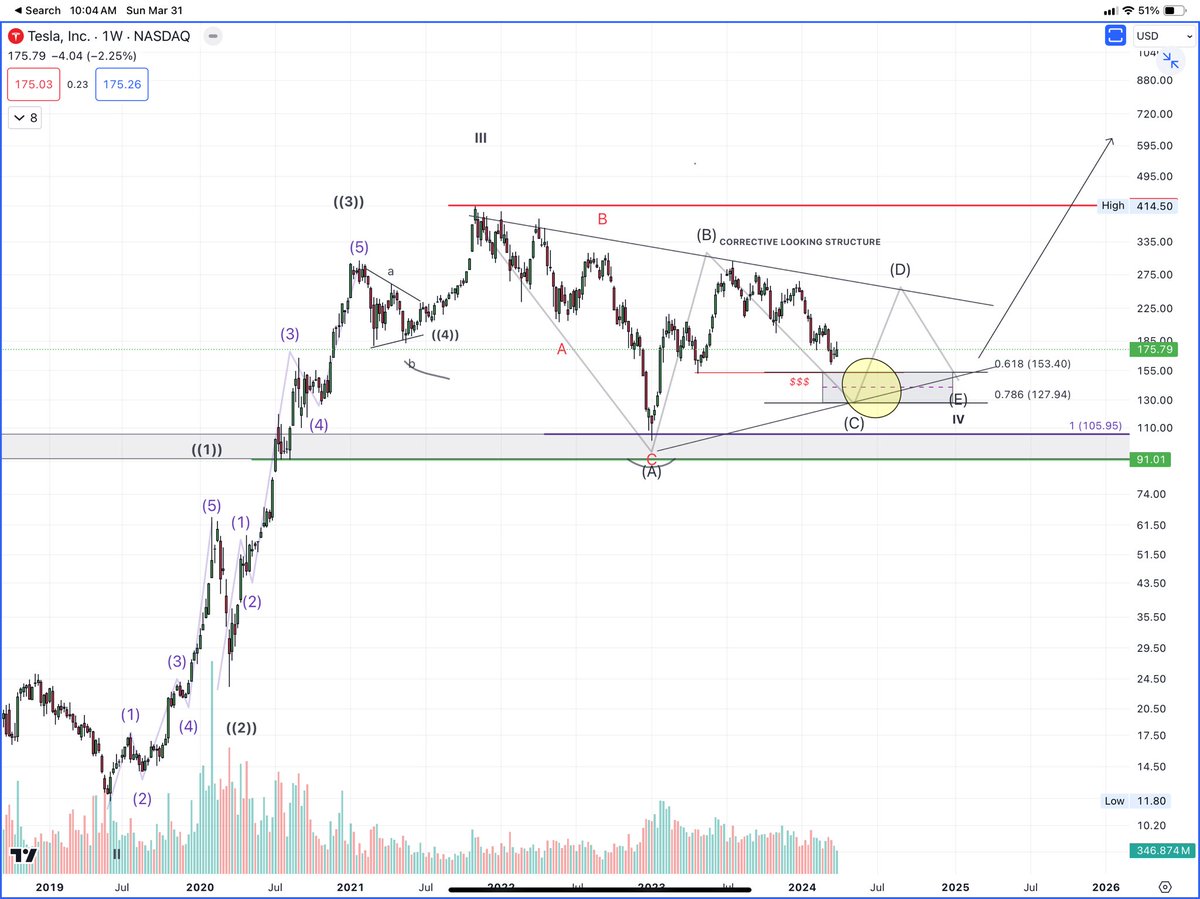
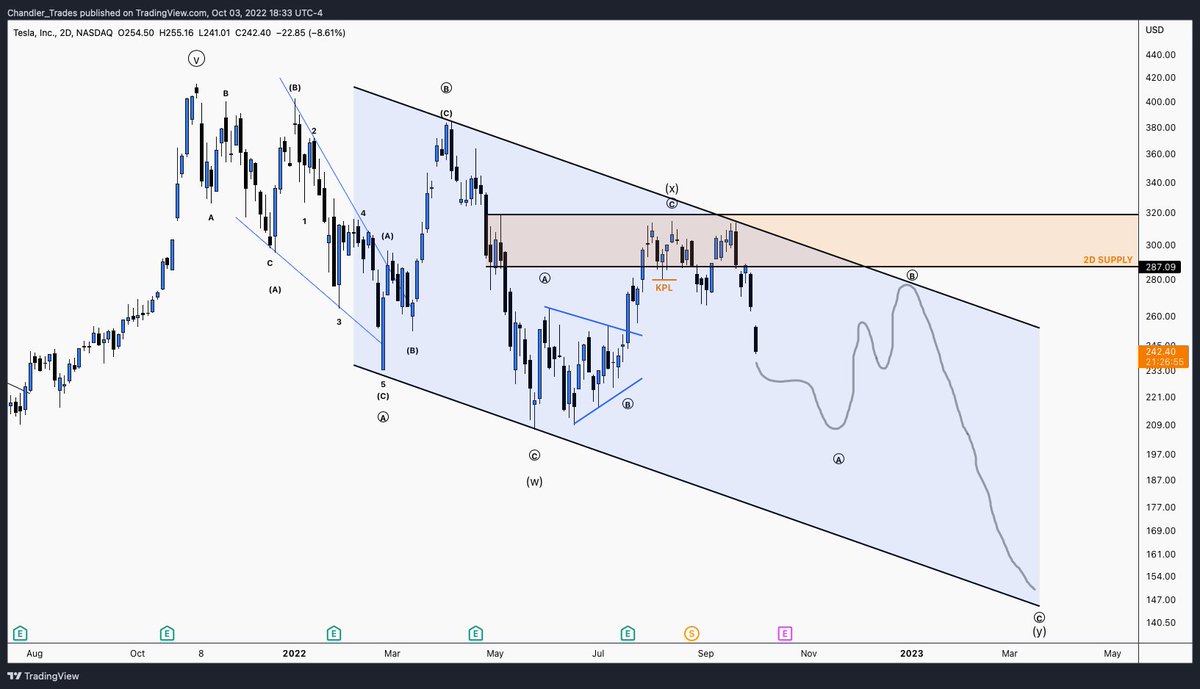
Higher degree w4 imo
Sub structure is corrective (all in 3’s/abcs)
I think range bound chop incoming prior to next leg up to take stock to 500+ IMO
Long term picture
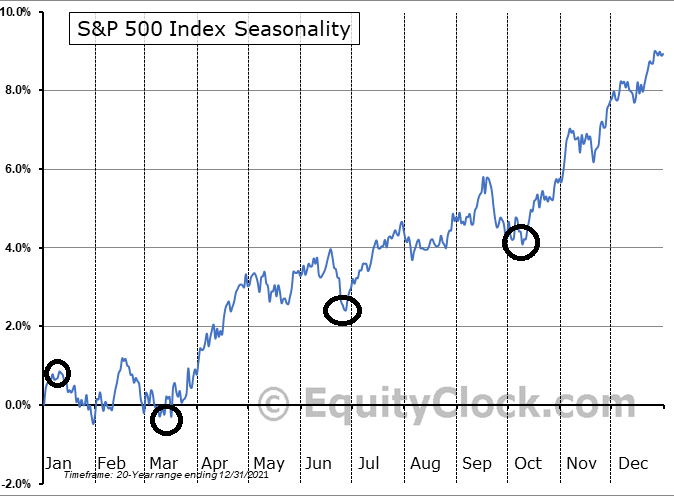
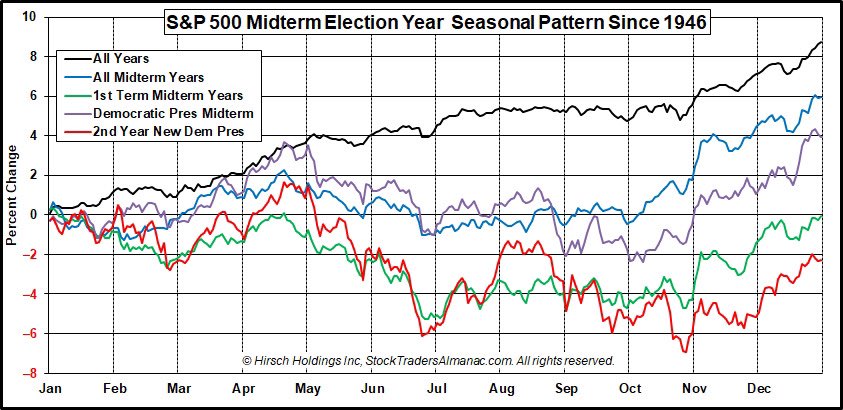
While the seasonal trend tracks poorly in bear markets, the seasonal turn points kept timing major $SPX turns decently in 2022 (major Jan high; March, June & Oct lows lined up). If it continues, worth noting while 1st week of Jan very strong, next key pivot is ~2nd week & bearish
Long Thread🧵
Best Way to protect your Portfolio in a bear market
Portfolio Results:
2018 - 2021 - Portfolio 20X from 20K to 400K
2022 - 7% Draw Down
Below screenshot for the best hedge strategy. I'll go into details later.
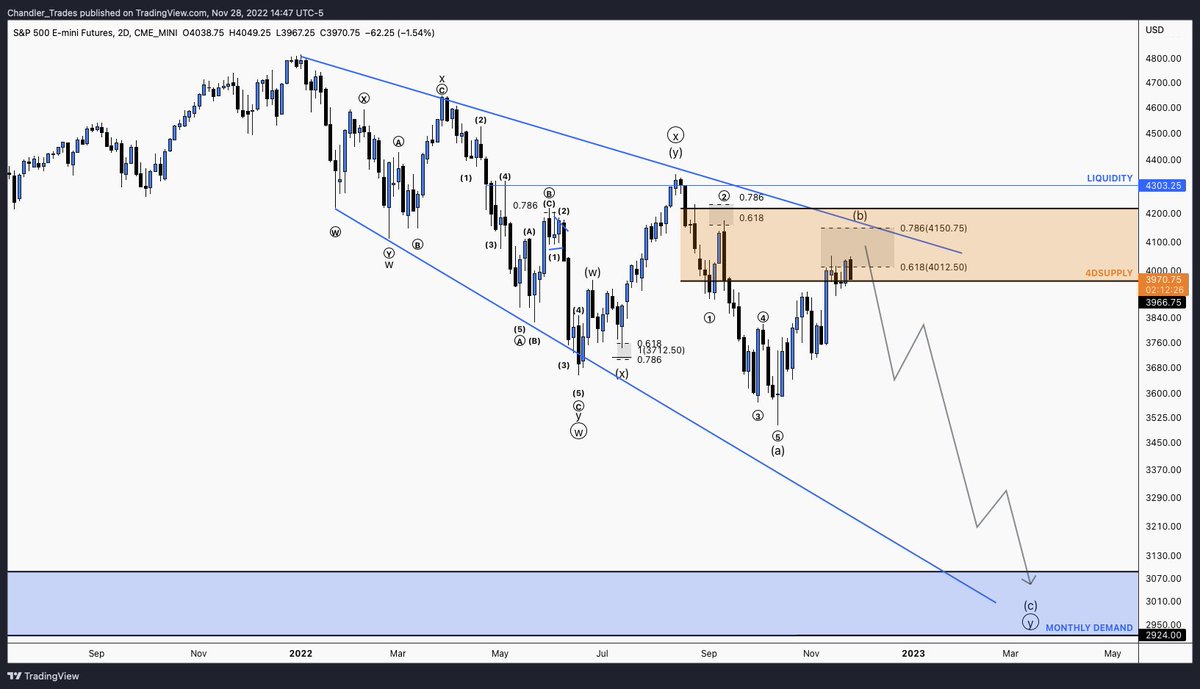
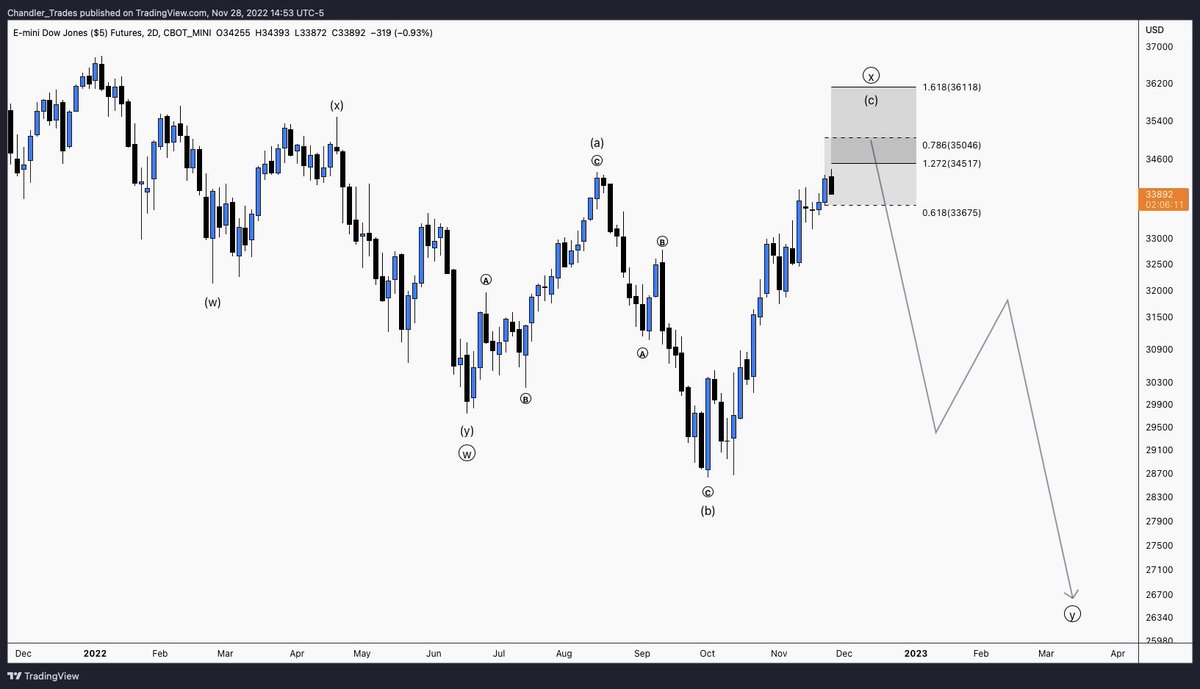
$ES_F $NQ_F $YM_F 2D
Macro outlook for the S&P500, Nasdaq & Dow
Corrective structures off ATH's are incomplete. I expect the bear market to resume shortly. I will be looking for swing-short opportunities once this rally concludes
Valid as long as $ES < 4300
$QQQ
we remain making lower highs, lower lows
Therefore, as long as that holds true
Expecting run of the 254.3$ low
This would complete a 5 wave structure from 334.4$ high where a relief bounce should happen
Monthly support below
$BTC requests
Filling out bear flag IMO
If 17.5–>19K demand continues to hold
Look for C up to purple TL resistance/26K area before another vicious leg down
$NVDA #NVDA Having trouble at the confluence area of the falling wedge resistance zone & bottom of the October 7th gap (orange circle).
If this can close above the falling wedge resistance zone over the next few days, watching for price to gravitate toward the gaps above.
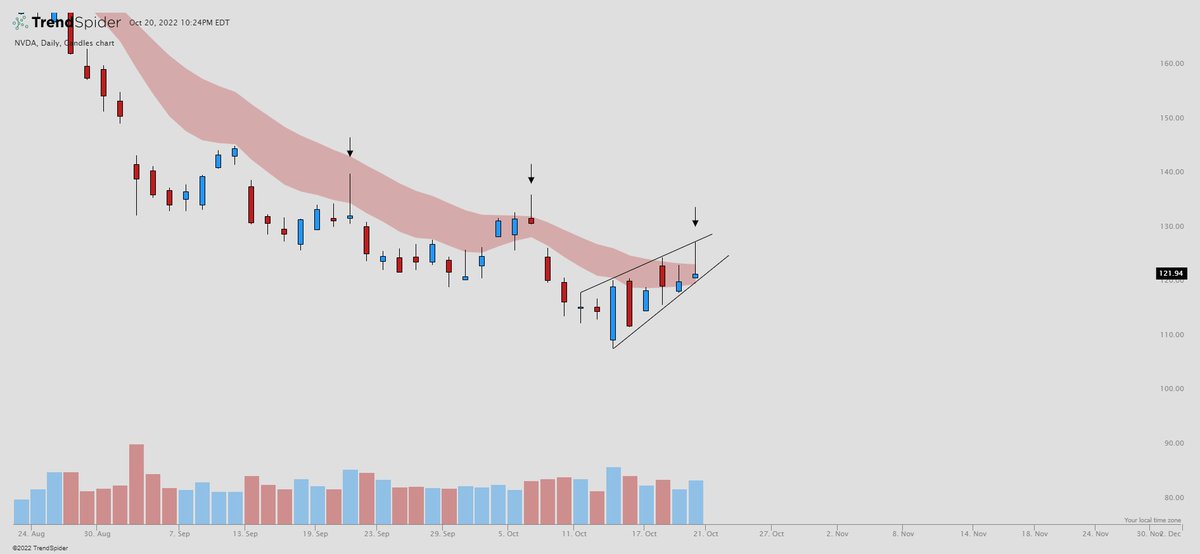
$NVDA
Top watch to the short side tomorrow
Keep an eye on the 121 spot to break for anticipatory entry, confirmation under 120
Nasty upper wicks on the daily with 9 ema siting at 120
Some trapped buyers in this one if we gap down tomorrow imo
Here's what I am seeing for $NVDA. We have seen these ugly upper wicks a few times before and have a nice rising wedge forming
Notice how it has dumped the days following these upper wicks (Arrows)
Buyers on those fake pumps get trapped on the gap down and leads to a sell off
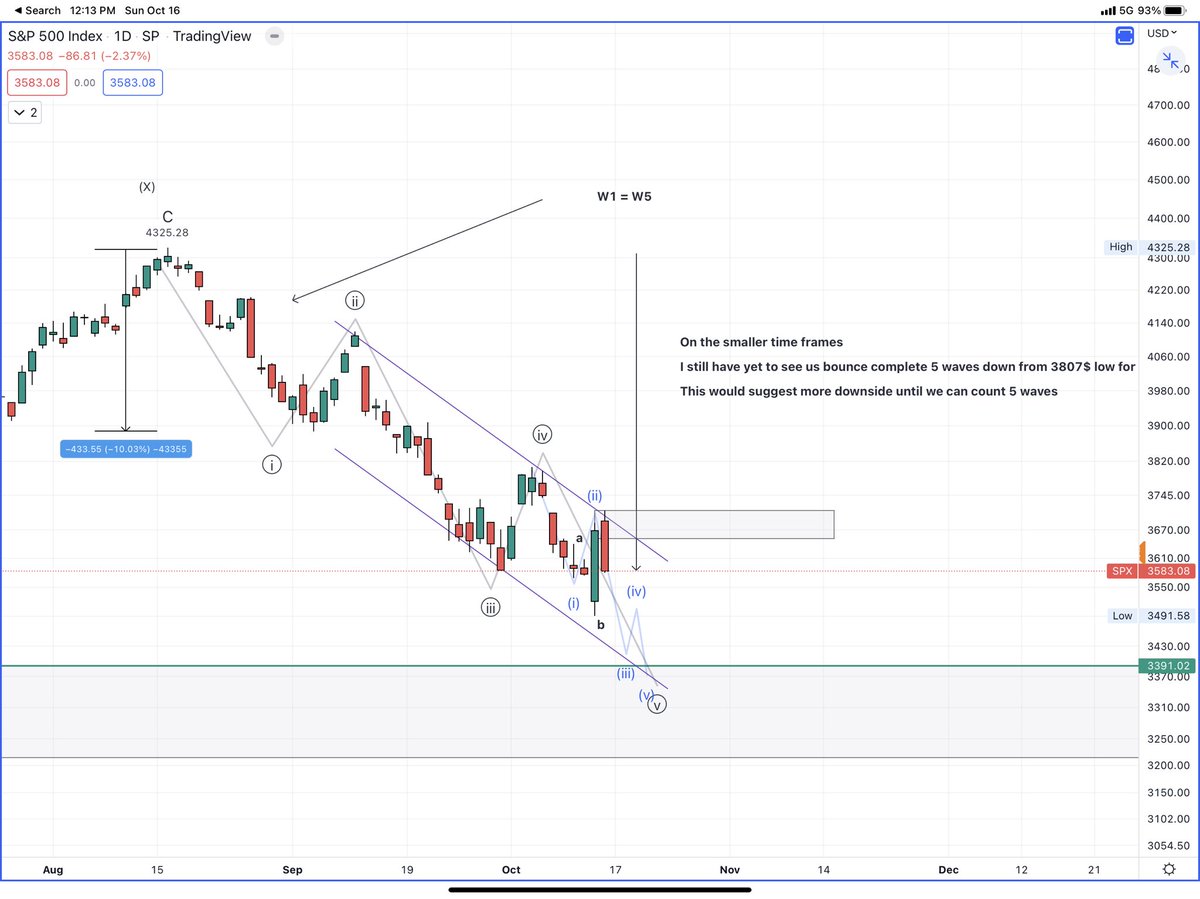
$SPX
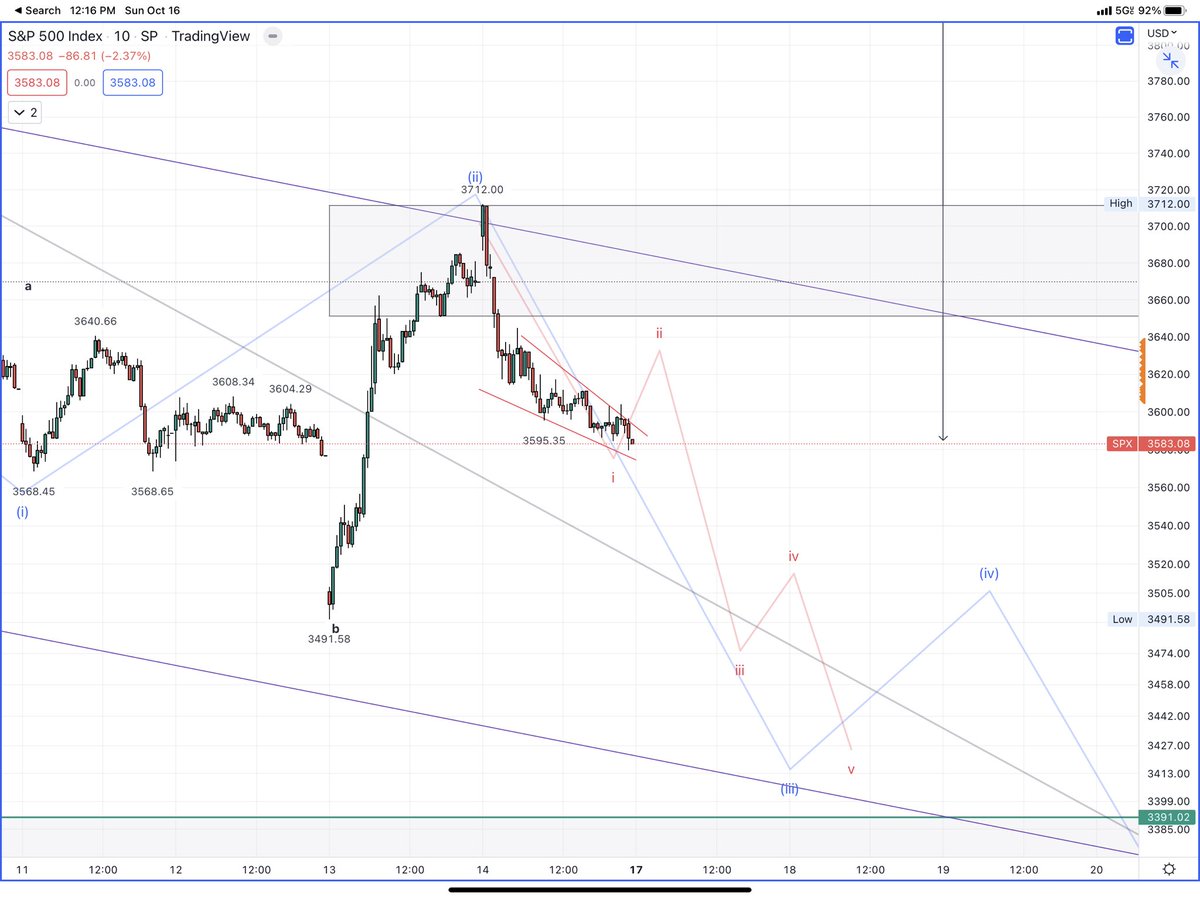
W1=W5 ~3400
This is also prior major monthly resistance turned support/confluence w/ channel support
Smaller TF’s look like a leading diagonal
A rally on Monday should be a nice short opp to catch w3 down
Seasonality (in red) keeps tracking pretty well the overall market swings—We saw a bounce in October for W-4, and now it suggests we should see a lower low for W-5 next before we can catch some relief into November🤝
$SPX $SPY This bounce so far agrees with the seasonality chart we have been tracking since April (in red)👍🏻 This suggests a short-term bounce around this time before a new low at the end of October