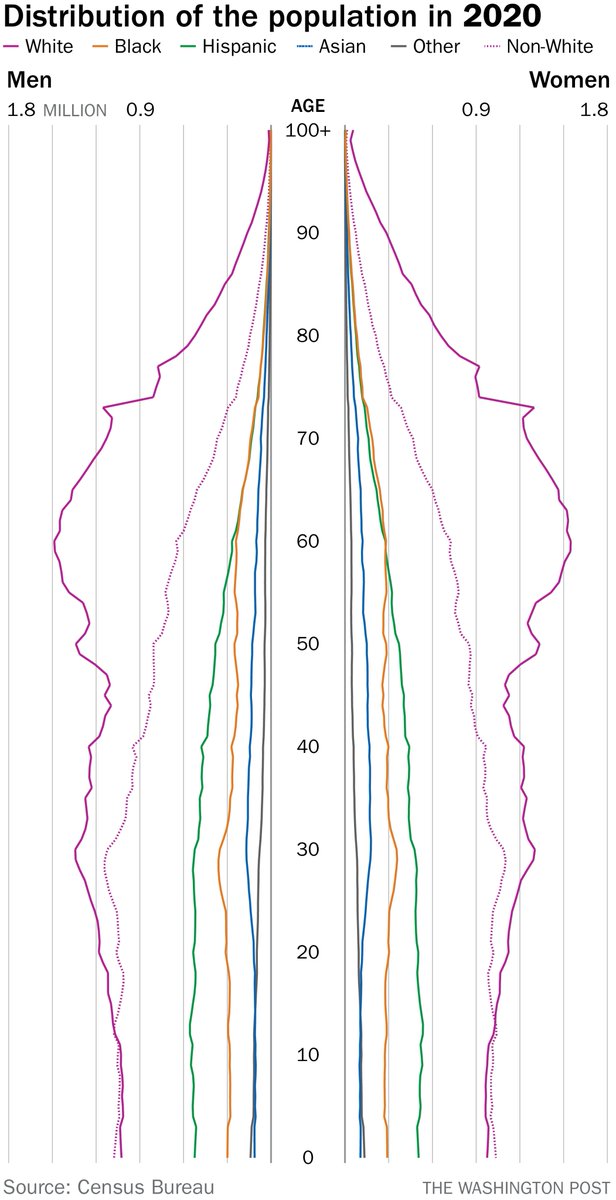
I'm trying to find the original source URL for this graph. It's definitely a @PostGraphics/@pbump image, but can't find it. Reverse Google and TinEye haven't helped.
Anyone have any ideas?
We’ve extended Digital Inclusion Week! At OCTO, we make technology inclusive every day by providing workshops and programming to increase digital equity in our communities.
Everyone deserves the opportunity to use technology to live, learn, work, and thrive.
#TechTogether
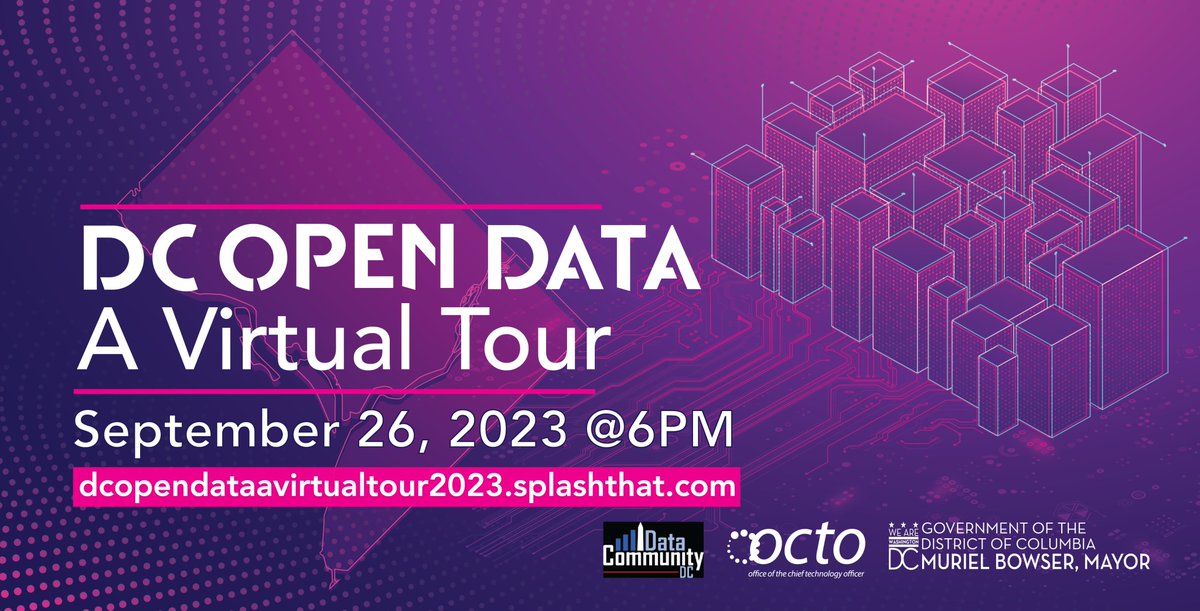
Levering and enhancing data helps improve programs, relationships with stakeholders, and supports local businesses and the lives of DC residents. Join us and learn more on Tuesday, September 26th!!
@opendatadc@DataCommunityDC
https://t.co/n9beHyEzLZ
Levering and enhancing data helps improve programs, relationships with stakeholders, and supports local businesses and the lives of DC residents. Join us and learn more on Tuesday, September 26th!!
@opendatadc@DataCommunityDC
https://t.co/n9beHyEzLZ
Learn more about Washington, DC's Open Data Initiative on September 26th in a virtual webinar at 6pm ET!
In collaboration with @OCTODC and @DataCommunityDC !
https://t.co/NjXzil89eK
Some of the authors from the @urbaninstitute's "Do No Harm Guide: Centering Accessibility in Data Visualization" report presented work with the @DataVizDC user group in April.
📺You can now watch the recording: https://t.co/2SObnnciYb
Here's a thread of the tools & resources.
Join @DataDrivenAngel at our Data Engineer's Lunch this Monday! 🚀 Learn about upgrading an on-prem IoT system's Postgres database and enhancing local database performance for analytical systems. Reserve your spot now! https://t.co/FqDabFylDK
#postgres#data