@cullenroche Fair enough RE maturity ETFs. I like both also.
How about in a retirement distribution context, do you utilize a framework for deciding how many years of precisely matched near & intermediate term assets (cash, bonds, etc.) vs. growth assets?
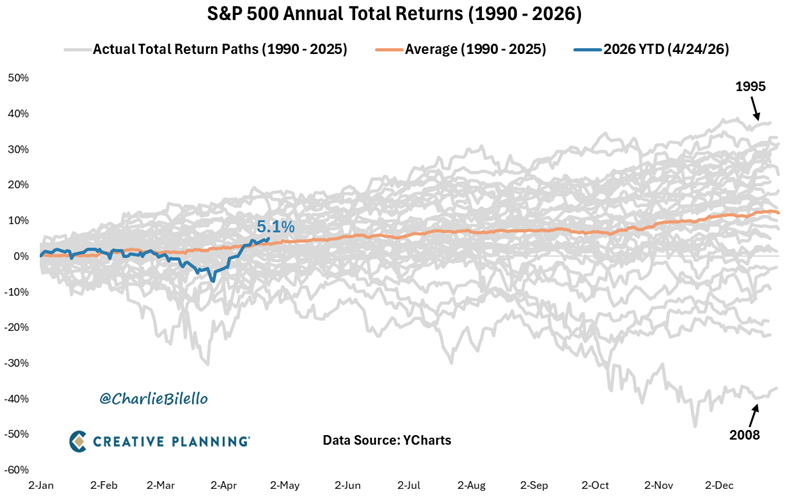
On March 30, the S&P 500 was down 7% in 2026, the 12th worst start to a year in history. After one of the biggest 4-week rallies ever, it's now up +5% YTD and above the average year at this point in time (+3%). There is no impossible in markets.
Video: https://t.co/Mc35tZCH30
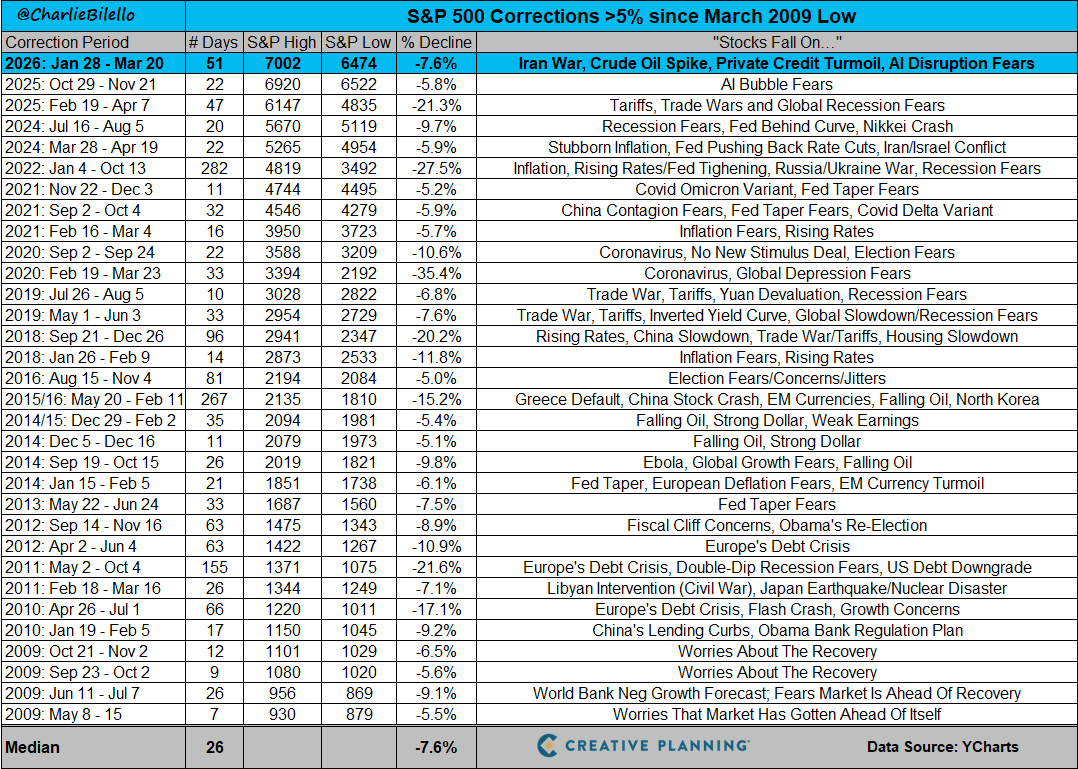
The S&P 500 is now down 7.6% from its January peak.
Is that a lot? Not at all.
This is right in line with the median correction off an all-time high since the March 2009 low.
We see a decline of this amount or more during most calendar years. That's the price of admission.
@MarkTMeredith Great graphic, Mark. Are you using target maturity assets (eg bulletshares/iShares, iBonds, etc.) for the short-to-intermediate term bonds portion of your buckets or more standard bond funds?
Any resources you drew inspiration from to define your system?
@DaveNadig@wjpoulin@TaxAlphaInsider Couldn’t State Street convert it to an opened ended ETF and fix the tax drag issue and the UIT termination date issue?
@MrNQDC NQDC is generally not available to self-employees business owners, is that correct? What size businesses do you typically see start to employ this structure? Do they need to be C-corps?
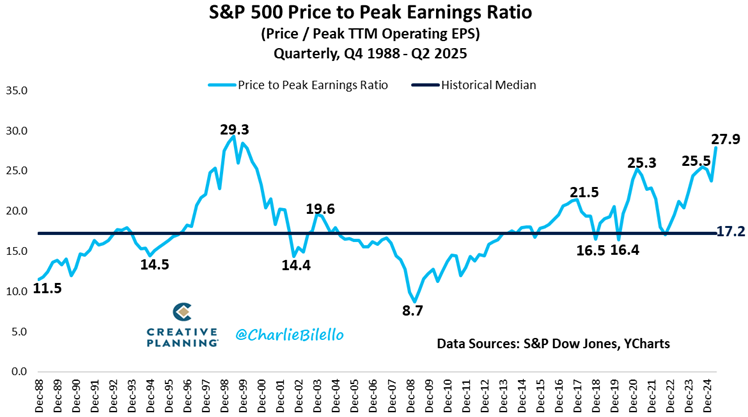
The S&P 500's price to peak earnings ratio has moved up to 27.9, its highest level since 2000 and 62% above the historical median. $SPX
Video: https://t.co/JuKAZxkVmv