$SOXX - The weekly candle is a bearish engulfing. The last time we had a similar candle was at the June top, so it doesn't bode well for next week. If wave B is over the minimal downside target for wave C is 400, where C=A in percentages. The linear C=A target is 374.
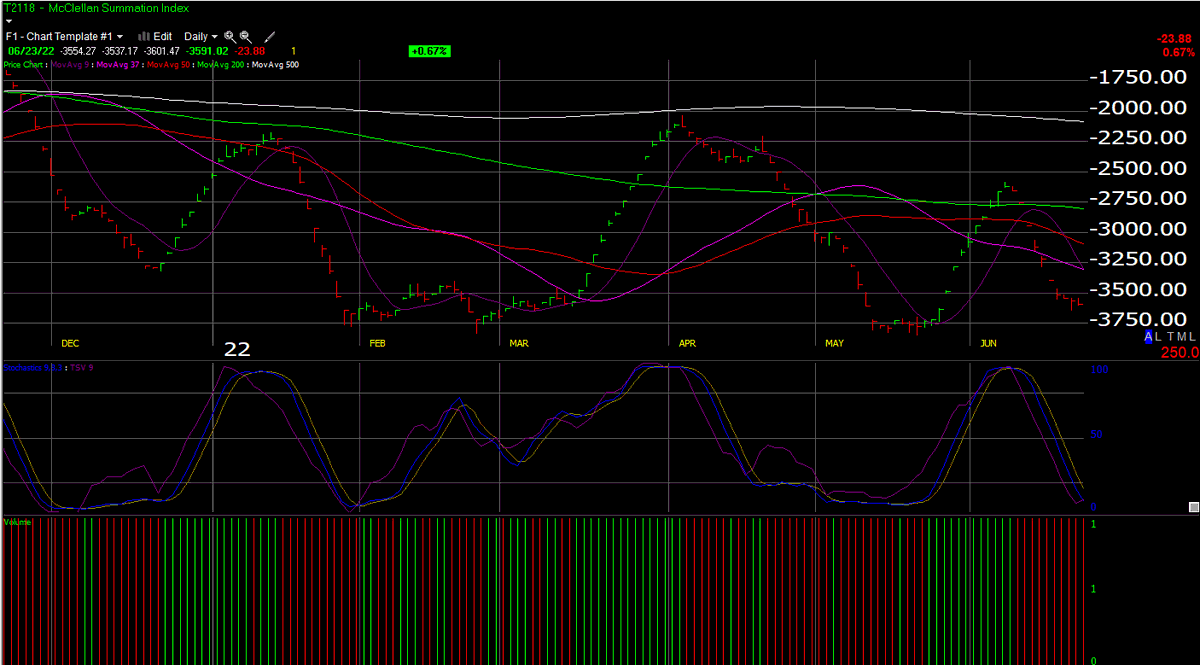
This indicator is a great tell on when a market is about to reverse. McClellan Summation Index. It looks like it's finding its footing down here. It only stops working when the Fed is manipulating the markets. When it's working I know the Fed has stepped back. It's working again.
@knightsfootball Jordy, I often think of that summer afternoon sitting on our front porch having a nice father/son conversation when you looked over at me and said "Dad, you're more like my best friend than my father." That melted my heart buddy. Congrats Landen Summers on winning his award
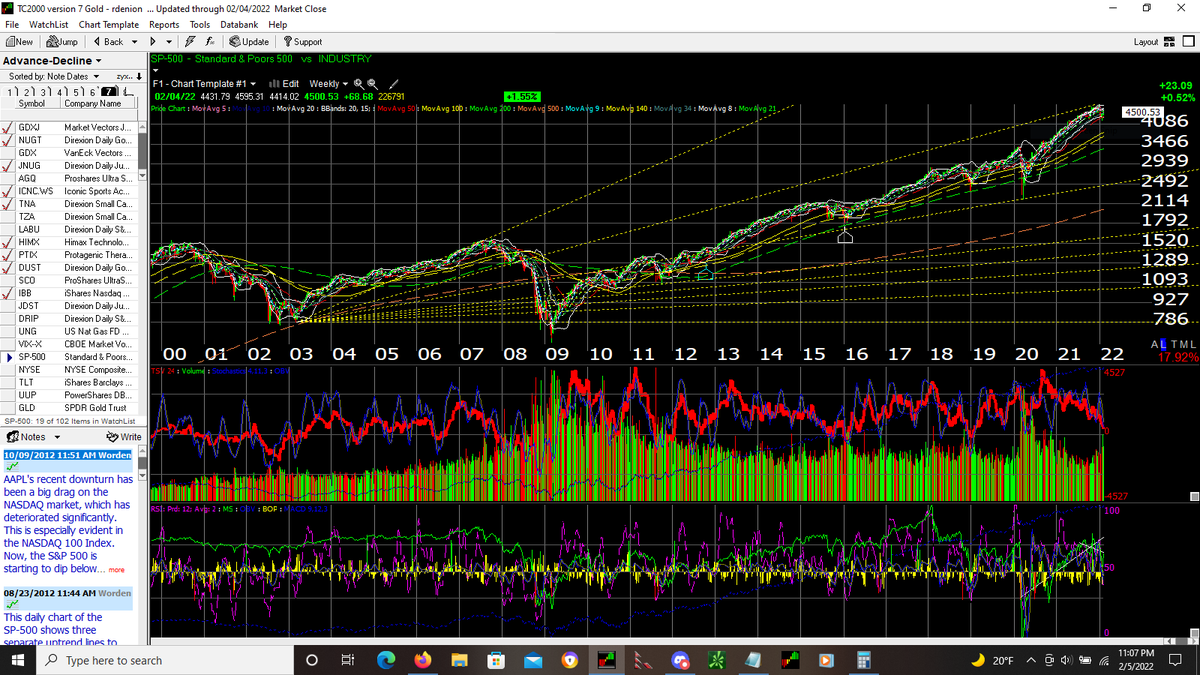
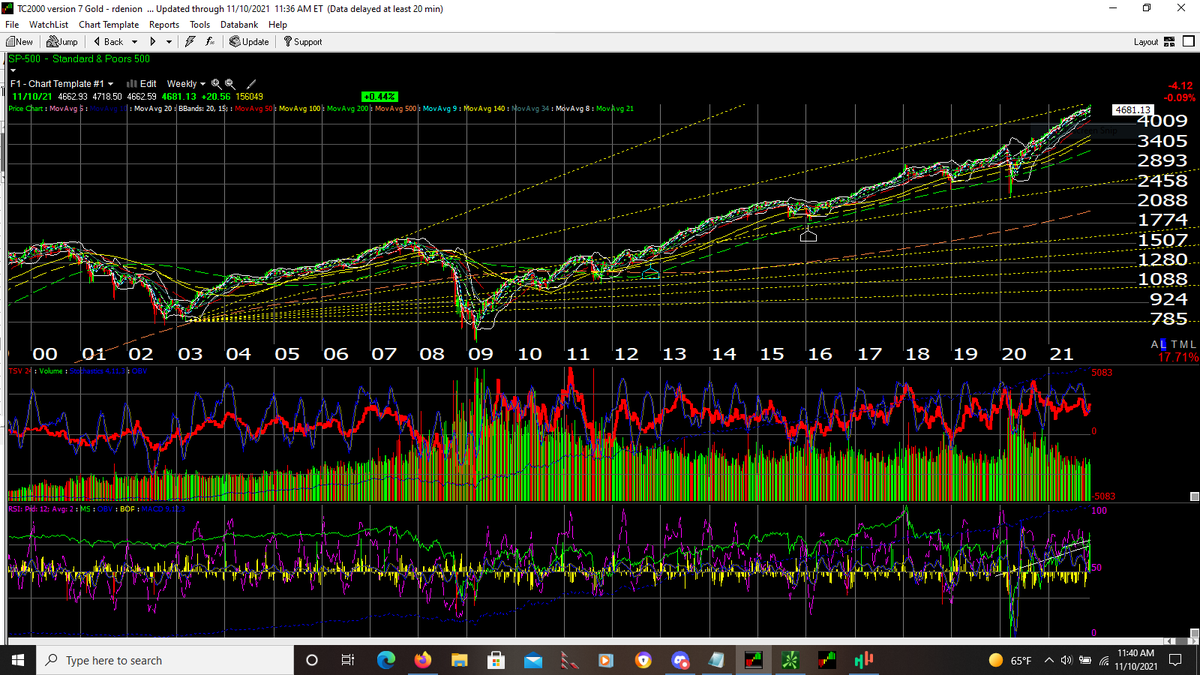
The s&p appears to be repeating 2007 all over again. As we approach the yellow fib fan line from 2002 I don't expect it to break thru but trend higher with the angle of the fan like 2007. A large dropped occurred in June which tried to recapture the trend and failed in Nov 2007.
The silver, gold (gold and gold miners), gld, and slv 30 min charts have all closed today above the 1000 day mavg. I'd say a bullish sign. The only index that hasn't broken thru yet is physical gold prices.
A strong close today in silver may suggest a low is in. If we don't get that strong close, $21.85 is the 50% retracement level. Still think a turn is coming but still could see lower lows then yesterday. A strong daily close after a big drop is usually a signal a low has been met
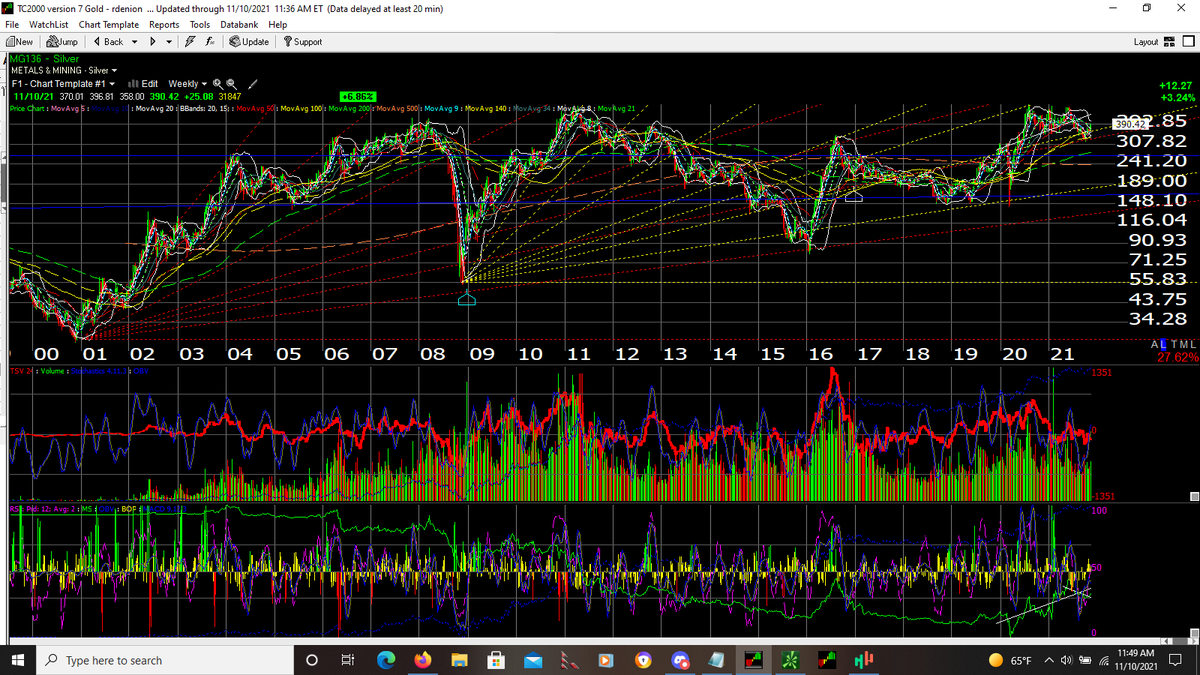
My silver index along with the XAU have hit their Fib Fan levels 2008 low (yellow) 2000 low (red). Brown line is the 500 day mavg. Ideally silver should start to find some footing here soon. This has worked quite well in past turn points. June 1st turn coincided with yellow fib.
I'm going to go out on a limb here and say that the silver index is nearing a turn point. Either the yellow, red dotted lines or the brown line (500 day mavg). Sorry for the poor picture quality. I think we see one more low.
@Trader_Dante You know TMJ causes things like that. It's from clenching of the teeth at night. It inflames the vagus nerve behind the right side of the ear. The vagus nerve controls many things. Try a night guard. Haven't had anything like this happen to me in 30 years now since the guard.
@DaveHcontrarian As for the s&p my chart from 2003-2021 has the s&p edging closer and closer to that yellow dotted line which I believe will be the top. See how it caught the exact bottom in 2020.
@DaveHcontrarian I don't tweet much. Replying to David Hunter. This chart is the silver index. Red dotted line 2000 low to present. Yellow dotted line 2008 to present. Has caught every turn point up and down. Look where it is as of Aug 20th. I'm in your camp.