5 reasons your ads aren't performing. None of them is "the algorithm."
For the last few months, my co-founder and I have been talking to Shopify founders.
When ads stop working, most people blame the algorithm first. But most of the time, it is one of these five things.
1. Your pixel stopped reporting sales.
This one is easy to miss. Maybe you reconnected Meta, changed your theme, or added a new cart app. Now your sales don't show up in Meta. So the ad looks like it failed, even when it didn't. Place a test order and check Meta's Test Events tool before you cut the budget.
2. The ad and the page don't match.
Lots of people click. Very few buy. We hear this one all the time. Someone clicks on an ad for one product and lands on your homepage. Or the page loads slowly on their phone. The ad did its job. The page didn't.
3. You are paying to reach people who would buy anyway.
Meta shows your ads to the people most likely to buy. Often, those are your past customers. Your results look great, but you aren't getting new ones. Upload your customer list to Meta and set a limit on how much you spend on past buyers.
4. Your margins are too thin for ads.
Say you make $15 profit on each order. But it costs you $40 in ads to get one customer. You lose $25 every time someone buys. Better targeting can't fix that. You need bigger orders, bundles, or more repeat buyers first.
5. You have been running the same ads for six weeks.
People have seen your ad too many times. They stop clicking, and showing the ad costs more. It feels like the platform turned against you, but the audience is just tired of it. Raising your budget too fast does the same thing. One founder jumped from $2K to $5K a day, and their cost to show ads almost doubled.
None of these are exciting. But check the simple things before you blame the platform.
Which of these have you run into? Or is there a sixth one i missed?
We helped 12 brands build their CRO A/B testing framework. The same mistakes showed up almost every time.
Brands had good tools. but they were missing a clear way to run and read the tests.
1. Testing without enough traffic.
If your page gets a few hundred visitors a week, a small test will never give you a real answer.
2. Testing without a reason.
"Let's try a green button" teaches you nothing when it loses.
3. Stopping as soon as one side is ahead.
Early leads flip. Day one winners are often gone by day ten.
4. Picking the winner on the wrong number.
More add-to-carts can still mean less money in the bank.
5. Reading one average for everyone.
A flat result often hides a mobile win and a desktop loss.
The brands that got this right ran fewer tests and read each one with care.
I put the full fix for each of these into a playbook. Comment "Framework" and I will send it over.
great add. copycats were number 4 on my list but you are right that I skipped the legal side. A trademark will not protect your formula. It does protect your name and packaging. That is what lets you get a copycat listing taken down fast. Filing before you go viral beats scrambling after. Did you learn that the hard way?
We talked to 20 skincare brands. Here are the 5 problems that came up again and again, and what the ones growing well are doing about them.
Most were a few years in and making real money. Different products, different teams, and almost the same list of growth headaches.
1. New customers keep costing more.
It costs about twice as much to get a new buyer as it did a few years ago. That buyer used to be cheap to reach. Now they eat into your profit. You run faster just to stay in the same place.
What helps: not judging ads by sales alone. Track how much profit you keep per order, and how long it takes to earn that money back. Sell bundles and sets so each order is worth more. And use email and text, since those do not charge you for every click.
2. Everything rides on one channel.
Most skincare brands grew up on Meta ads. That works until it stops. The rules change, costs jump, or your account gets flagged. Then growth stalls overnight.
What helps: not trying to learn every channel at once. Pick one more channel. Give it a real budget. Test it for 90 days before you decide. Reuse your best Meta videos there instead of starting over. The goal is a backup that already works before you need it.
3. The content never stops.
Growth runs on fresh content. A great ad stops working after a few weeks. Then you need the next one. For a small team, feeding that machine is a full-time job nobody has.
What helps: building a system, not one-off ideas. Take your best ad and make ten small versions of it. Pull clips and quotes from your reviews, since real customer words work better anyway. Film a whole month of content in one day.
4. The market is crowded and copies come fast.
There is a new serum launching every week. The moment your product works, cheaper copies show up on TikTok and Amazon. A good formula is no longer enough to stand out.
What helps: competing on trust and brand, not formula. Pick one clear customer or problem and own it. Put the founder front and center. Build a real community. A copycat can match your formula. They cannot match the bond you have with your customers.
5. The first sale is easier than the second.
Most first-time buyers never come back. Growth built only on new customers is costly and shaky. The real money is in the second and third order.
What helps: plan for the comeback before you spend more on ads. Send a simple email right when the product runs out, so you show up when they need more. Offer a subscribe-and-save option on daily-use items. Watch your repeat-buyer rate every week, not once in a while.
None of these are new. What stood out was how often they came up. The same problems, over and over, no matter the product or the team size.
If you run a skincare brand, which one slows you down the most right now? Curious if there is a sixth I should add.
I used to think the D2C founders with the big sales numbers had it all figured out. I don't really think that anymore.
If you're running ads, the number goes up almost no matter what, just from more people landing on your store. So it can look like the business is getting stronger when it might not be at all.
What I actually think about now is whether people genuinely want the product, or whether an ad and a discount just caught them at the right moment. Would they have paid full price for it? Would they come back on their own, without being chased with another ad? Has even one person liked it enough to tell a friend?
You can watch that number climb for months and still have no idea whether you built something people care about, or just borrowed their attention until the ad budget dried up.
Ever had a month that looked great on paper but didn't quite sit right with you?
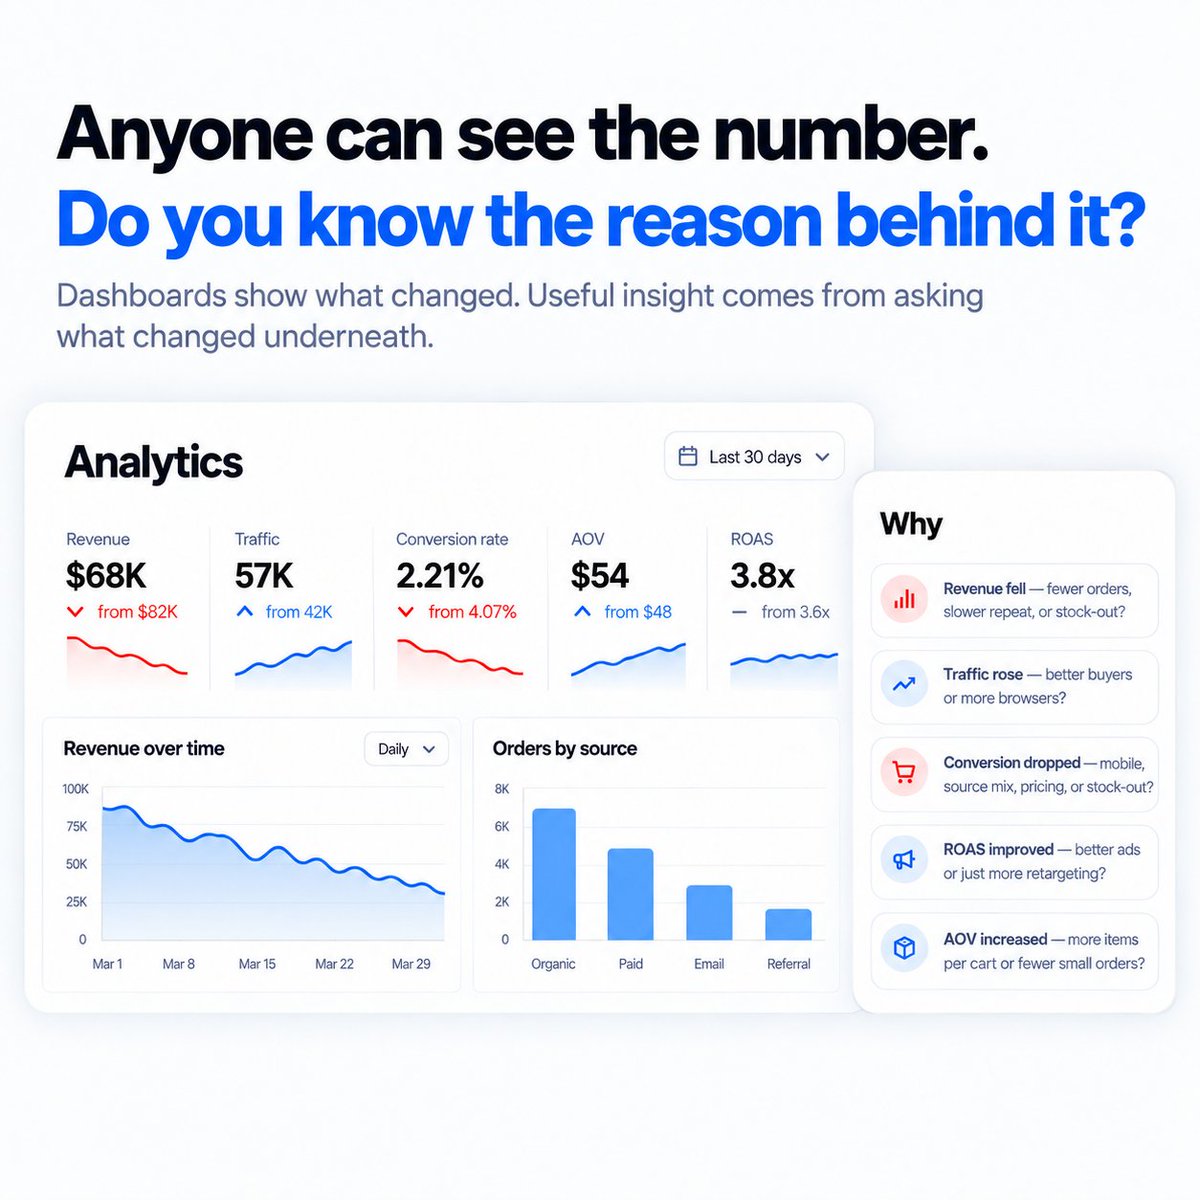
Anyone can see the number on a dashboard.
But do you really know the reason behind it?
Your Shopify dashboard can tell you:
Revenue dropped from $82K to $68K
Traffic increased from 42K to 57K visitors
Conversion rate fell from 4.07% to 2.21%
AOV improved from $48 to $54
ROAS still looks healthy at 3.8x
But the real question is usually one layer deeper.
- Revenue fell. Did fewer customers place orders, did repeat purchases slow, or was a bestseller out of stock?
- Traffic rose. Did those visitors come from a new source that brought browsers rather than buyers?
- Conversion dropped. Was it mobile, a new traffic source, a price change, or a stock-out on the bestseller?
- ROAS went up. Did ads get better, or did you cut prospecting and only retarget people who were buying anyway?
- AOV rose. More items per cart, or fewer small orders?
Every number has 3 or 4 possible reasons. The useful insight comes from looking at what changed underneath it.
The founders who grow fastest are the ones who ask "why" one more time.
Which number on your dashboard do you trust least?
Hello D2C founders 👋
Drop your Shopify store URL in the comments
I will run a free CRO Audit for you end to end
Then shows the friction that might be costing you sales
And I’ll reply with your complete store diagnostic report
Not all first purchases are equal. Some bring a customer back. Some are the last time you ever see them. And it's rarely the highest-revenue product that does the returning.
A brand assumed their hero product was their best entry point. It sold the most, so it must be pulling people in. When they looked at what those first-time buyers did next, the hero product was a dead end. People bought it once and left.
A smaller, cheaper product was the real gateway. Buyers who started there came back for a second order far more often, and went on to spend more over the following year.
The best first purchase isn't the one with the most revenue. It's the one that most reliably earns a second order.
This hides because you rank products by sales, not by what the customer does after. The first-order SKU and the repeat behaviour that follows it live in different places, so nobody connects them.
Pull it: group customers by their first product, then look at second-order rate and profit over the next few months for each group.
Once you know your gateway product, you know what to put in front of new customers and what to spend to acquire them there.
Which of your products actually brings people back?
Some catalogs have a product that looks like a winner, but may attract weak customers.
The revenue makes it look like a star. But the buyers it brings in could return more, repeat less, or only purchase when there is a discount.
On the sales chart, the product looks strong. On profit and retention, the story may be different.
This can happen when products are judged only by what they sell, not by the type of customer they bring in.
A heavily discounted entry product may attract deal-driven buyers who purchase once, return more often, and do not come back at full price.
The product may still do its job on revenue, but it may not create the kind of customer base the brand wants to grow.
The part that is hard to see from a sales report is the customer behavior created by each product.
Daymark helps connect product sales, discount use, returns, repeat purchase, and profit so brands can see which products bring in the strongest customers.
A useful check:
- Line up each product against the quality of the buyers it brings in.
- Look at repeat rate, return rate, discount dependence, and real profit over the following months.
- Do not judge only by the first order.
Some bestsellers may be building the business.
Some may be bringing in customers that are expensive to keep acquiring.
Bestseller by revenue and bestseller by customer quality are not always the same product.
So which of your products brings in the best customers, not just the most sales?
Some brands plan next month's buying off last month's total revenue.
Looks simple. But it quietly pushes you into the wrong order.
Revenue is one big number sitting on top of a lot of moving parts. Discount depth. Channel mix. New vs repeat buyers. Returns. Season. All rolled into one figure.
Forecast off that number and you drag all those distortions into your next buying cycle.
Big month, but it was really a sitewide sale doing the work? Forecast up from it and you over-order, because a chunk of that demand was the promo, not your baseline. Now your cash is stuck in stock.
Slow month, but it was one hero SKU going out of stock, not weak demand? Forecast down and you under-order, and choke the next cycle too.
A forecast is only as good as your view of what drove the last number.
Better things to look at:
- Demand by SKU, stockouts flagged
- Full-price vs promo sales
- New vs repeat buyers
Forecast from what drove the number, not just the number.
Getting inventory right usually isn't about guessing better. It's about seeing what actually happened before you place the next order.
Are you forecasting from real demand, or a revenue number that's hiding what caused it?
Some stores lose money on certain orders and never even realise it. Usually the reason is just geography.
You charge one flat shipping rate, or free shipping over some amount. But what it costs you to deliver changes a lot with distance. A metro order and a far-off pin-code order can cost very different amounts, and the customer pays the same for both.
On the distant ones, shipping eats most of your margin. Add a return or an RTO on that route and you're underwater on that order.
The reason nobody catches it: shipping gets averaged across all orders into one line on the P&L. So the bad zones just blend in and disappear.
Try this. Take your delivered orders, group them by region or pin-code cluster. Then line up real shipping cost and return rate against margin for each.
You'll probably find a few zones the rest of the country is basically carrying.
This doesn't mean stop serving them. It means knowing where they cost you more, instead of treating every region like the numbers are the same.
When did you last check which regions actually make you money?
Most brands set their product cost once and then never touch it again.
But your actual cost doesn't sit still. Freight gets pricier. Suppliers push their rates up. Currency moves around. Duties change.
So the cost sitting in your old margin sheet might be nothing like your real cost today.
Which means you could be pricing, discounting, or deciding your ad budget off a margin that isn't true anymore.
One brand was sure its hero product ran at a 60% margin. Once they added in the latest freight and currency costs, it was actually closer to 48%.
And they'd been discounting all quarter because they figured they had the room. Turns out they didn't.
It happens because that old cost is buried in a spreadsheet nobody opens, while orders and ad spend get checked every single day.
And it gets even harder to catch when your cost data lives in one system and your sales and marketing data live somewhere else entirely.
That's the gap Daymark closes. It connects the numbers across your business so you can see your real margin before you make a pricing, discounting or growth decisions.
Quick check you can do right now:
Pull your actual landed cost per unit for this month. Product cost, freight, duties, currency, all of it.
Then hold it up against the cost in your pricing sheet.
If there's a real gap between the two, the margins you're making decisions on are probably already out of date.
So when did you last update your actual cost per unit?
Most D2C brands spend most of their energy on one question:
How do we get more people to the store?
More Meta ads. More creators. More campaigns. More traffic.
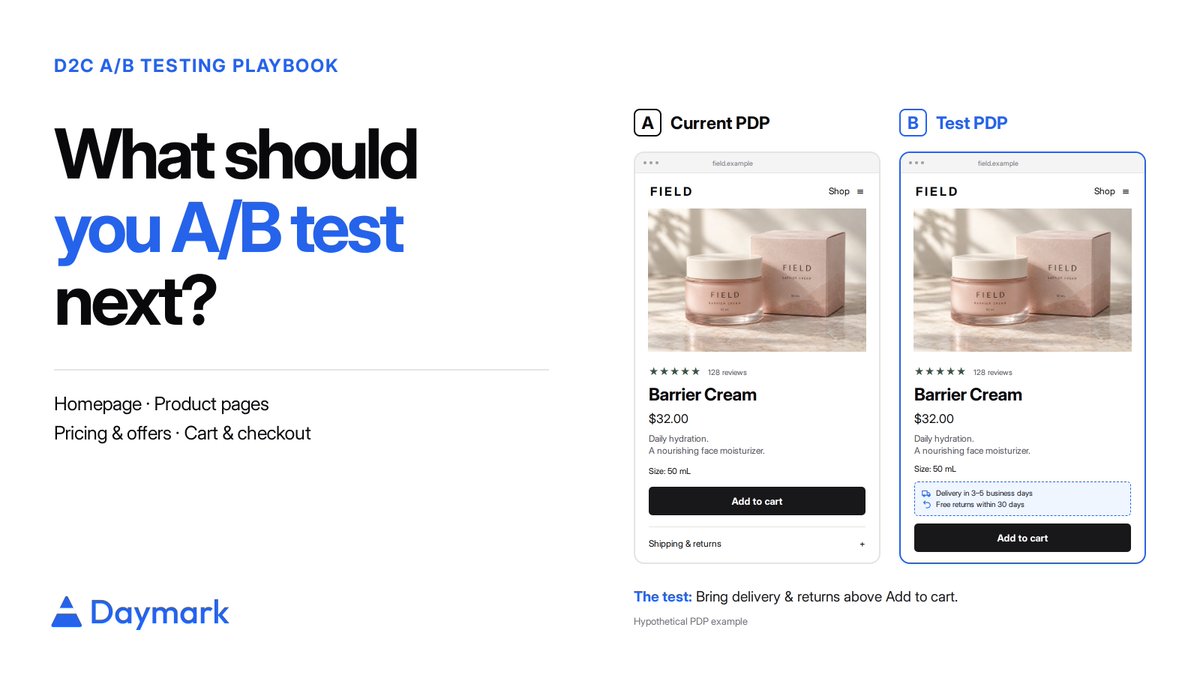
But there's another one worth sitting with: What's stopping the people already on your store from buying?
Because a lot of the time the problem isn't traffic. It's a bunch of small things scattered across the buying journey that quietly create doubt or friction.
A customer lands on your homepage. Can they figure out what you sell and why they should trust you, fast?
They open a product page. Can they actually see:
→ what they're getting
→ reviews and proof
→ expected delivery
→ return and replacement info
→ payment options
→ whether it's in stock
Then they add to cart. Is it clear:
→ what discount got applied
→ shipping cost
→ taxes or extra charges
→ the final amount they'll actually pay → what happens next in checkout
And then there's the stuff most teams almost never check:
→ Do the shipping and return-policy pages actually work?
→ Is important information buried too deep?
→ Is guest checkout obvious?
→ Are there pointless steps before payment?
→ Could the free-shipping threshold be nudging up basket size?
→ Is the mobile experience as clean as desktop?
On their own, each of these looks minor.
Put together, they're often the difference between a visitor who buys and one who quietly leaves.
Actually finding them means going through the homepage, product pages, cart, checkout, policy pages and navigation by hand, then working out which issues are worth fixing first.
And once you've found them, you still have to answer: what do we change, why does it matter, and what do we fix first?
We kept hearing this same problem from D2C teams, so we built a quick tool that runs a full conversion analysis of your store
Want one for your store? Drop your URL in the comments or DM it to me, and I'll send over the detailed report.
A founder got a weekly report with 14 metrics on it. ROAS, CAC, CTR, CPM, frequency, add-to-cart rate, CVR, AOV, sessions, revenue, new customers.
They stared at it and asked one thing: "Okay, so what do we actually change?"
Nobody had a real answer.
That's what happens when you mix up reporting with decision-making. Every number can be moving and the team still has no idea whether to scale, pause, fix a page or just wait it out.
More charts don't buy you more clarity. Usually the opposite.
Try this on any number in a report: if it moved, would you do anything differently? If not, it's not a metric. It's decoration.
Take a falling conversion rate. Matters completely differently if it's mobile checkout friction vs junky traffic vs your hero product out of stock vs bots padding sessions. The number's just the start. The decision's buried underneath.
Before you throw more budget at a channel that looks like it's working, run through these five. Most brands check one or two and go all in.
1. New vs returning. Is the channel actually finding new customers, or just reselling to people you already had?
2. Return rate by channel. A high-ROAS channel with a nasty return rate can net you less than a lower one that returns cleanly.
3. Repeat rate at 90 days. Customers who are cheap to acquire but never come back aren't actually cheap.
4. Contribution profit per order, after discounts, shipping, and returns. Revenue doesn't cut it here. You want profit.
5. Payback window. How long before the average customer from this channel turns profitable.
None of these show up in your ad dashboard by itself. Your ad platform sees spend and platform-side conversions. Returns, repeat rate, and real profit live in your store data. You get the full picture only when you put the two together.
So which of these five do you check before you scale?
The most expensive data problem isn't a wrong number. It's a right number you see too late to act on.
You scaled a channel in March. By June you find those customers barely stuck around. Budget's already gone.
Or you leaned on discounts all quarter. Weeks later the returns, RTOs and repeat data tell you that you bought a pile of deal-hunters, not loyal customers. Behaviour's already baked in.
The data was there the whole time. Spend, orders, refunds, RTOs and customer history just sat in different systems. And the answer kept moving as late costs and repeat orders trickled in.
That's the real tax. Not missing data. Decisions made on numbers that were only complete in hindsight.
The brands pulling away constantly reconcile what changed, update the affected cohorts, and surface the signal while the budget call is still open.
How many of your decisions this year got made before you could actually see the full customer economics?
Uncomfortable truth about Indian D2C: for a lot of brands, the first order loses money.
That's fine. What's not fine is treating payback like a number you calculate once and forget.
Say your first order is ₹700 in the red after ad spend, discounts, shipping, gateway fees, COD and returns.
That number won't hold still. It moves the second ad spend changes, an order becomes an RTO, or the customer buys again.
A weekly report catches up eventually. By then you've already scaled the wrong channel.
The question isn't your CAC. It's whether each cohort is crawling toward profit as returns and repeat orders land.
Three numbers you need live:
- Contribution profit on the first order, after every cost
- % of each cohort that comes back for a second order
- When each cohort finally pays back what it cost to acquire
Which means constantly reconciling spend, orders, refunds, RTOs and repeats, then re-updating cohorts every time the data moves.
First order loses money + payback model notices too late = not a growth engine.
Just a leak on a reporting schedule. Is your payback window a number on a timer, or one you can trust while the decision is still open?
Your MRR can go up every single month and the business can still be quietly falling apart.
New signups and upsells come in a little higher than the cancellations and downgrades, so the total keeps climbing and everyone feels good.
Problem is, your newer subscribers might be bailing way faster than the older ones. The blended number just doesn't show it.
Usually the giveaway is people cancelling right after that first renewal.
Go pull your last few months of subscribers by signup date and check how many are still around at the same point. If that keeps dropping, growth is just covering for a hole that gets worse over time.
Most brands find this out way too late. When did you catch yours?