$SPCX
SpaceX IPO lists in 3 days (June 9) ..
$75 billion raise.
$1.75 trillion valuation. The largest IPO in history.
And they're giving 30% of shares to retail investors triple the historical norm.
To me this is no generosity... so here's likely what it means 🧵
The USD is entering a powerhouse phase! 👑💵
We’ve officially hit a Golden Cross (50DMA > 200DMA) right as the Greenback completes its Wyckoff Accumulation phase. When this technical breakout aligns with the "markup" phase of a Wyckoff cycle, history shows the potential for 25% gains over the next 1–2 years. 📈
Spring is over. The rally is on. 🚀
#USD #Forex #Wyckoff #GoldenCross #Macro #TradingSignals
We currently have variables present that are similar to every single major crash over the past 100 years.
1929 - major market manipulation/extraction, extreme use of margin and financial degeneracy into rising rates (expect rates to rise now bc incoming energy and food inflation.)
1974 - oil crisis, war in middle east, inflation
2000 to 2002 - huge bubble on emerging technology that no one quite understands yet (internet/AI), excessive use of margin and financial degeneracy, war in middle east, rising oil prices.
2008 - complex financial derivatives and excessive margin, subprime loans
2022 - not as large of a crash but was caused by war-driven inflation in energy + food leading to higher rates.
2026 - bubble in AI (+ very heavy concentration in AI sector), war in middle east, oil crisis, inflation in energy and food is going to go parabolic (much worse than 2022), credit markets are showing cracks including private credit, student loans, and car market. Financial degeneracy like lending people money to pay for burritos, memecoins, normalization of gambling via polymarket and sports betting. Excessive use of margin, perps, 0dte options, decentralized lending protocols, etc.
The news cycle is so cooked lately—it’s 90% noise and half the time I can’t even tell what actually matters for the charts.
I’ve been using @NeonQuantBot 's "/news" function and it’s sick. Takes out the fluff and color-codes the sentiment:
🟢 Bullish
🟡 Neutral
🔴 Bearish
Simplifies data overload for news to help me apply it to my daily trades
#Crypto #Trading #NeonQuant
Is history about to repeat for $BRENT? 🛢️📈
Looking at the Brent Crude monthly chart, a pattern is emerging that’s impossible to ignore. Every time we’ve seen a bullish MACD cross on this timeframe, the price hasn't just rallied—it has at least doubled per barrel.
With the current monthly signal firming up, if this trend holds, we aren't just looking at triple digits... we’re talking a peak of ~$140/barrel. 🚀
Energy bulls, is the macro setup too big to fail? ⛽️💎 #Oil #BrentCrude #MACD #TradingSignals #Macro #OOTT
Our AI overlords recommend reading our first blog to learn a bit more about us and our quest in helping you trade better than the professionals
https://t.co/SzdF34iRtW
NeonQuantBot is live!
Crypto price forecasting, sentiment analysis, and AI confidence scoring - directly in Telegram.
Built for traders who want fast reads on market trends with AI directional ratings to take your trading to a new level.
https://t.co/Bclx2zQEvk
For more👇
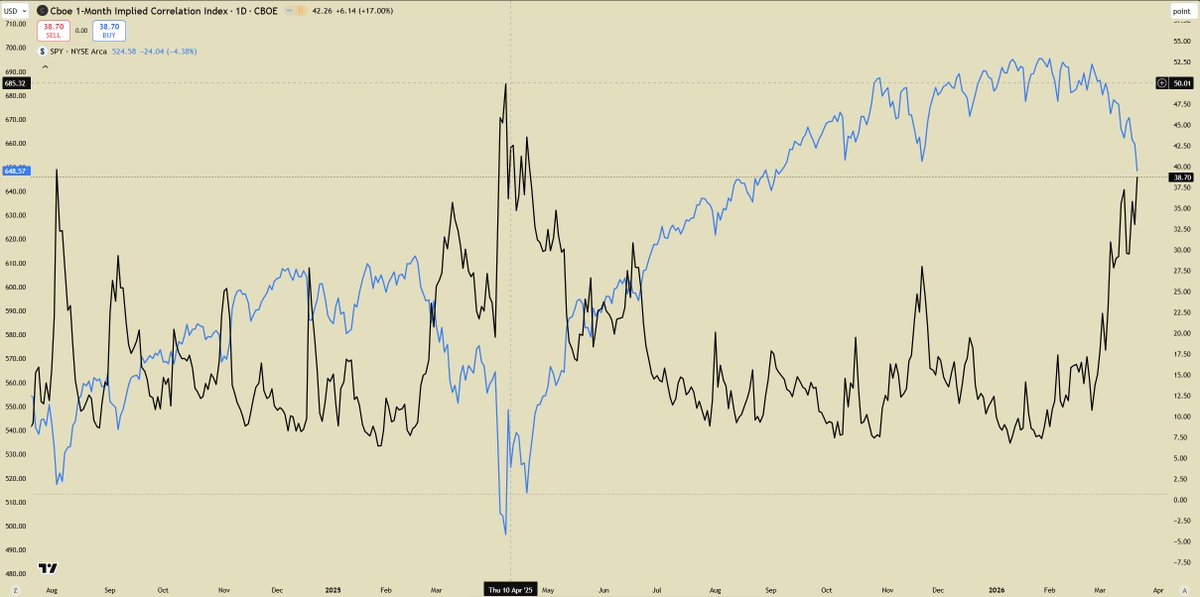
"Look at the divergence here. 📉📈
As $SPY drops, the $COR1M spikes almost perfectly in the opposite direction. This is exactly what I mean when I say 'diversification is a myth' during a crash. When that correlation line goes vertical, every 'safe' stock in your portfolio starts moving like a single, falling brick. The math doesn't lie.
The Big Lie: Why 'Diversification' Is Useless Without the COR1M Chart 🧵
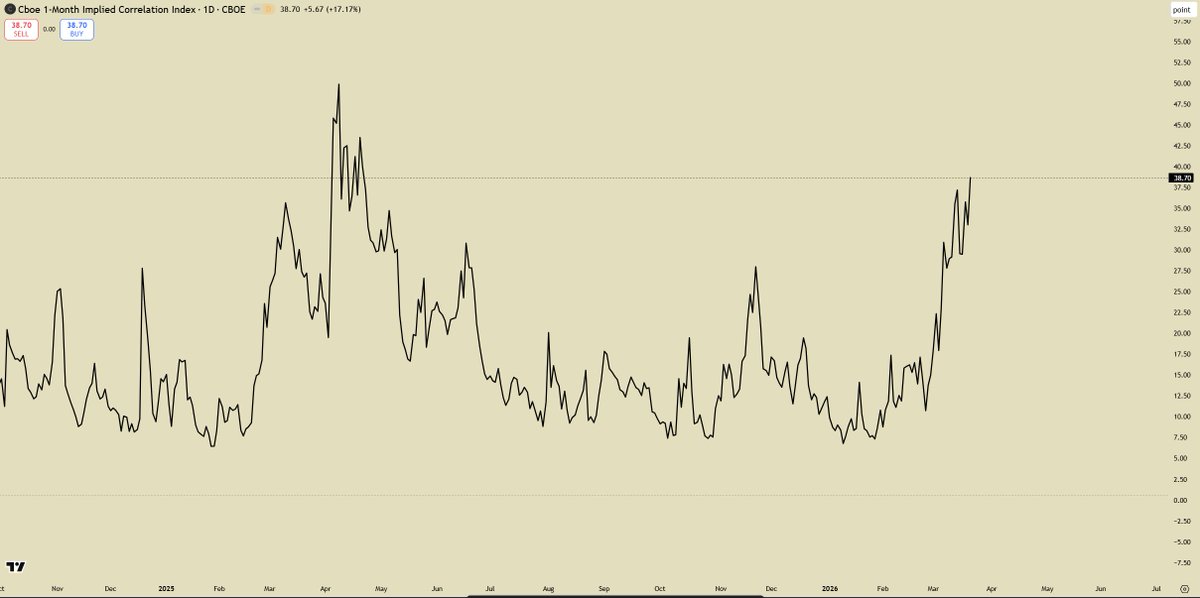
Ever wonder why your "diversified" portfolio still tanked during the last dip? 📉
It’s because you weren't watching the 1-Month Implied Correlation Index (COR1M).
Most traders focus on the VIX, but COR1M is the "under-the-hood" gauge of market health. It tells you if stocks are acting like a unified herd or individual players.
Why it’s your secret weapon:
Correlation Spiking? 🚨 Red alert. Diversification is failing. Stocks are moving in lockstep, usually signaling a macro "sell everything" event.
Correlation Crashing? 📈 Stock-picker's paradise. Individual company fundamentals actually matter again.
If you aren't tracking how "glued together" the S&P 500 is, you’re trading with a blindfold on. Stop guessing and start watching the dispersion.
#TradingTips #Stocks #VIX #COR1M #MarketAlpha
Structure Break Confirmed: $BTC vs $XAU 📊
Daily: Clear Break of Market Structure (BMS) to the upside.
Following up on my post from 2 weeks ago—we’ve officially confirmed the daily market structure break. While Gold struggles with the $5k psychological level, Bitcoin is carving a path back toward its previous highs.
Scarcity is winning. The bottom is in. 📈🚀 #Bitcoin #Gold #Macro
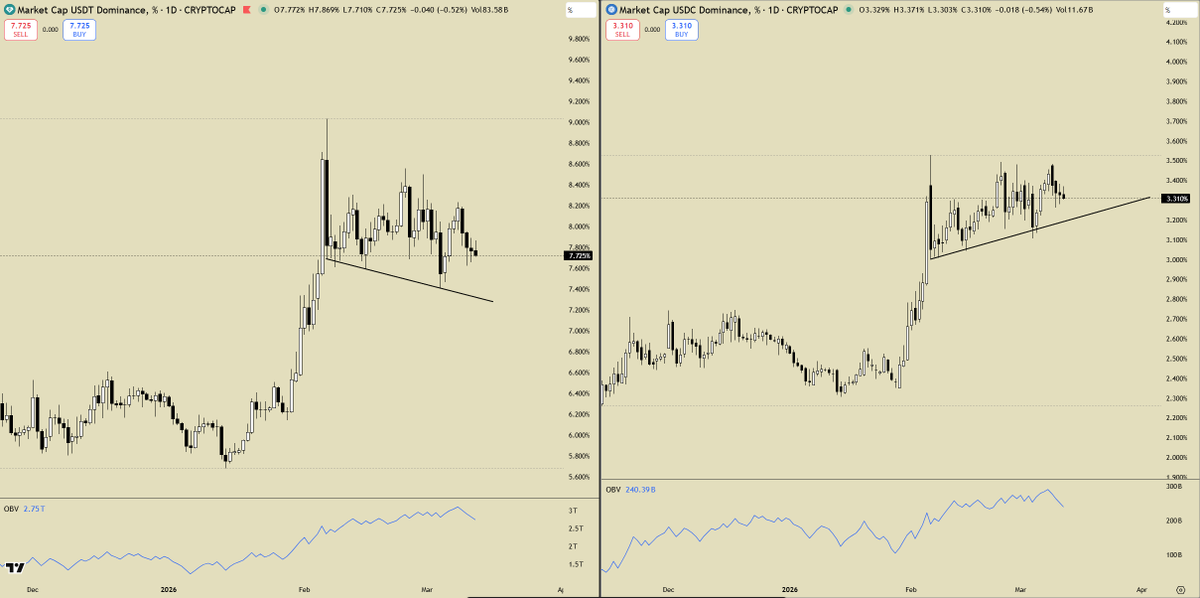
Keep a close eye on Stablecoin Dominance. 📉
USDT is showing a clear bearish structure with lower highs and lower lows, yet USDC is diverging. We need to see this entire metric push lower—it’s the ultimate signal that sidelined capital is finally rotating into $BTC and Alts. 🚀
#Crypto #Trading #Bitcoin
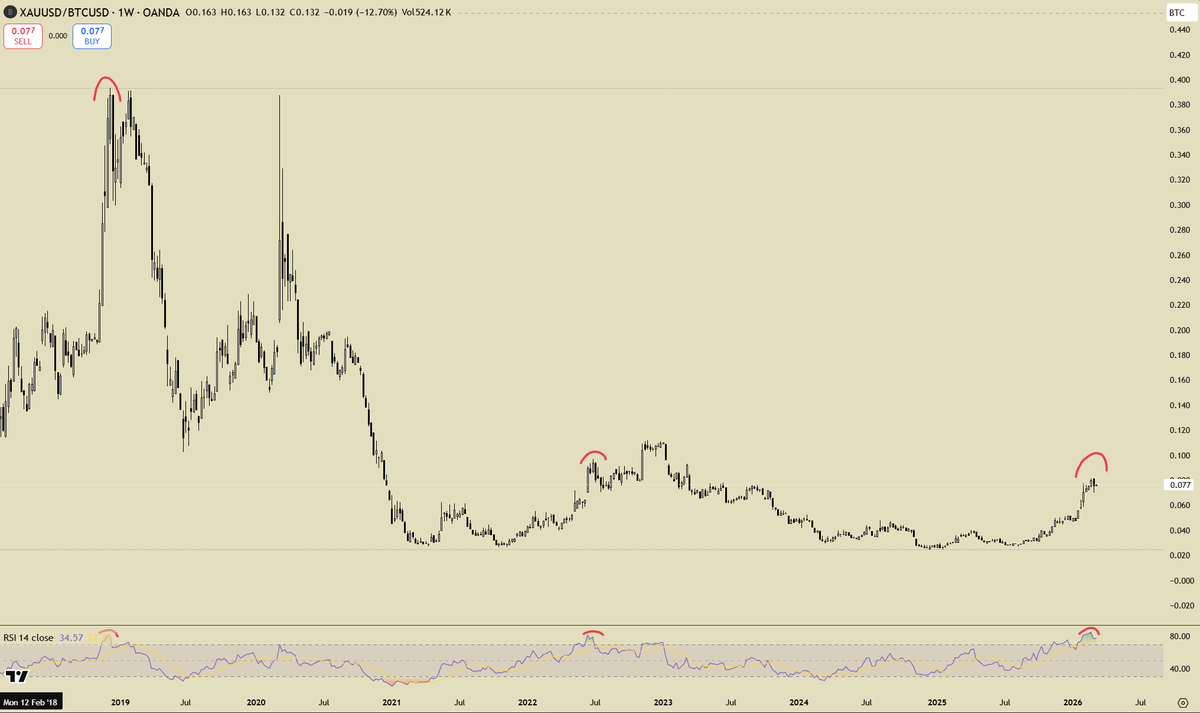
📉 Gold vs. BTC: The Weekly Showdown 📉
Technicals: Weekly overbought (History says $BTC wins soon). Macro: Geopolitical chaos (History says $GOLD wins).
Last 3 times we hit this level, Gold lost its lead. What's the play this time?
#Crypto#Finance#Investing
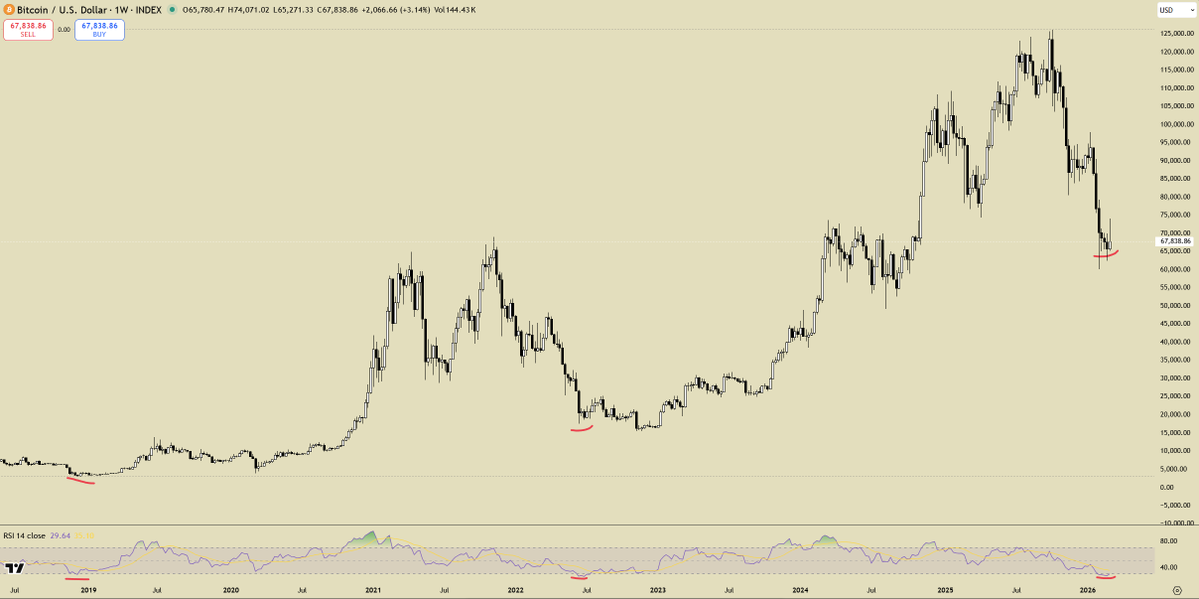
🚨 RARE BTC SIGNAL ALERT 🚨
$BTC Weekly RSI is officially oversold.
This has happened only 3 other times in Bitcoin’s charted history. Every single time, the bottom was right around the corner.
History doesn't always repeat, but it often rhymes.
Are you:
A) Buying the blood 🩸
B) Waiting for lower 📉