We spend a lot of time in R&D, but we are more!
We have updated our logo to reflect how our products, like @visu_ai, are designed to help humans do their job better, through suggestions and explanations. The new logo suggests a brain and a text bubble.
#analytics#datascience
The following data science plots are all static images, since that is all LinkedIn allows. But all these are web based interactive charts based on #plotly for #python. They can be used in #jupyternotebook, #pyqt, #pyside, #flask, #django or plain python s…https://t.co/6OZMRs1XpN
When people first encounter @dataclass or NamedTuple in #Python, it is common for people to believe that the type annotations will generate type checks or type coercions.
@ dataclass
class Person:
name: str
age: int
Person('Alice', '30')
1/
@IgniteMindz The andromeda strain. Published in 1969, would become his first best seller. As it was written before that, he didnt have any pressure to deliver or to dumb science down & such.
Would also be made in a movie in 1971, using pre CGI techniques, such as projectors for holographs
Made some progress on the bit crusher pedal prototype. I have the control knobs for the sample rate & the bit depth. Also have the overdrive stage. I am far from done, haven't added LED, bypass, & quite a few more things. It's already pretty effective on my Sequential drumtraks
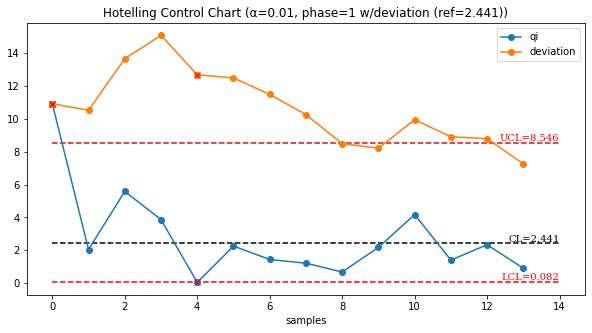
So how can you test this feature? Install Hotelling and dask and then in your #python script or notebook:
from hotelling.helpers import load_df
From hotelling.stats import hotelling_t2
x = load_df("pop_a_*.csv",dask=True)
Load y similarly then you can call:
hotelling_t2(x,y)
Along with documentation, including example notebooks at:
https://t.co/armdy94Mrg
These notebook examples even cover the brand new deviation feature (cumulative sum chart).
#datascience#dataquality#dataviz#controlcharts
While at it, not only did we update @stemgraphic documentation, but we've also pushed the latest documentation for Hotelling, the python package for T2 tests and uni/multivariate control (run) charts:
https://t.co/armdy94Mrg
#quality#datascience#eda#statistics
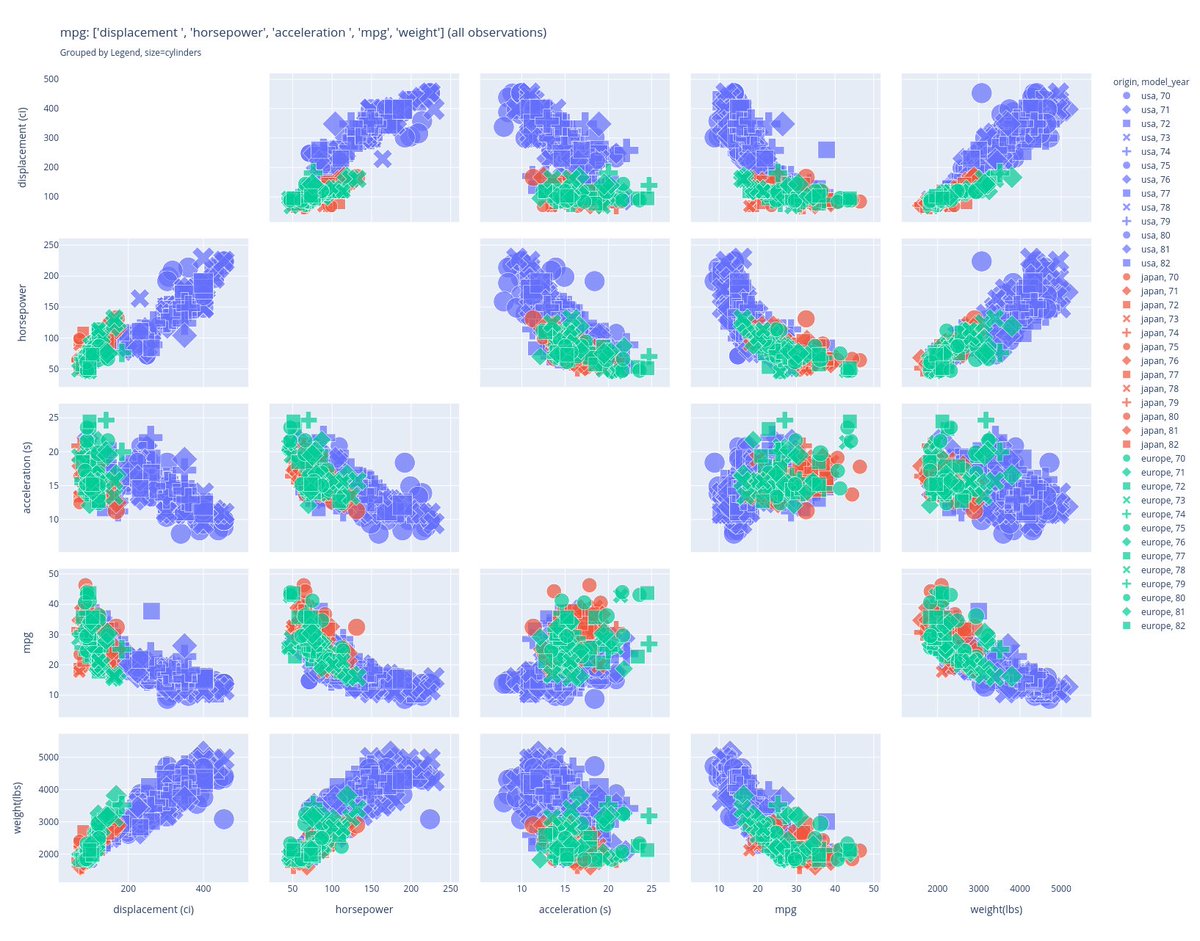
Another example of automated title on a fairly detailed plot, a scatter graph matrix. Title includes the dataframe name, the selected variables (without units, unlike the x and y axis), references the legend, the size that is not on the legend.
Good news? PR merged in #pandasGUi
@nicolaskruchten This one is not interactive, but one could easily see how clicking on the labels would show/ hide individual curves.
See scikit rf https://t.co/jluS1cE10j
We’ve (@f_dion) used those quite a bit i would imagine hover would give you the real and imaginary part.
📢 Plotly.js v2.0 is coming soon, after 5 years and 177 releases since v1.0! 🎉Check out the pre-release announcement to find out what's changing and how you can kick the tires on the Release Candidate 🚀 https://t.co/ePlYS18YaC
Excel works, until it doesn't. With scheduled checks, @visu_ai (https://t.co/TNSt47Stdj) would have caught this issue (spelled out, in this case), and many more. Data quality matters. Get in touch to learn more.
#datamanagement#d…https://t.co/kVk5eDmpIt https://t.co/Q8MO3yOgwp
If you've started using Python 3.8:
- did you know about the walrus operator? ( := aka assignment expressions or pep 572)
- how often do you use it?
- what do you think of it?
I'm actually growing fond of it, after doubting it in…https://t.co/95GvqUeKBp https://t.co/SAr11DKIIT
50 years ago, John Tukey introduced Exploratory Data Analysis. Imagine walking into his classroom in 1970 to witness history in the making: beyond his philosophy of EDA, he introduced several plots, including the box plot, one of the most popular statisti…https://t.co/1teOAx0kii