I am still bullish on #crypto#alts and expecting continuation of an uptrend. My updated next targets for $btc are 169k or 250k, and a final $400k+ cycle top.
https://t.co/0wwvzkJG7s
https://t.co/OUKx75FutH 🧵👇🏿
$btc Time to finally update my pinned post! We have some more clarity 10 months later! The red and gray measured moves are still in play. My Macro targets are still the same-137k-150k for next top, then 200k, then 300k+ for the final cycle top.🧵👇🏿
$XVG
POWER OF 3
I didn't expect the recent drop, but for now it looks like a bear trap, as long as price doesn't continue breaking below the "manipulation" range.
the fact that price is Holding this range before a downtrend breakout - looks bullish.
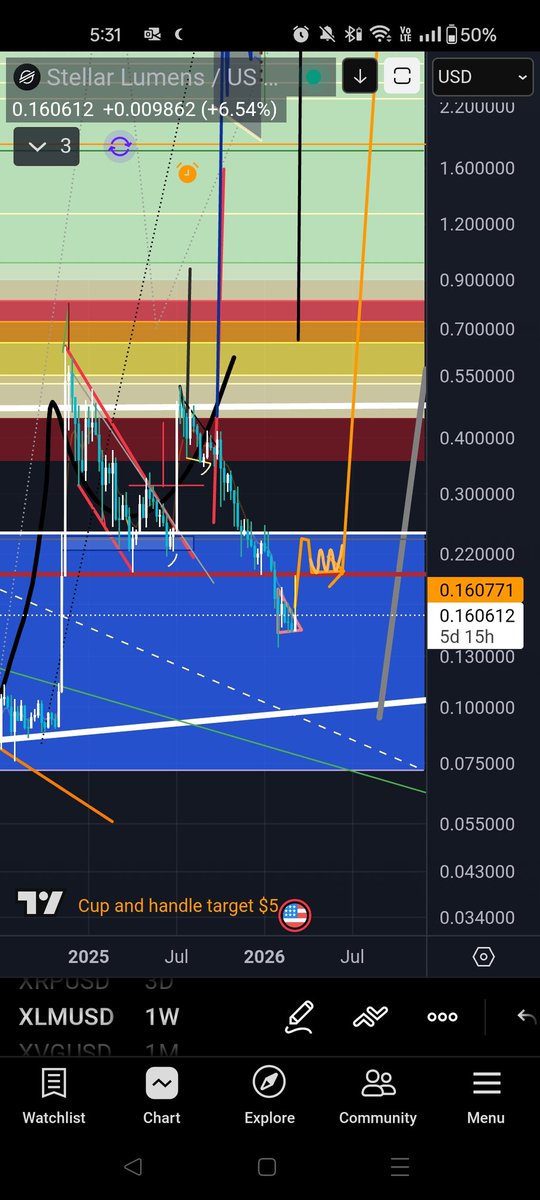
I did decide to spot long $xrp here a few days ago. It's near the bottom of a range and maintaining 3D bullish RSI divergence. Looking for it to spike up back into the previous range like $xlm, but with more candles (not in two god candles like Stellar did).
$xlm is my biggest spot bag after $xvg, so I'm glad it's finally back into the previous range. Would love to see this god candle continue above that Nov 2024 high!🤞🏿
$btc still looking for a very bullish late March. At minimum, maybe something like this, where we can at least dig ourselves out of this hole and get back to the previous range $xlm
$xvg Hoping these small double bottoms on multiple assets play out $btc $xrp RSI has reset, and Verge is holding the 8/12/1D bullish RSI divergence for now
$btc $xvg Sort of like how we entered the diamond, I'm looking for price to go down in "threes" after encountering turbulence at the orange daily 5 EMA. There's two major blocks where candle closes have clustered (4th image)
https://t.co/sJUu5GrOGO
$xvg. Scalp short is going well and now risk free at break even. Price broke below what looks like a double top (or descending triangle) on the daily, and is currently rejecting from the neckline.
Waiting to enter a large swing leveraged long if we hit .0037 (already in spot). 🧵
$xvg Not price giving them jukes, doing a false breakout before going to the weekly wick fill anyway...! 😅Oh well. I'm almost not surprised- this cycle is really teaching about patience! That 1D RSI 30 retest/3D div is finally here, but price def needs to reverse to preserve it!
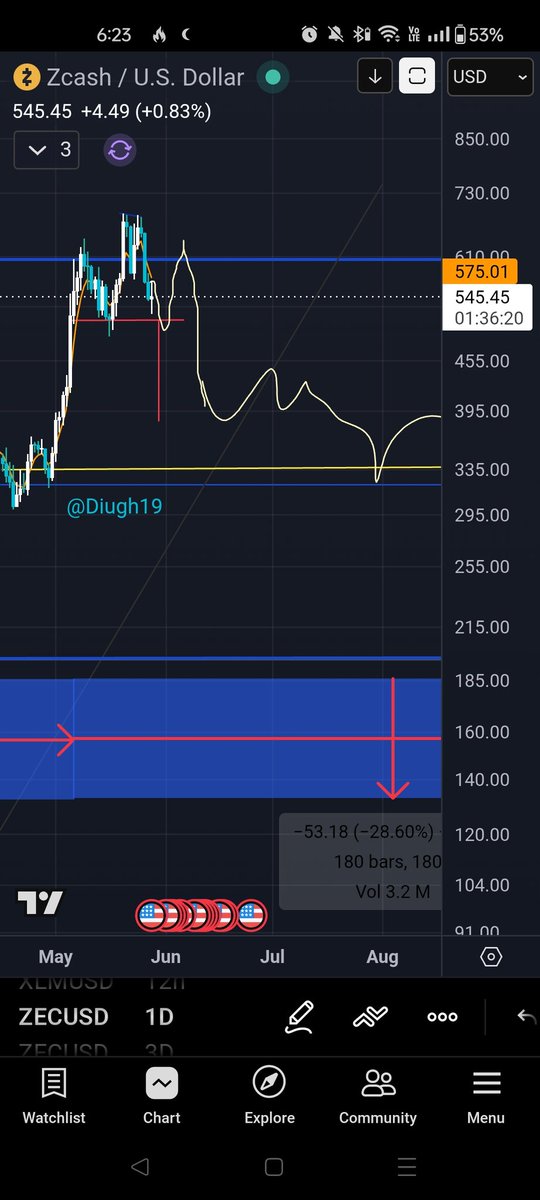
This sketch was pretty on point, price even made the 2nd shoulder in less time than I thought. I'm considering raising my TP to just the measured move of the head and shoulder instead of holding until the wick fill at 334. Just a correction now, but I expect $zec to hold up well!
$zec Using 2017 $xlm as a model (time-wise), I am expecting price to correct from this area. In line with @temporoshq teachings, I also experimented with mapping 180° on the chart from the Nov 6 2025 high-May 6 was the 180th day. I think we reach a new high in Q4 on the 360°.
$btc $zec Scalp long wick fill is done, and waiting to see if we get $142, where I'll go heavy on spot and also open a swing long. Alternatively, if I don't get my wick fill, I'll enter on a blue Bbwp line (early volatility signal before a range break)
https://t.co/tEM0fMSnFR 🧵
$zec Short idea is looking good for now. Price also confirmed a 3D ttw reversal at range top. It's a swing, so I don't expect my TP at 334 to hit until late July/Early August. This is if price can keep in this upper quadrant without dropping too much (staying above 300).
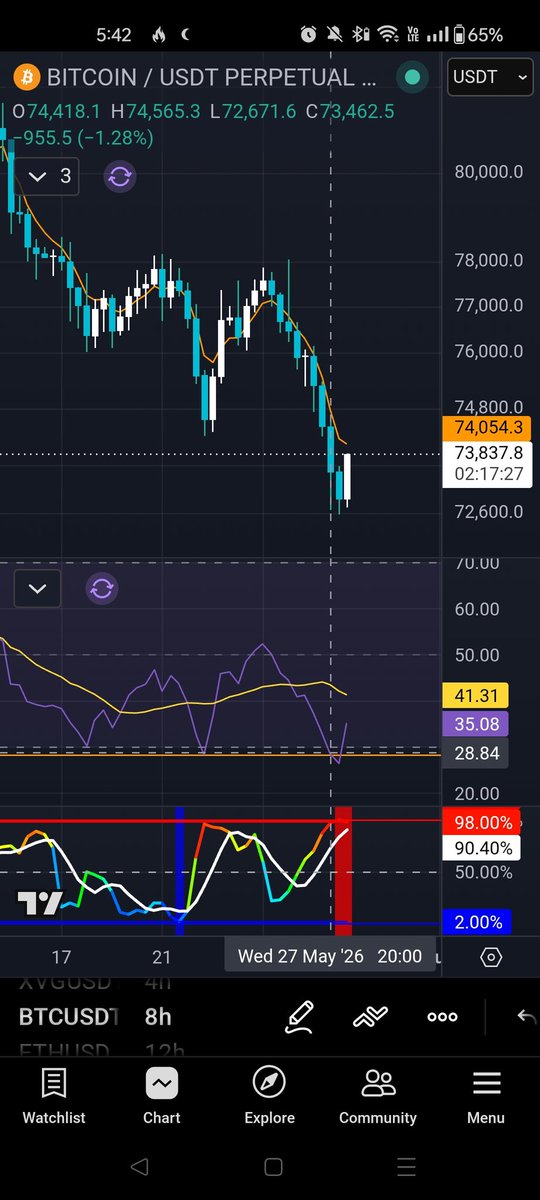
$btc the short version of this technique hit several times during the run up. I traded the first two, but didn't actively trade the last signal (paying attention to other coins)-of course the last one got a full 10% move! I'd love to learn how to automate something like this.
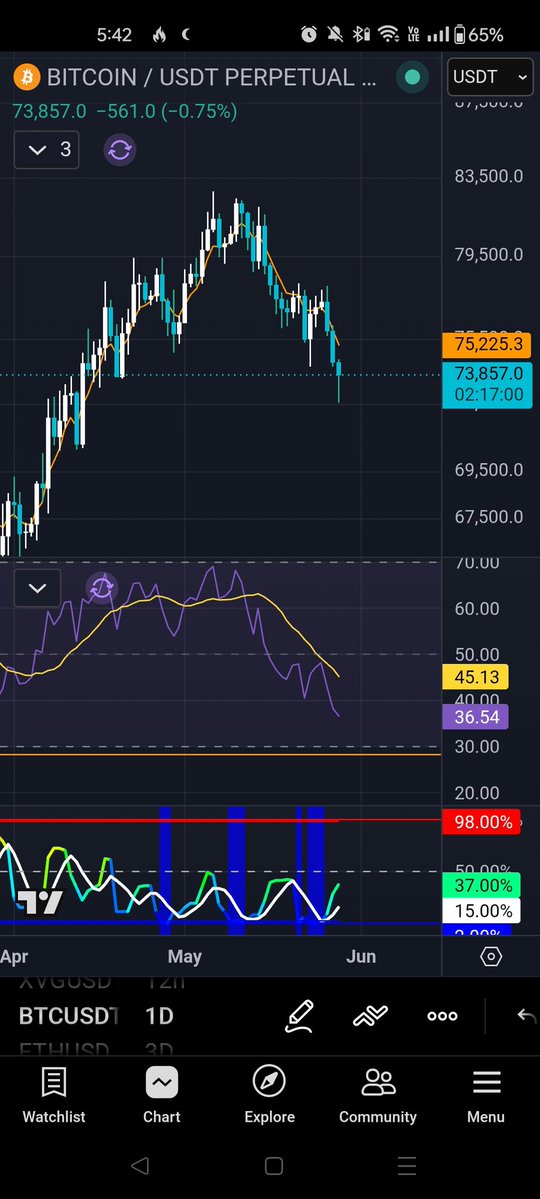
$btc One of my alerts hit for this RSI divergence technique, so I am currently long from the 8pm 8hr candle from May 27. Bitty played out a little head and shoulder, but perhaps it has a chance to recover without dropping too low. TPs are split at 77k and 80k.
$btc backtesting 8hr RSI (below 30) divergences since 2021, and I found that longs actually have over an 80% hit rate for a 5-10% rally minimum! These only happen a few times a year on this timeframe, but not a bad RR. I also saw this same 24-min RSI structure back in Jan'2024.🧵
$XVG Update
A higher low has formed for the first time after a retest of support, and the price is now attempting to break out of the bearish trend. Once a higher high is confirmed and the breakout occurs, the first target will be $0.0090 area.
https://t.co/Amy1xl4lB4
Trading is majority a solo game
I've learned over the years that I'm only competing against myself
If you are competing with others, you are already losing to the ones who don't
How many times have I bailed out or second guessed myself because someone else said something snarky? Too many times than I care to admit 😅
So if you want to get better at trading? Don't bother others in their trades so that YOU are not bothered
Simply just stop caring what others do so that you can focus on what YOU are doing
$BTC doesn't make a lot of sense to overlay fractals from the top. Markets are dynamic, macro is different. If you look at the last 3M, this fractal is actually a decent match but towards the END of the range, with a close analog of the bottoming process with an inmediate exit.