📣Join us for an insightful webinar with Ray Rike as he dives into the complexities of usage-based pricing models and how it impacts SaaS metrics and revenue forecasting.
📆 Aug 21, 2024
⏰ 9 AM, PT
📍 Register here: https://t.co/uYPyfxFR6V
#SaaS#Webinar#B2BSaaS#Finance
🙌Spring 2024 @G2dotcom badges are out, and Drivetrain was named a Leader in Financial Analysis!
This is truly a testament to the trust our customers have in us ❤️
#Finances#fpna#SaaS
🧐 "Forecasting is the art of saying what will happen, and then explaining why it didn't!" 🙄
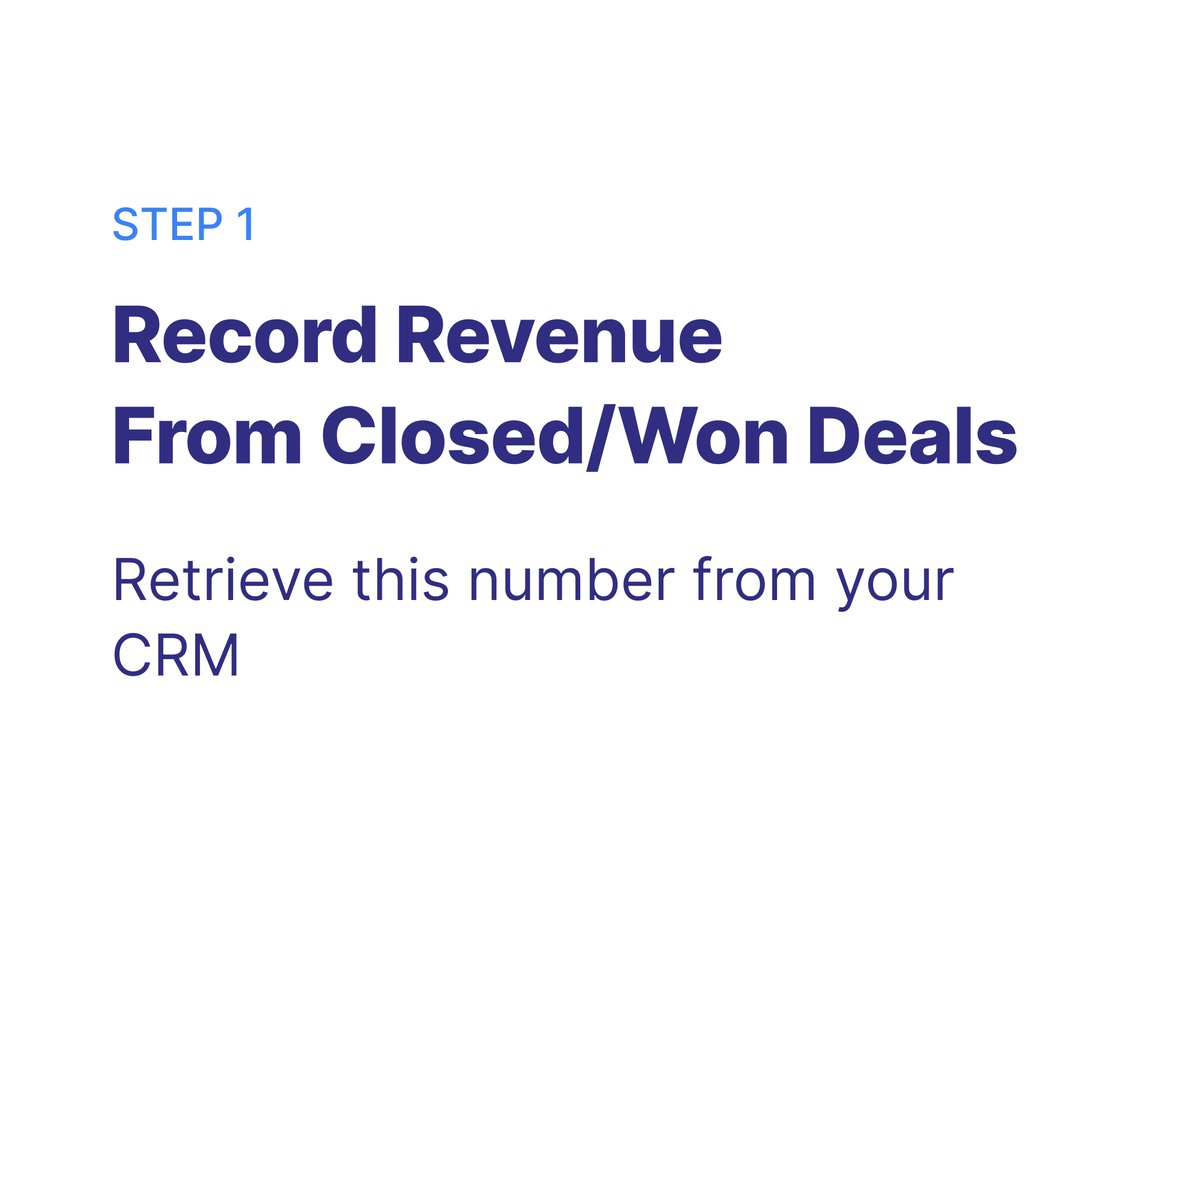
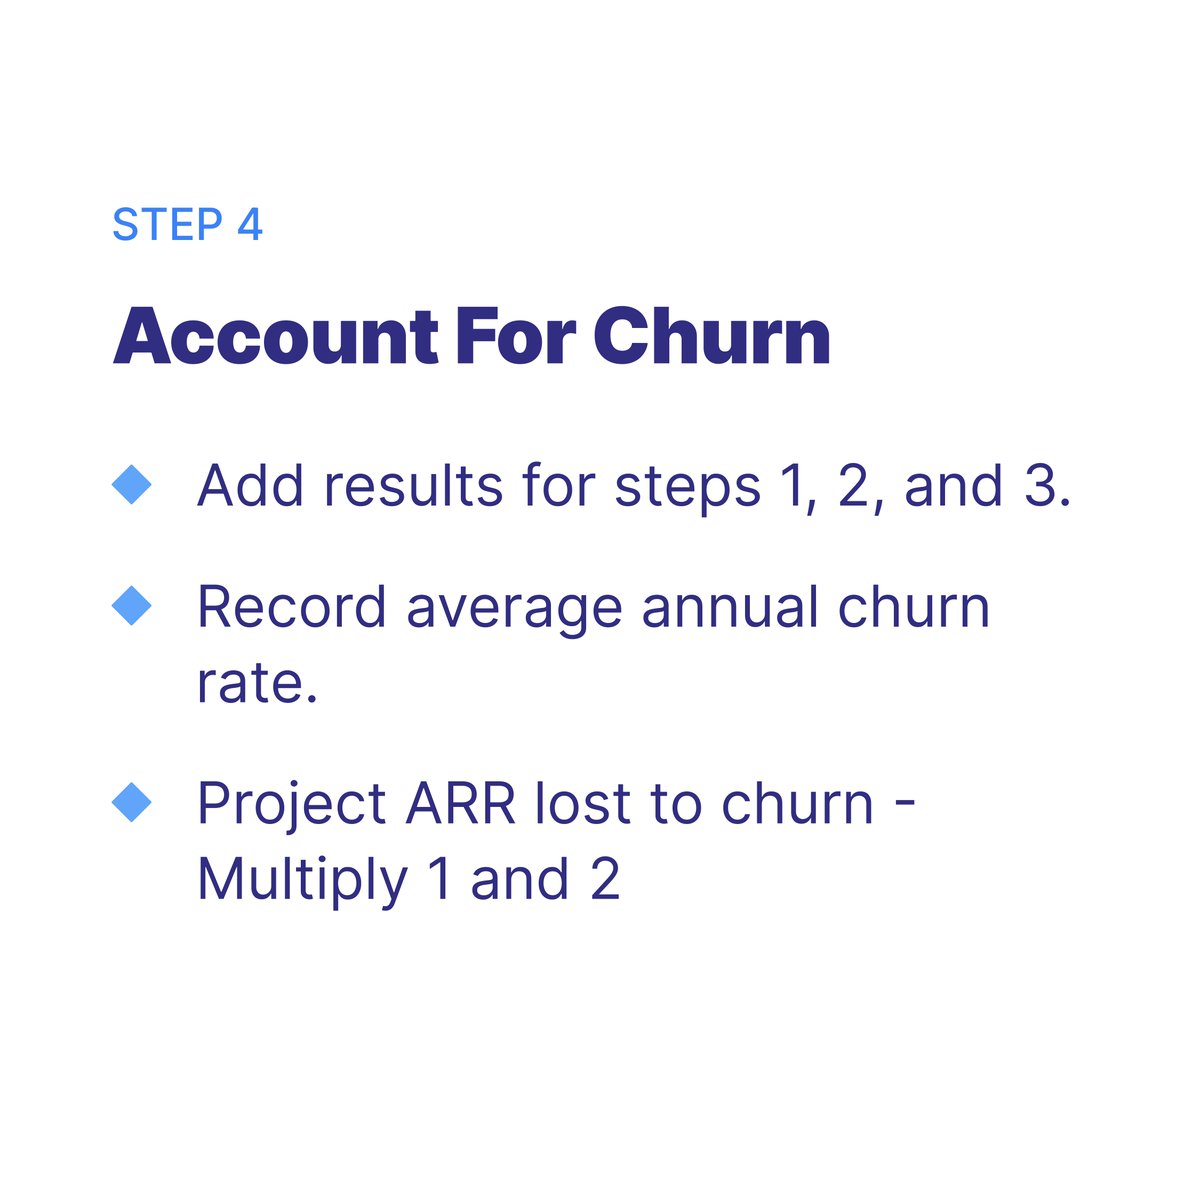
🎯 How can you accurately predict your year-end ARR?
#Finance#CFO
💡“Why a $10M ARR company can be more valuable than one a $100M revenue company”
Gross Margin puts an upper limit on your company’s profitability.
The higher your gross margin, the more profitable your business model. 📈📈
Download our Cheatsheet here: https://t.co/Zx0VtNk3IC
@parkergilbert21 , CEO of @numeric_io, has put out an insightful blog that delves into the fascinating dynamics between Accounting and FP&A teams.
Here are a few thoughts from our Director of Strategic Finance, @k_kappelhoff, on this!
Link to blog:https://t.co/96NbpGwSPX
Revolutionizing FP&A!
At Drivetrain, we're committed to making FP&A as Powerful and Simple as possible for our users.
Now Drivetrain with more Excel familiarity!
#Finance#excel
⏳ Streamlining your financial reporting process takes your entire time?
Know how @whatfix reduced this 7+days’ work to just a single day!
#Finance#SaaS
WEBINAR ALERT! 🚨
@TheSaaSCFO discusses his viewpoints on the finance software landscape with @k_kappelhoff from the 5th Annual SaaS Tech Stack Survey.
Find out the best way to progress your SaaS finance tech stack from $1M ARR to $50M+ ARR
RSVP now: https://t.co/RFi1G5yygF
🚀 Exciting Announcement for all FP&A and Finance Professionals! 🚀
Ever wondered if your FP&A process is truly equipped to scale from $1M to $50M+ ARR?
It's time to get those answers!
💡 How do I know if my Q factor is good (Benchmarks)?
It can vary by ACV, region, etc.
With that said, for companies with an ACV of $5 to $25K:
🔴 <2
🟡 2-3
🟢 3-5
Check how Q Factor improves capital efficiency here:
https://t.co/WqhIeWrg7u
Sales Quota per Rep = Qfactor x OTE
✍️ How to use Q factor ?
Let's say you have 2 sales rep:
• Rep1: $100K OTE and $500K Quota
• Rep2: $200K OTE and $500K Quota
Ceteris paribus, if both reps hit their quotas, is it fair to pay Rep 2 twice that of Rep1?
Thus, the Q Factor has now brought an apples-to-apples comparison between the reps, which can be extended to teams too. It can also ensure more equitable compensation to help you retain your best reps.
The Q factor metric hits the bullseye here!
What's Q Factor?
A proven way to set optimized quotas for your GTM teams.
Step 1: Calculate your baseline Q factor
Q factor (baseline) = (Last FY ARR / Fully loaded Payroll of team )
Step 2: Multiply the Rep’s OTE
Capital Efficient Growth.
The rallying cry in FY24.
But, how do we drive growth while cutting costs?
With many revenue and capital efficiency metrics out there, no single metric is tactically useful:
1. Cut costs
2. Identify growth areas
3. Optimize resource allocation
🌟Thrilled to be featured in Ben Murray's SaaS Tech Stack Report for SaaS Metrics Reporting!
At Drivetrain, we simplify forecasting and data integration from multiple systems to create custom SaaS metrics in seconds.
Modern FP&A software - Simple yet Powerful!
#Finance#SaaS
You know that I talk a lot about SaaS metrics 📊
But how do we report our SaaS metrics? I get this question a lot in my SaaS Metrics Foundation course (no surprise 😯)
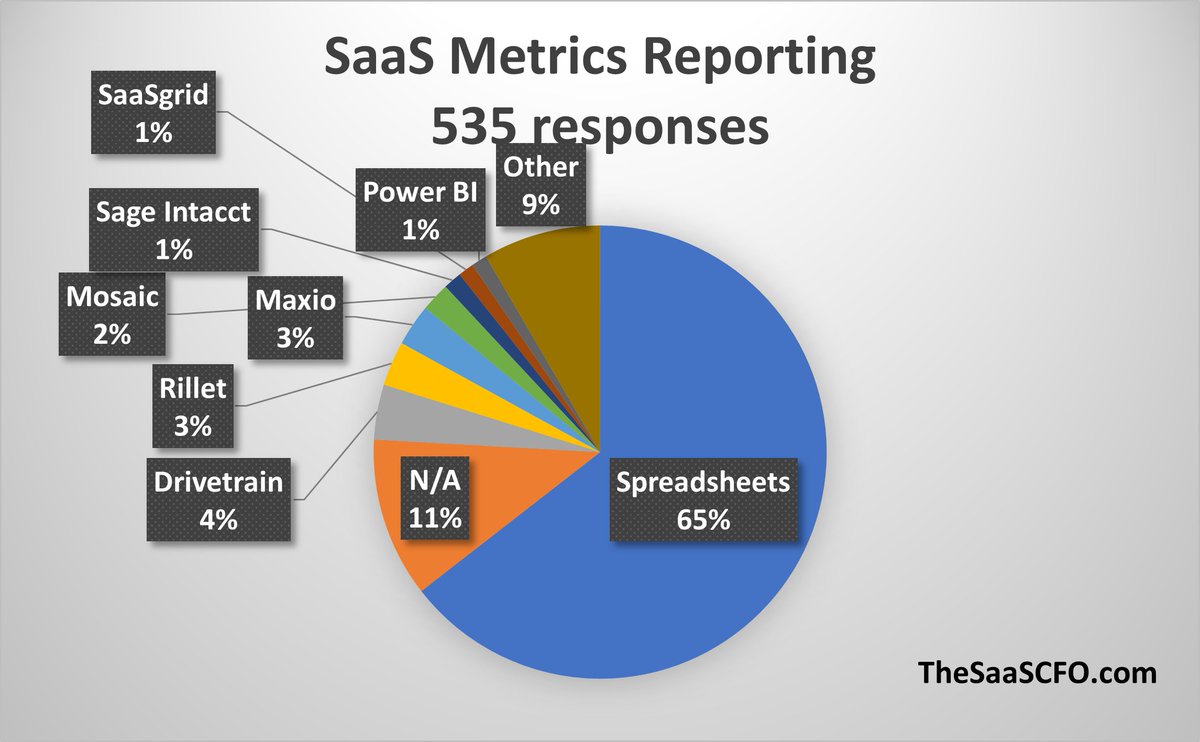
So new to my 5th Annual SaaS Tech Stack Report...SaaS Metrics Reporting!
✅ SaaS Metrics Reporting Software Results
This is the first year for this question. I live and breathe SaaS metrics, so it’s no surprise to see spreadsheets dominate this new category. We have to pull data from many sources to calculate my 5 Pillar SaaS Metrics Framework.
I pull data from 4 key sources. Check out The SaaS Academy for lessons on this.
There were 41 solutions named in this category. The top 5 solutions own only 13% market share.
In the chart below, we have a mix of ERP, FP&A, and analytics solutions. My app didn't crack the chart (always be marketing!).
This is an interesting category. You may have solutions that just report the metrics and you may have solutions that calculate and report them.
My app reports, communicates, and benchmarks the metrics. Pre-populated with the best benchmarks in the business from @rayrike.
If you'd like to try my SaaS metrics dashboard, please comment below.