The Pentagon ignored drone warfare lessons from Ukraine, writes @shustry. US soldiers died as a result. Worse: "Several of the officers who tried to raise the alarm about Iranian Shaheds have since been fired or forced into early retirement."
https://t.co/VOhDnPpf8M
Were you prepared for yesterday’s downside? My channel subscribers saw me building the short and taking profits as the puts paid after hours.
My opening SPX view was wrong. I expected an early recovery before looking for an index short later in the session. When that recovery failed to develop, I adjusted.
The recovery never developed as I wanted. Price struggled at the reclaim level, and even falling volatility wasn't producing much upside. That mattered.
I had already been looking for a tactical short into month-end and the mid-terms. Later in the session I started buying $SPY puts, then added downside exposure. Weak technology, failed recoveries and the developing bearish structure supported that decision.
I chose outright puts because I wanted exposure to both a price drop and a possible rise in implied volatility. I already had SPX hedges; SPY also gave me a way to discuss the trade in an instrument more members use.
I reduced the short before the close when the expected flush failed to develop. The remaining November 2 puts then paid after hours: 2.43 entry, with trims at 2.80 and 3.10. About 15% and 28% on those portions, before costs.
The morning long thesis still failed. The later profit came from a separate decision, and I adjusted that decision too when conviction weakened.
The reasoning, entries and changes were posted in Live as they happened.
https://t.co/OvKiKnIWaF
MikshuAlpha pre-market analysis, Thursday 29th October, 2026
1. Market Summary
The recovery continues, but participation remains uneven. Semiconductors and biotech led yesterday, while equal-weight SPY slipped slightly and several rate-sensitive sectors struggled. That leaves room for further upside without confirming a broad risk-on move.
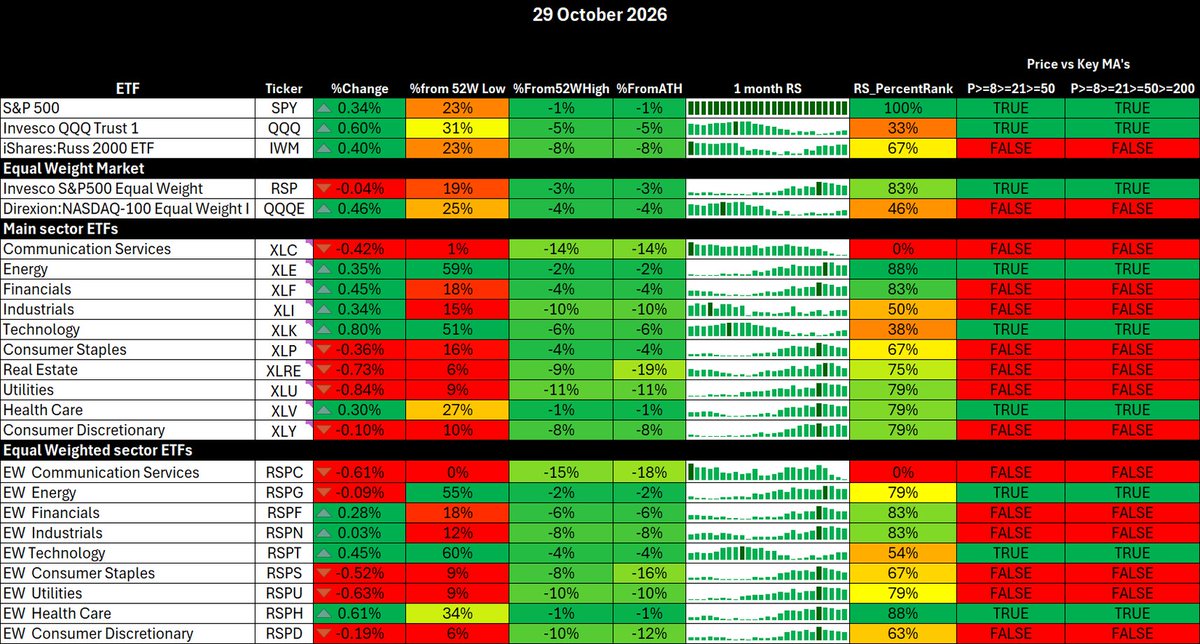
Yesterday delivered the hawkish hold the market expected. Despite the gap higher and choppy session, $SPY closed up 0.34%, $QQQ gained 0.60% and $IWM added 0.40%. Semiconductors continued the bounce I have been discussing over the past week, with SMH gaining 1.74% and SOXX 2.13%.
The earnings reaction has complicated that recovery. Alphabet sold off sharply, while Microsoft’s initial rally has faded considerably in pre-market. The focus is increasingly on whether AI expenditure is translating into sufficient revenue and cash flow.
My base case is an early recovery attempt, followed by a greater risk of selling later in the session or into the weekend. Improving breadth and subdued volatility support a bounce, but earnings uncertainty and overhead resistance make me cautious about chasing it.
2. Macro analysis
• US: The Fed hold has not removed the rates headwind. Treasury yields around 5% remain a challenge for growth valuations, particularly when investors are questioning the returns on heavy capital expenditure.
• Inflation interpretation: A hotter core PCE print would not automatically invalidate an equity recovery. Equally, the historical tendency for positive returns over the following month is not an intraday buy signal. Today, the useful confirmation is whether yields rise and equities absorb that pressure, or whether the initial bounce fails.
• Europe: The ECB decision is scheduled for 9:15am ET, with its press conference at 9:45am ET. That creates another catalyst around the cash open. European equities and bonds were firmer ahead of the decision, with a hold widely expected
• Japan: The Bank of Japan decision and quarterly outlook are due on Friday in Japan. Yen and Japanese bond reactions remain relevant to global risk appetite as we approach month-end.
• China: The broader backdrop remains fragile. Recent reporting highlights pressure on Chinese AI shares and mainland outflows from Hong Kong. Policy support has yet to establish a convincing global growth tailwind.
Amazon and Intel earnings tonight leave another major technology catalyst ahead. Friday’s month-end flows and next week’s midterms also limit how quickly event uncertainty can disappear.
3. Momentum and breadth
The short-term improvement is real, but the intermediate-term recovery remains incomplete.
• 55.28% of stocks in the broad-market breadth panel are above their 20-day averages, versus 41.08% above their 50-day averages.
• Nasdaq participation above the 5-day average is 58.84%, while the technology-sector reading is stronger at 74.32%.
• Russell participation has recovered to 58.08% above the 20-day, but only 41.71% above the 50-day and 49.41% above the 200-day.
• The breadth oscillator has turned positive, supporting the recent recovery.
• Yesterday’s RSP decline of 0.04%, against SPY’s 0.34% gain, shows that the latest index advance was more concentrated. QQQE gained 0.46%, also trailing its capitalisation-weighted counterpart.
This is consistent with a market recovering from oversold conditions. For a more durable advance, I want the improvement to spread into the 50-day breadth readings and equal-weight indices.
4. Volatility
VIX closed at 16.91 and was around 17.1 in pre-market. The supplied volatility dashboard also shows VVIX at 96.61, VIX1D at 13.15 and the equity put/call ratio at 0.713. These readings do not indicate a broad scramble for protection.
The distinction within the curve matters: the displayed VIX futures are above spot, but the second-to-first futures ratio is approximately 1.00. The front of the futures curve is therefore essentially flat, rather than showing a strong return to contango.
Implied correlation has also fallen, with the one-month reading at 8.73. Different sectors moving in different directions can cushion index volatility even while individual stocks suffer large declines. A quiet VIX does not mean technology cannot sell off.
The pre-FOMC positioning snapshot showed light gamma, slightly firmer downside skew and a dealer book potentially vulnerable to selling as volatility fell and options decayed.
My working SPX levels from the morning positioning map are:
• 7,725: Central pivot. Sustained trading above it improves the recovery case while rejection keeps downside pressure in play.
• 7,760 to 7,775: Overhead test. A failed rally here would lead me to add tactical index shorts. Acceptance above it would weaken that view.
• 7,700: Key downside test, with locally negative gamma potentially amplifying a break.
• 7,680: Lower edge of the straddle with key GEX.
• 7,640: Deeper support if the initial downside levels fail.
5. Credit and liquidity
Credit has improved from the recent stress, but the repair is incomplete.
HYG/TLT has rebounded towards 0.958, while LQD/HYG has eased towards 1.34. Both are consistent with some recovery in risk appetite, although their different interest-rate sensitivities mean they are not direct measures of credit spreads.
HYG itself remains near 77.59, towards the lower end of its recent range. Regional banks also lagged yesterday, with KRE down 0.65%, despite broader financials gaining.
The latest displayed SOFR minus IORB spread is +0.05 percentage points, or 5 basis points. Funding is firmer relative to the reserve rate, worth monitoring into month-end, but this alone does not establish a liquidity squeeze.
6. ETF and Sector rotation
Yesterday’s daily winners and the established relative-strength leaders are not identical.
• Biotech and healthcare: IBB gained 1.96%, XBI 1.72%, XHS 1.24% and equal-weight healthcare RSPH 0.61%. IBB is only 0.35% below its 52-week high, making it a particularly strong combination of relative leadership and price structure.
• Semiconductors: SMH gained 1.74%, SOXX 2.13% and DRAM 7.13%. However, all three still fail the shorter bullish MA-stack condition. This remains a powerful recovery trade that has yet to establish the same trend quality as the strongest RS groups.
• Software: IGV gained just 0.12%, but retains high relative strength and full MA alignment. HACK and CIBR fell 1.69% and 1.58% respectively while retaining those stronger structural characteristics. Their ability to hold support now matters more than yesterday’s ranking alone.
• Energy: XLE gained 0.35%, USO 1.64% and XES 1.88%. Energy remains a leadership pocket, although XES still needs better MA confirmation.
• Defensives and rate-sensitive groups: XLU fell 0.84%, XLRE 0.73% and XLP 0.36%. Healthcare was the stronger defensive pocket. Homebuilders and transports were also weak, with ITB down 1.51% and XTN 2.29%.
SPY, QQQ and XLK meet the full bullish MA alignment in my dashboard. IWM and the semiconductor ETFs do not.
7. Summary
I'm looking for upside early in the morning, but I favour a recovery attempt that becomes vulnerable to selling rather than a clean trend higher.
• A sustained reclaim of SPX 7,725, supported by semiconductors and improving equal-weight participation, would favour a test of 7,760 to 7,775.
• A failed reclaim, or rejection overhead while technology remains weak, would support the fade towards 7,700, then 7,680.
• Acceptance above 7,775 with broader participation would undermine the bearish intraday view.
• Biotech, healthcare, energy and selected software retain stronger relative leadership than the headline technology rebound suggests.
My focus is whether buyers can hold the recovery after the opening move. Subdued VIX can support that first bounce, but it does not guarantee it survives the session.
I'm still looking for more upside in $NVDA, but I've kept the position small.
In Live I've shared the entry, the adds and the chart developments I'm watching. The outcome is still open, and I want to see the bullish idea follow through.
Members can follow that process as it happens, including where my conviction stops and what still needs to prove itself.
https://t.co/OvKiKnIWaF
I still have the $IWM FOMC trade on, but I've already taken enough out to cover the original outlay.
The 27 October update covered the adds, a corrected strike and the partial trim. The remaining calls give me upside exposure into the event without leaving the original cash committed.
The runners still have value, so I still have something to protect. Recovering the outlay changes the risk; it doesn't remove the need to manage the trade.
Entry and management updates are in Live:
https://t.co/OvKiKnIWaF
MikshuAlpha pre-market analysis, Friday 9th October, 2026
1. Market Summary
My bias today is tactically bullish, with the potential for a stronger relief rally if oil, yields and volatility continue to ease. The broader market still needs to confirm that move.
Yesterday delivered another compression day with some sharp, headline-driven intraday swings. $SPY opened at 774.86 after gapping down from Wednesday’s close near 777.22, initially weighed down by semiconductors. Trump’s comments on Iran briefly lifted risk appetite before concerns over OpenAI revenues sparked another reversal, particularly across AI infrastructure and NVDA.
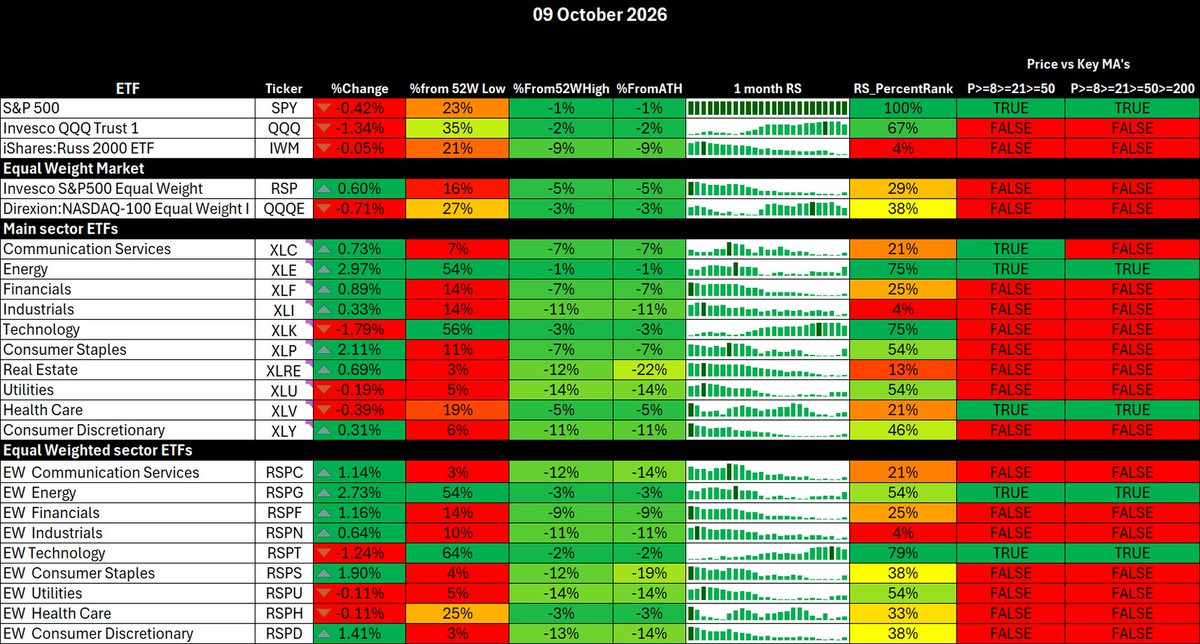
SPY closed down 0.42% at 773.93, while $QQQ lost 1.34%. However, equal-weight SPX gained 0.60%, and $IWM finished almost unchanged, down 0.05%. That distinction matters. The sell-off was concentrated in some of the largest technology exposures, while substantial parts of the market held up or advanced.
I used the weakness to add selectively to existing long swing positions in the likes of $MRVL, $ARM, $INTC, $AMZN and others. The repeated reversals offered better entries, although I would not interpret the muted index volatility response as proof that institutions were absent from the selling.
The more interesting development remains the potential turn in bond volatility and yields. The 10-year finished around five basis points lower and roughly ten basis points below its intraday high. If that develops into a sustained reversal, rather than another brief pause, it could relieve pressure on small caps and support broader participation.
2. Macro analysis
• United States: Trump’s indication that military action against Iran will be deferred until after the midterms has reduced immediate escalation concerns. Oil is retreating this morning, improving the backdrop for equities. However, Treasury yields edged higher during European trading after yesterday’s decline, so a sustained rates reversal still needs confirmation.
• Today’s scheduled risk: The preliminary University of Michigan consumer sentiment release is at 10:00 ET. Inflation expectations matter particularly here. A softer reading could support bonds, while another increase in expected inflation could interrupt the relief trade. This is a relatively light calendar, but it is not an event-free session.
• Eurozone: European sovereign borrowing costs are easing after the recent sell-off. My focus remains whether this becomes a durable improvement in financial conditions, particularly with French fiscal risk still in the background.
• China: Mainland equities were broadly steady, with Shanghai up around 0.05% and the CSI 300 around 0.16%. That offers limited confirmation of a global risk-on impulse. China remains a secondary driver for today’s US session.
• Japan: The Nikkei finished little changed. Lower energy costs offer relief, but the AI valuation debate continues to complicate the technology outlook.
For today, the important transmission is lower oil, calmer rates and reduced demand for immediate protection. Those conditions would favour equities. Next week introduces bank earnings and the 14th October CPI release, giving the market fresh reasons to reassess both profits and the rates outlook.
3. Momentum and breadth
The headline indices remain close to their highs, but underlying participation is still weak.
• Nasdaq: Around 39.06% of constituents are above their five-day average.
• S&P technology: Approximately 40.54% are above their five-day average.
• Broader participation: The breadth readings show only 35.99% above the 20-day average and 27.60% above the 50-day average.
• Russell 2000: Approximately 34.70% are above the 20-day average, 26.98% above the 50-day and 48.52% above the 200-day.
That is a clear divergence from SPY’s position within roughly 1% of its all-time high. The advance has relied on a relatively narrow set of names, and intermediate breadth has not repaired sufficiently.
Yesterday’s equal-weight outperformance is nevertheless encouraging. RSP gained 0.60% while SPY fell 0.42%, and equal-weight Nasdaq lost 0.71% against QQQ’s 1.34% decline. This suggests the weakness was disproportionately concentrated in the largest constituents.
My small-cap thesis remains conditional. Falling yields could trigger a recovery, but I want to see IWM outperform alongside improving participation. A bounce in the index alone would not establish a durable breadth expansion.
4. Volatility
The volatility complex remains subdued relative to the macro risks.
• VIX: Approximately 15.2 in the morning snapshot.
• VVIX: Around 87.66.
• VIX1D: Approximately 10.24, indicating limited immediate event premium.
• Second-to-first VIX futures ratio: Around 1.03, retaining a modest upward-sloping curve.
• Put/call ratios: Approximately 0.863 for equities plus indices and 0.727 for equities alone. Neither represents an obvious extreme.
Today’s key SPX positioning reference is 7,775. Above that level, positive dealer gamma favours damping and attraction towards 7,800. Acceptance above 7,800 would improve the case for 7,825 to 7,830 with an outside chance of sharp upside if yields and oil assist. Losing 7,775 would weaken that support and bring 7,750 and 7,735 back into focus.
The options flow was mixed. Broad-market flow showed substantial de-risking, with calls sold and puts bought, while SPX participants monetised protection into the afternoon low. That supports a recovery thesis without establishing that yesterday’s selling was purely retail panic.
Dealers short the downside puts added on the OpenAI panic yesterday means that a recovery accompanied by falling implied volatility can generate supportive hedge adjustments through vanna. Time decay can contribute through charm.
Positive gamma also favours mean reversion. It can help the market stabilise without producing an immediate breakout.
5. Credit and liquidity
Credit offers a more cautious message than equity volatility.
• HYG remains near recent lows, around 77.14 in the chart snapshot. It has stabilised slightly but has not delivered a convincing recovery.
• HYG/TLT remains elevated, although it has pulled back from its recent peak. That ratio has been heavily influenced by Treasury weakness, so it cannot independently establish healthy credit.
• LQD/HYG remains near the lower end of its recent range, indicating continued relative resilience in high yield versus investment-grade duration.
• Regional banks remain technically weak, despite yesterday’s 1.02% gain in KRE.
• SOFR minus IORB is approximately minus two basis points, showing no obvious repo funding squeeze in this measure.
My read is that there is no clear acute funding shock, but neither credit nor regional banks fully confirms a broad risk-on regime.
A sustained Treasury recovery accompanied by stabilising HYG and stronger banks would give the equity rally a firmer foundation.
6. ETF and Sector rotation
Relative leadership remains strongest in cloud, cybersecurity and software, while semiconductors have lost technical alignment.
• Top five by relative-strength ranking: SPY, WCLD, CIBR, HACK and IGV. All retain the bullish price and 8/21/50-day moving-average alignment, extending through the 200-day average.
• High-RS pockets: WCLD gained 1.48%, while CIBR fell 0.35%, HACK 0.37% and IGV 0.23%. Their technical structures held up considerably better than semiconductors. MAGS also retains its full moving-average alignment despite losing 0.90%.
• Semiconductors: SMH fell 2.84%, SOXX 3.35% and XSD 3.68%. None meets the bullish moving-average alignment. DRAM lost 5.13%, while photonics and lithography exposure through EUV fell 3.74%.
• Technology: XLK lost 1.79% and fails the alignment test. Equal-weight technology, RSPT, fell 1.24% but retains full alignment. That is another useful distinction between concentrated index weakness and the wider technology universe.
• Software: XSW gained 0.93% and retains full alignment. The AI-related sell-off did not affect all technology exposures equally.
• Energy: XLE gained 2.97%, XOP 2.79% and FCG 2.21%. XLE and XOP retain full alignment, but falling oil today could reverse part of yesterday’s strength.
• Financials and rate-sensitive areas: XLF gained 0.89%, KBE 1.05%, KRE 1.02%, ITB 1.38% and XHB 0.83%. These are potential beneficiaries of calmer rates, although their moving-average structures remain unconfirmed.
• Defensives: XLP gained 2.11%, XLRE 0.69%, XLV fell 0.39% and XLU 0.19%. This was not a uniform defensive bid. XLV retains full alignment, while staples, utilities and real estate fail it.
• Bottom-ranked group: Numerous ETFs share the lowest ranking. Five examples are IWM, XLI, KRE, KWEB and XHB. Yesterday’s gains in some of these areas are early recovery attempts rather than established relative leadership.
My preferred watch is cloud and software holding their strength, semiconductors stabilising, and small caps responding positively to lower yields. That combination would support a healthier rally than another move driven solely by a handful of mega caps.
7. Summary
I favour an upside attempt today while SPX holds above 7,767.5, with 7,800 the first important test.
• Lower oil and calmer rates provide the potential catalyst.
• Falling implied volatility and the unwinding of downside protection could add mechanical support.
• Software and cloud offer stronger technical structures than semiconductors.
• Small-cap outperformance would be useful confirmation that breadth is beginning to improve.
• A sustained break below 7,767.5, particularly alongside rising yields or volatility, would undermine the bullish setup.
The repeated mean reversions continue to reward patience and selective entries. Earnings season could change that behaviour by introducing larger differences between individual companies.
My more bullish scenario is an all-time-high attempt, with SPX 7,870 as an extension target if resistance is cleared and breadth improves. Positive gamma makes another session of compression around 7,800 a credible alternative.
I remain more cautious about next week. Narrow participation, subdued volatility and unresolved macro risks leave room for a sharp reversal if earnings or inflation disappoint. That is why I intend to add defined-risk long structures alongside downside index hedges today. A Friday rally would improve the immediate tape but it would not, by itself, resolve the risks beneath it.