Land/Water and Vegetation Analysis help reveal patterns that can be difficult to spot in natural color imagery.
Useful for monitoring water resources, vegetation condition, and environmental change.
🔗 Try vegetation indices: https://t.co/0EtVuh3nT0
Color Infrared and Agriculture visualizations make vegetation patterns easier to interpret at a glance.
Both are useful for assessing crop conditions, identifying variability, and tracking field development throughout the season.
Vegetation indices help reveal different aspects of crop conditions throughout the season.
NDVI is one of the most widely used indices for monitoring vegetation health.
More in the next posts ⏩️
One of Dubai’s residential districts, where artificial waterways and urban planning create striking patterns visible from space.
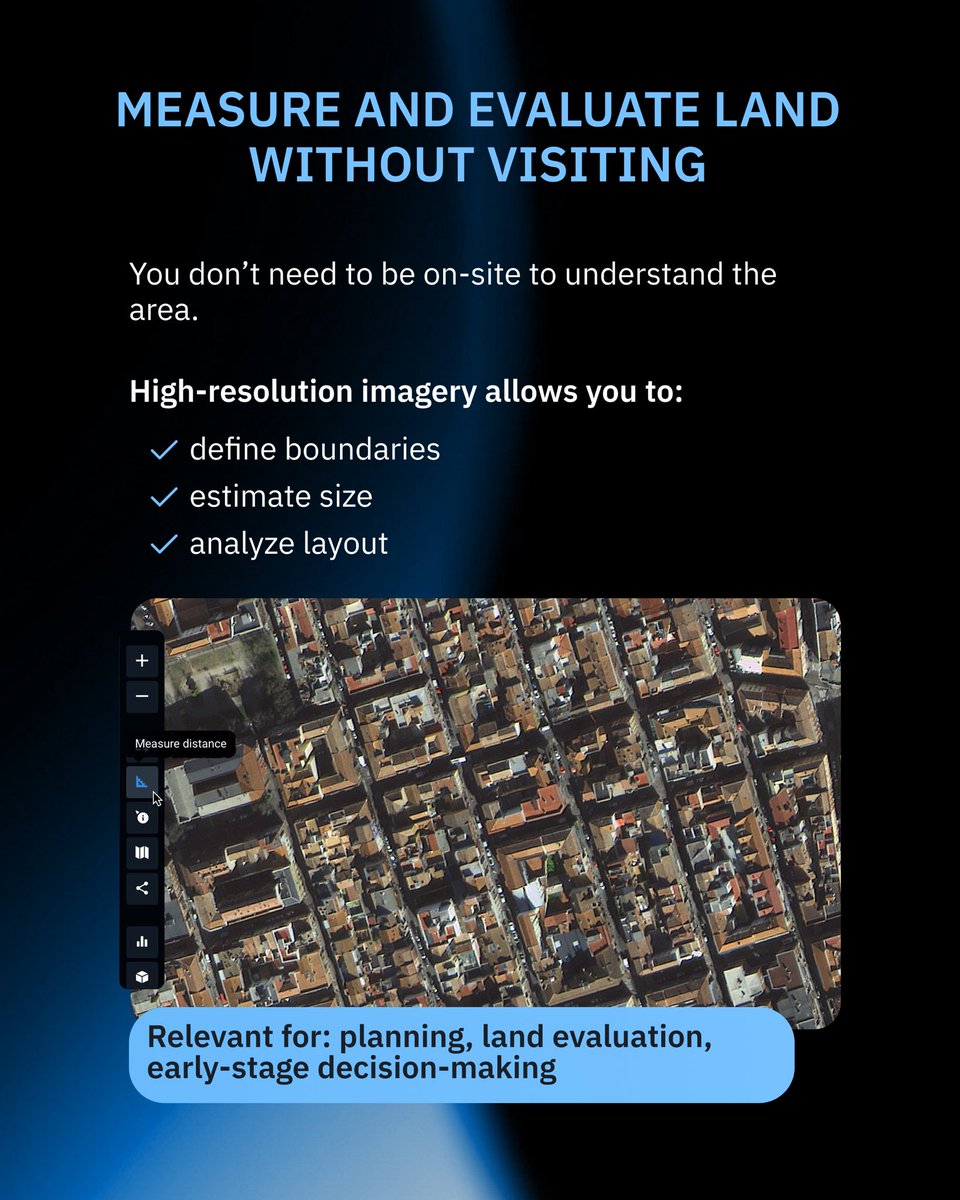
High-resolution imagery helps monitor urban development and city growth.
🛰 Satellite: NewSat by @Satellogic
🔗 Explore https://t.co/DO0EfZ8if6
Is ultra-high-resolution imagery always necessary? Sometimes, tracking changes over time matters more than maximum detail.
Want to find a solution tailored to your needs? Contact our team https://t.co/AzfPDxlpSU
What level of detail is actually enough for monitoring ports, terminals, and vehicle activity from space?
The answer depends on what exactly you need to see — and how often you need to monitor it.
Not every monitoring task needs ultra-high-resolution imagery.
In this Q&A series, Anna Zakharchenko explains how different resolution levels fit different monitoring workflows.
More in the next posts ⏩️
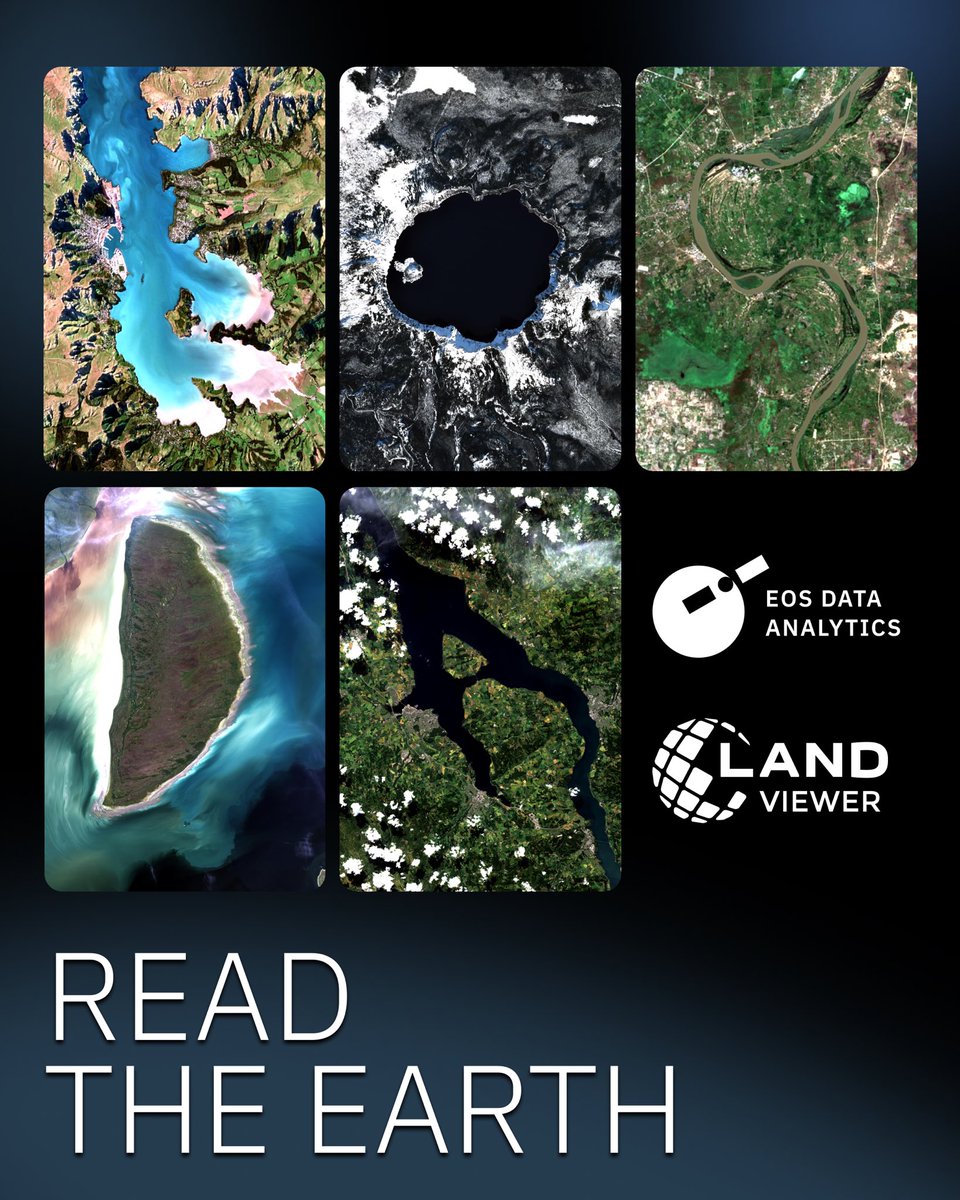
To mark International Day for Biological Diversity, we took a look at how different ecosystems appear from space 🛰
🔗 Find these images and much more on the LandViewer platform https://t.co/TVwmhHVVv1
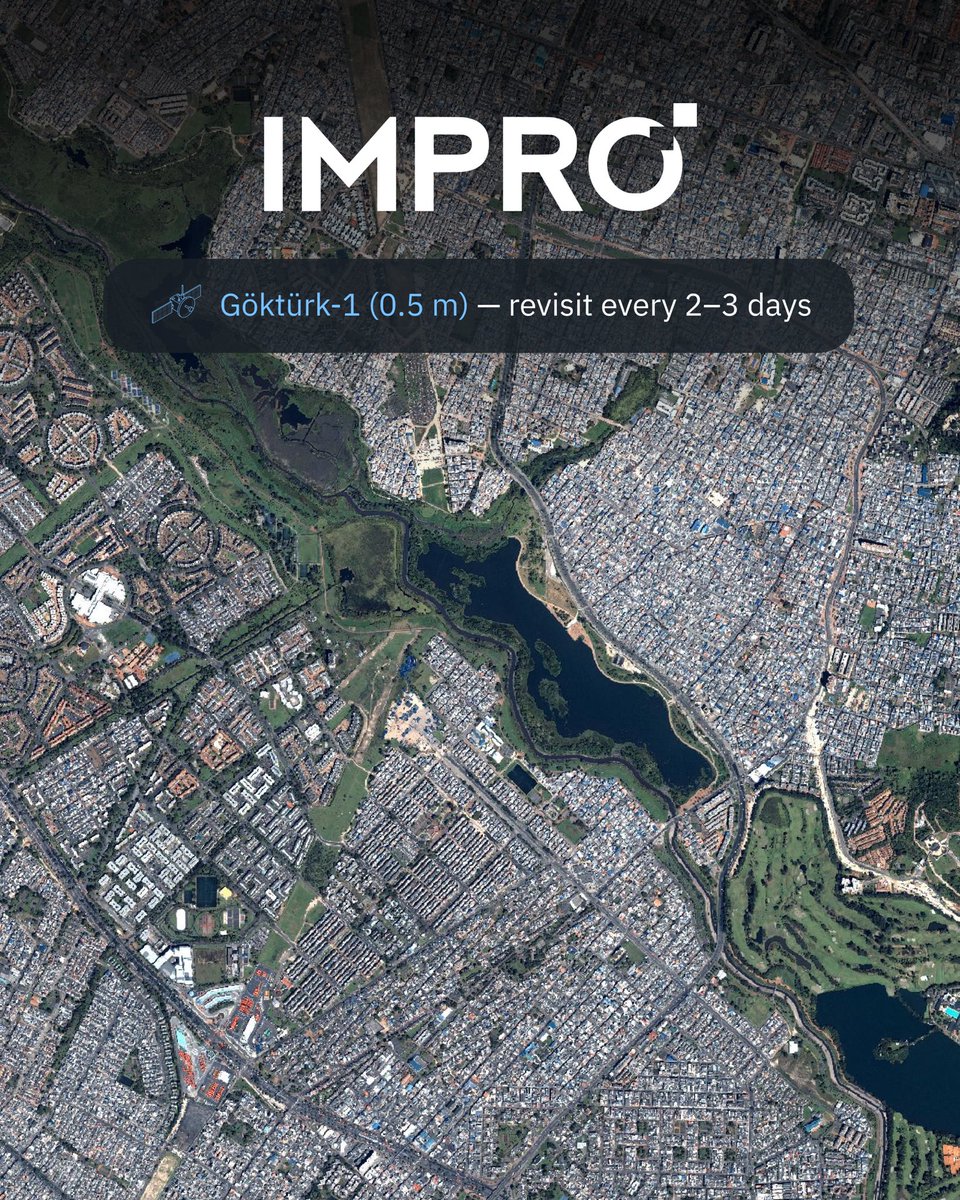
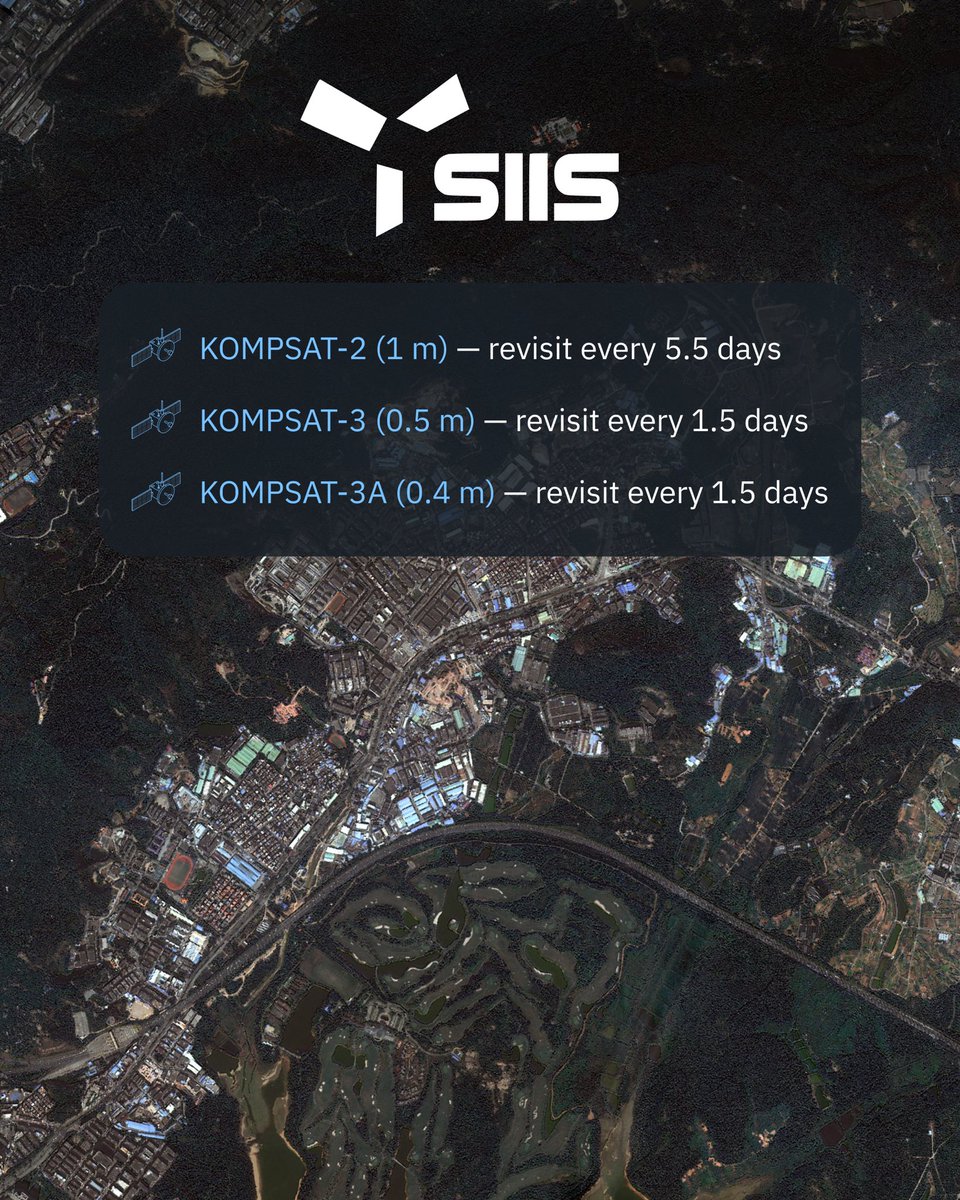
Different satellite constellations offer different strengths — from faster revisit frequency to ultra-detailed imagery for infrastructure, urban, and site-level monitoring.
@geosat_space
Check high-resolution imagery options https://t.co/UFkNlSzsLn
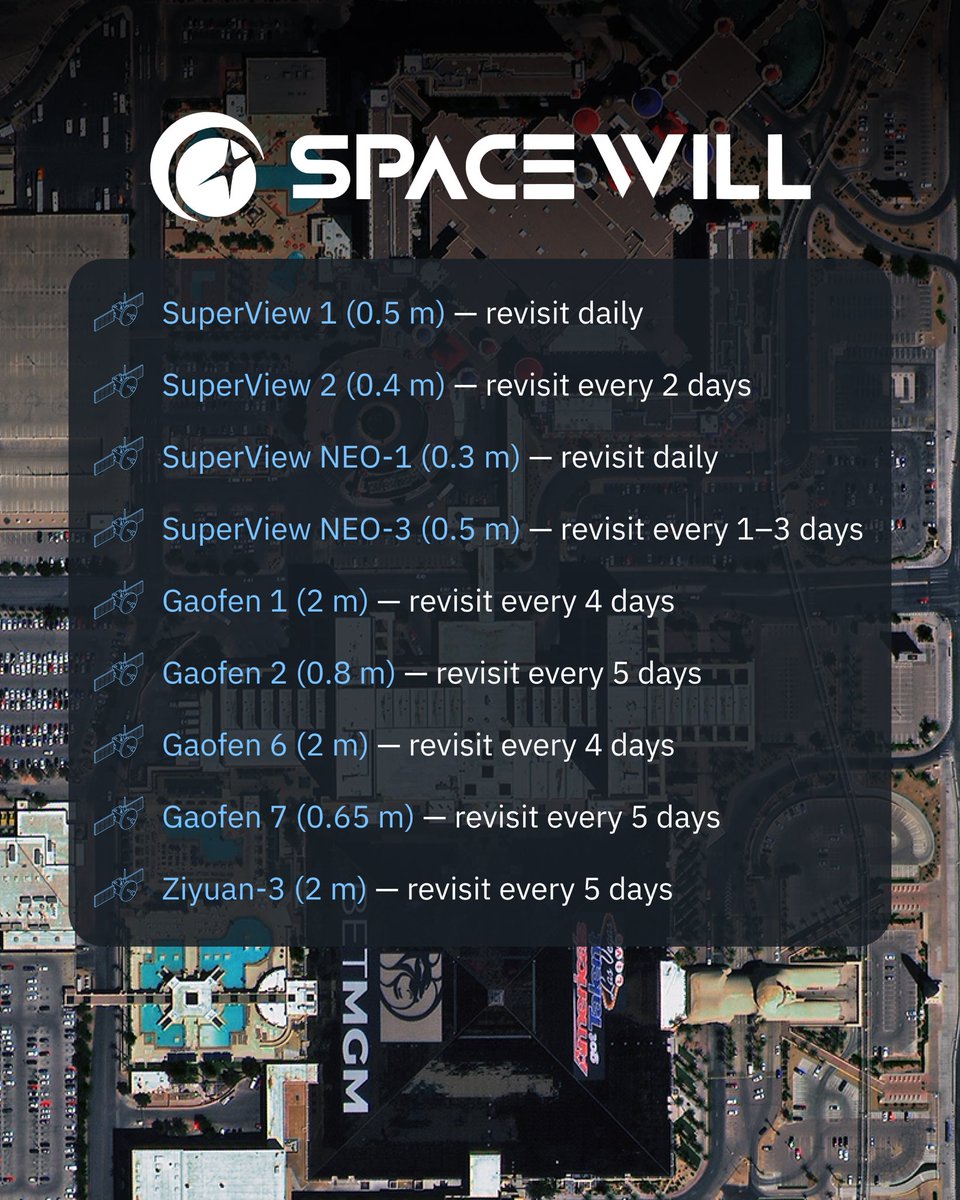
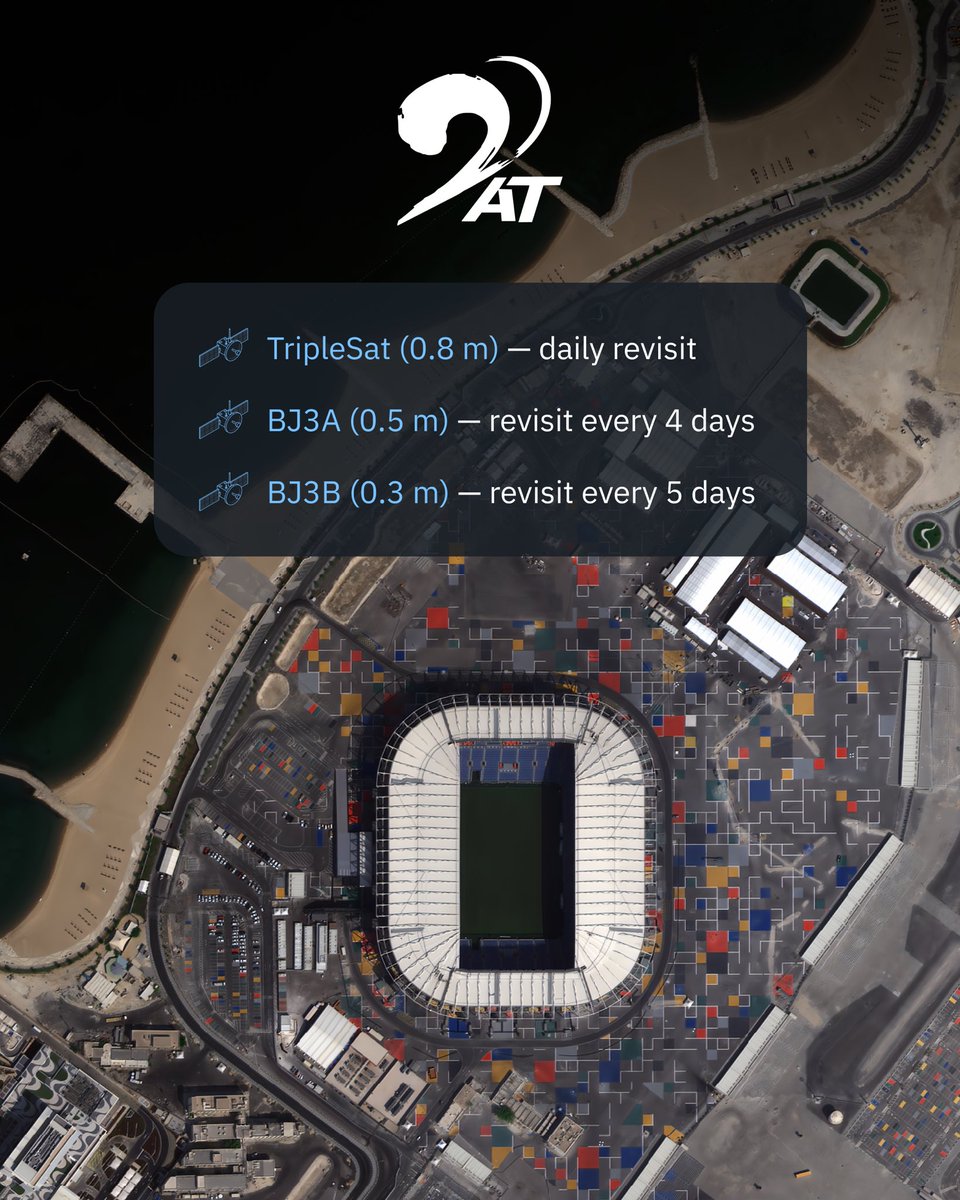
From tactical monitoring to ultra-high-detail analysis these providers expand LandViewer's high-resolution imagery capabilities with different revisit rates and precision levels.
@BlackSky_Inc@Satellogic@21AT_Asia
Check high-resolution imagery options https://t.co/UFkNlSzsLn
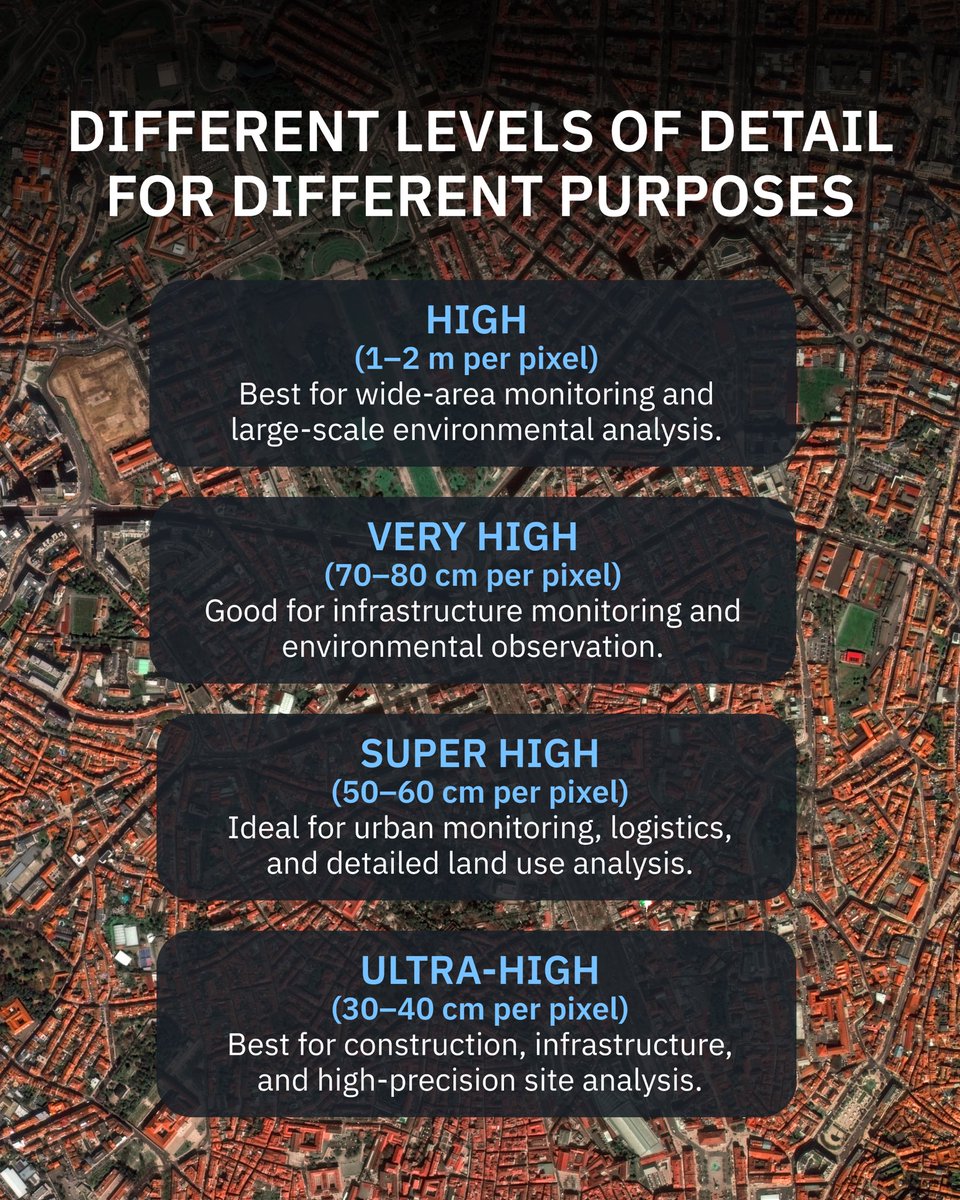
Explore high-resolution satellite imagery from multiple providers in LandViewer.
Different resolution levels — from wide-area monitoring to ultra-high 30 cm detail — help you choose imagery that fits your analysis needs.
High-resolution providers in the next posts.
One of Japan’s largest wildfires in recent decades — seen from orbit. These images capture smoke plumes and burned areas during the April 2026 wildfires in Ōtsuchi, Iwate Prefecture, Japan.
🛰 Sentinel-2
Explore imagery options: https://t.co/TVwmhHVVv1
BlackSky Gen-3 is now available in LandViewer. Built for faster, high-precision monitoring with Al-powered analytics and near-real-time delivery.
✔️0.35 m resolution
✔️up to 15 daily passes
✔️RGB, Panchromatic & SWIR imagery
@BlackSky_Inc
Explore: https://t.co/cR7nQlxqbs
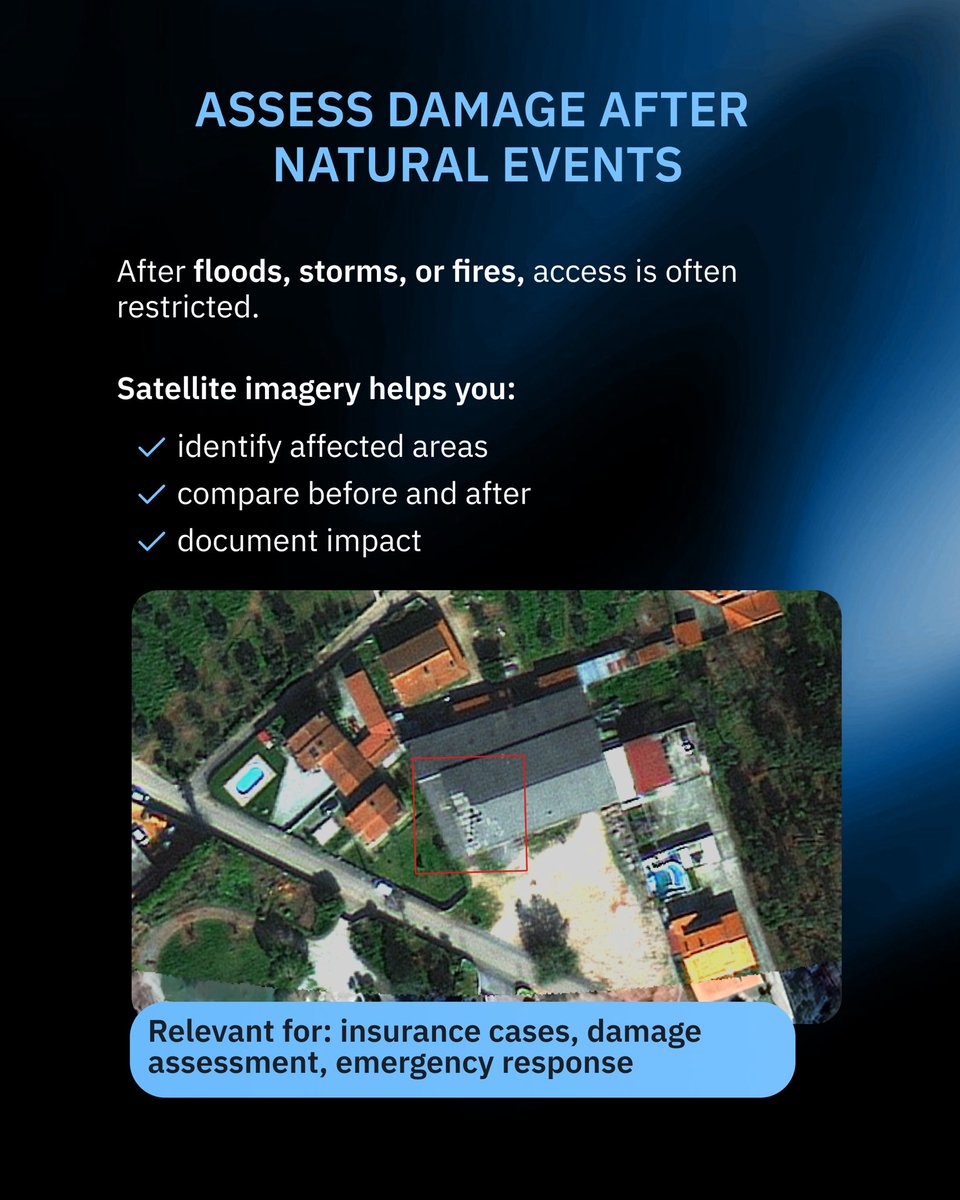
In February 2026, severe storms caused major flooding in Portugal’s Coimbra district.
@eos_da used SAR, optical, and high-resolution satellite imagery to monitor flood extent and damage over time. Full case study:
https://t.co/kFNzq4rEuX
🌎 Some patterns aren’t obvious — until you see them from above.
Coastlines, rivers, and landscapes can align in unexpected ways, forming hidden letters within the terrain.
In this post, satellite images come together to spell EOSDA — the company behind LandViewer.
Satellogic NewSat imagery is now available in LandViewer.
Now with 0.7–0.8 m resolution and global coverage — see buildings and vegetation in detail.
Up to 4 satellite passes per day mean:
✔️ more cloud-free shots
✔️ faster data access
✔️ track changes within the day
From assessing damage to tracking change — satellite data gives you a complete picture.
With LandViewer, you turn any location
into insights you can actually use.
Explore LandViewer https://t.co/WVfXn1yjlF
Track what’s happening on-site — without being there.
Satellite imagery lets you monitor construction progress, verify activity, and see how a location changes over time.
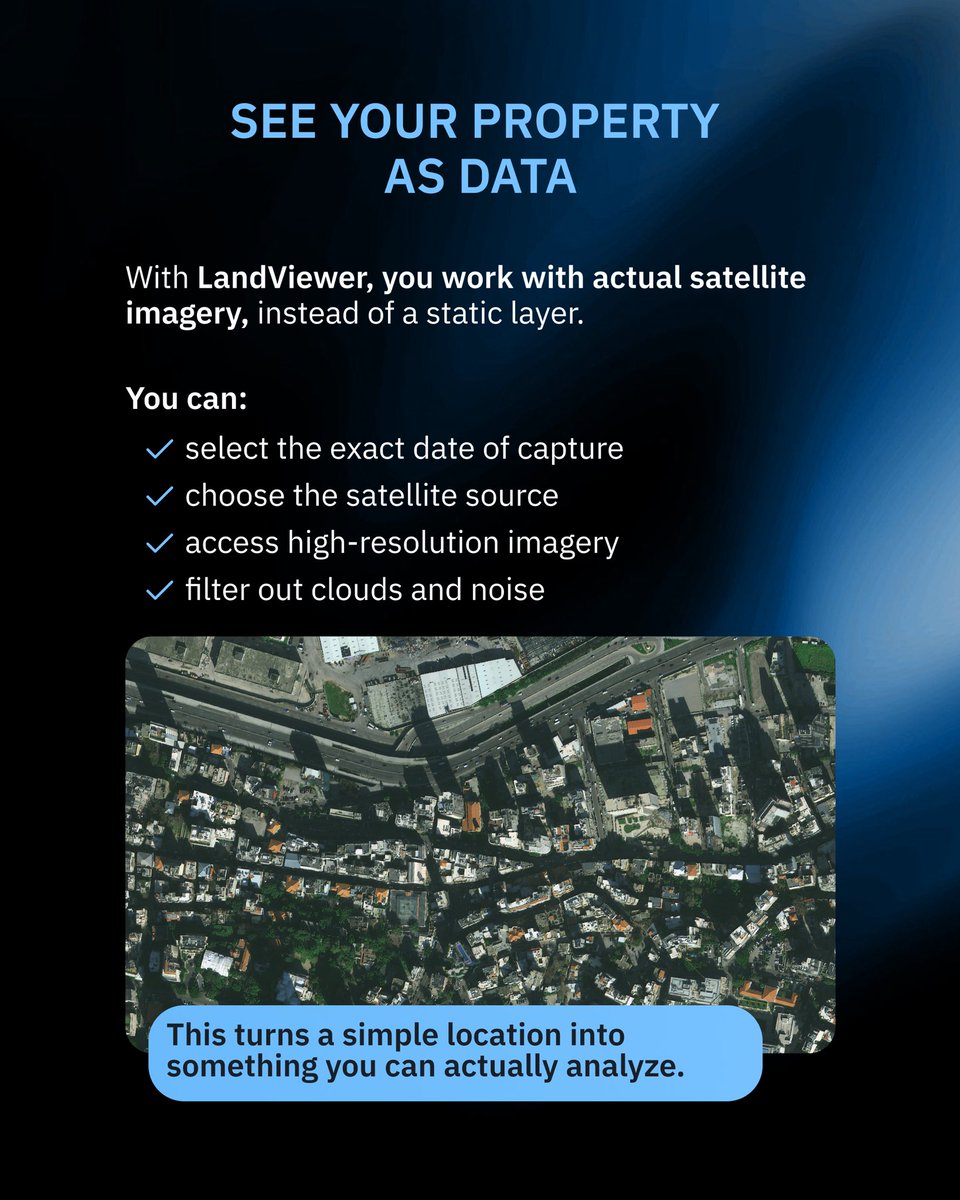
Satellite images turn a location into data.
With @EOSDALandViewer , you don’t just see a place — you analyze it.
You choose the date, source, and level of detail. And with satellite archives,
you can verify what actually existed on a location before.
🛰️ Satellite images of your home open up more possibilities than it might seem at first.
We break down real ways people use satellite data in everyday situations.
More in the next posts.