Two cities. Two concerts. One shared perspective.
Following our presentations in London and Birmingham ahead of the @SpaceStationE concerts, here's what the audience learned about:
🌍 ESA's role in Earth observation is critical in helping us to understand, address and adapt to climate change
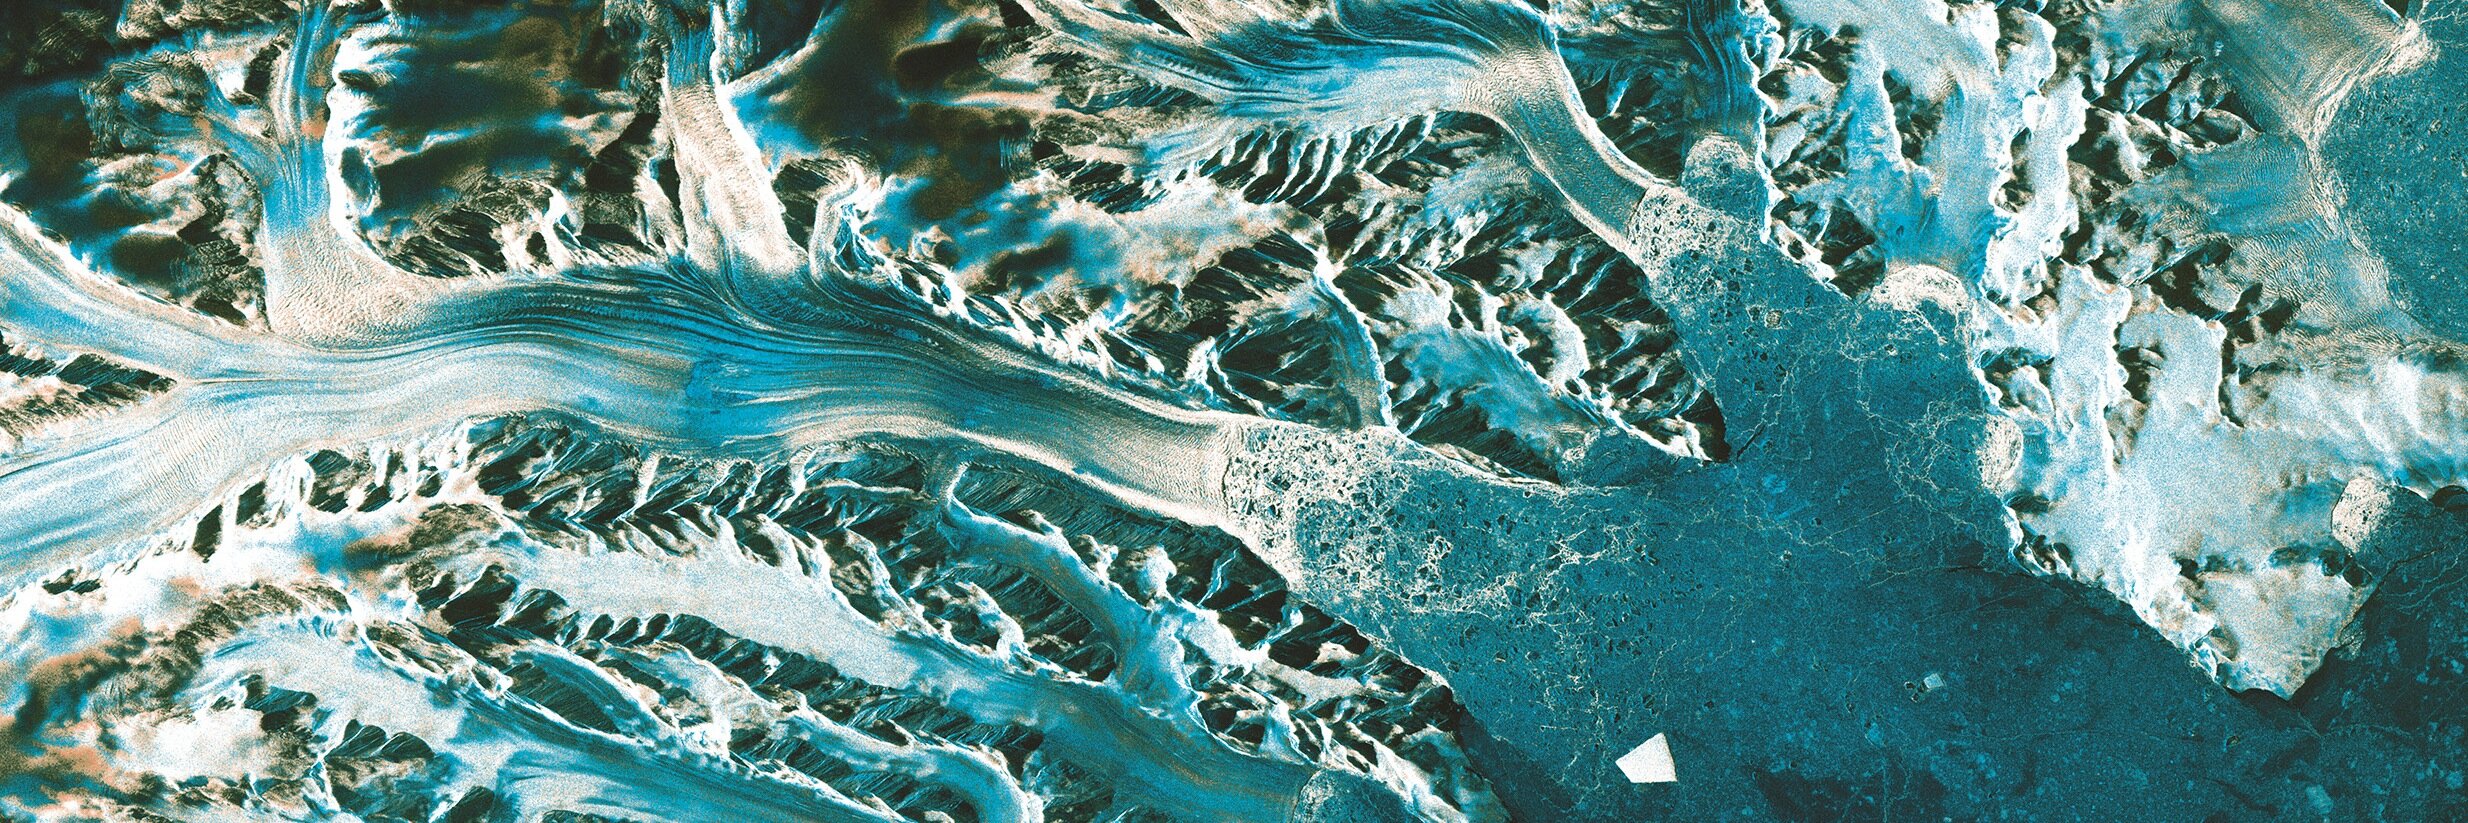
🏔️ Astronaut & ISS commander @astro_luca joined a team at the Gorner Glacier in Switzerland to validate satellite data on ice elevation, velocity and mass change on the ground
🎶 Paired with @ilaneshkeri's music and film: science and art can speak with the same voice
New article highlights the introductory Jupyter notebook from the @esa Climate Change Initiative Biomass project that enables you to access, visualise and analyse global above ground biomass data independently. You can track changes in forest carbon stocks over time at resolutions ranging from 100 m to 50 km, covering the period from 2005 to 2024. The article on above-ground biomass and forest monitoring is now online: https://t.co/3mmPkfq1L4
Today is #WorldEnvironmentDay and the signs from our planet are clear. @UNEP is calling for action with #NowForClimate. Forests, oceans and wetlands offer solutions. But all of this needs a foundation: reliable, long-term data from space. See how @CAlbergel explains why systematic Earth observation is key to making informed climate decisions. 👇
This study strengthens agricultural drought monitoring!
ESA-funded researchers compared high‑detail surface soil moisture maps from Copernicus Sentinel‑1 and Sentinel‑2, and a five‑year (2017–2021) daily time series from @esa's Climate Change Initiative soil moisture data record. The different data sets broadly agreed on when the wet and dry periods occurred, highlighting the value of pairing fine spatial detail with stable daily climate data records.
As drought increasingly threatens agricultural production and water supplies, monitoring it is crucial for early warning and better-informed farming decisions.
Read the open‑access paper here: https://t.co/rVFnZBeUwa
We're proud to be part of @SpaceStationE, a stunning musical experience by @ilaneshkeri. Performed with an orchestra and choir, it will be accompanied by a breathtaking triptych film including satellite images.
Before the concert begins, ESA will take the stage to demonstrate how satellites help us understand and respond to climate change. Join us as we explore how seeing our planet from space transforms our understanding of our place in the universe.
📍 31 May, London, Royal Festival Hall
📍 5 June, Birmingham, Town Hall
Grab your tickets 👉 https://t.co/5sup0Qvb8P
In climate modelling, one week of extreme fires can outweigh months of “normal” smoke if we don't measure precisely enough🔥
A new study improves how a global climate model sizes wildfire smoke emissions to differentiate between normal fires and extreme "mega fires". The researchers used daily fire emissions (instead of monthly averages) and adjusted them based on how much vegetation is estimated to burn each day. This helped the model better match satellite observations, e.g. during events like the September 2020 California fires.
The team used carbon monoxide measurements from Copernicus Sentinel‑5P satellite to make sure the comparison focused on real wildfire plumes.
Read the paper here: https://t.co/vkEr1to8Fr
For 60 years, mysterious seismic vibrations at a period of 26 seconds from the Gulf of Guinea have puzzled scientists. 🌊
Now solved: Southern Ocean storm swells travel thousands of km and trigger resonance in fluid-filled cracks beneath the seafloor — like blowing across a bottle at just the right angle.
📄 Poli et al. (2026) in @Nature Communications:
https://t.co/0LGDEnar5F
🔥 This Friday, 22 May: join ESA's Climate Change Initiative at #GISTAM26 for a wildfire keynote (hybrid session) and hands-on satellite data tutorial in Benidorm.
14:30-15:30 Keynote: https://t.co/CQECDUByGS
15:45-17:45 Tutorial details: https://t.co/DgT4CAvt9h
📢 Registrations and call for abstracts are now open for the UK Earth Observation Conference 2026!
#UKEO2026 will bring together the UK’s Earth observation community to share the latest science, applications and innovations shaping our use of Earth observation data and technology.
The conference provides a vital platform to:
🤝 Build collaborations
💡 Exchange ideas
📊 Explore how Earth observation data supports national and global priorities
📅 15-17 September 2026
📍 @uniofwarwick
🔗 Register and upload your abstracts here: https://t.co/S5CYECMnLy
There are 2 days left to register for our webinar 'Satellite retrievals of vegetation parameters'.
Find out how ESA's Vegetation CCI+ dataset can be used to track leaf density, light absorption and long-term vegetation change from space. This webinar is ideal for anyone working in vegetation monitoring, land surface modelling or phenology, or who is simply interested in the topic.
🔗 Register here: https://t.co/vSgRbk5P6E
❓What makes ESA's Vegetation CCI+ dataset stand out – and how can you access, visualise and analyse it? Join us for our upcoming webinar on 20 May, where @christiaan_tol will answer these questions and demonstrate the insights that can be revealed by this kind of long-term record, from the immediate impact of forest fires to subtle shifts in seasonal phenology. Secure your spot here: https://t.co/vSgRbk5P6E
Meet @christiaan_tol – one of the scientists behind ESA's Vegetation CCI+ dataset.
In his role as science lead at the @FacultyITC, he uses a combination of human intelligence, computing power, and a vast archive of satellite data to track changes to Earth's vegetation🌳
Join our next webinar on 20 May to hear from him: https://t.co/vSgRbk5P6E
Ground temperatures in permafrost regions are increasing – and the data leaves no doubt 📈
In last month's webinar, Annett Bartsch demonstrated how @ccipermafrost records have documented changes in lowland areas since 1997 and revealed regional differences. In mountain regions, satellite-derived rock glacier movements tell a complementary story: acceleration is widespread. Missed it? Watch the recording here: https://t.co/06Hh8kECue
🔥 Interested in regional fire monitoring? New CCI Toolbox Notebooks make it easier than ever to capture and track specific fire events.
Find out when and where fires occurred with satellite-based datasets that reveal seasonal fire patterns across different regions. You can see how fire timing varies throughout the year and discover which land types are most affected by wildfires.
Explore ready-to-analyse datasets for your region of interest and run all Toolbox operations seamlessly. Perfect for wildfire risk assessment, seasonal pattern analysis, and land management decisions.
Ready to dive into fire data? Check out the step-by-step Notebook: https://t.co/TtJtFsNhe5
Each data point in ESA's Vegetation CCI+ dataset is derived from up to 222 satellite observations. Over 21 years, this level of detail builds up to provide a comprehensive record of the planet's plant cover 🍃 In our next webinar, @christiaan_tol will demonstrate how this dataset can be used to track everything from forest fire recovery to seasonal changes in photosynthesis, and how it can be applied in your own research.
📅 20 May 2026 | 16:00 CEST
🔗 Register here: https://t.co/vSgRbk5P6E
🌍 Last week, ESA held its Earth Action Info Day – now available as a recording.
Learn about ESA's Earth Action programme, its role in tackling climate change, biodiversity loss & pollution, and upcoming tender opportunities for entities from ESA Member States.
👉🏼 Worth a watch: https://t.co/daaHg6TvUw
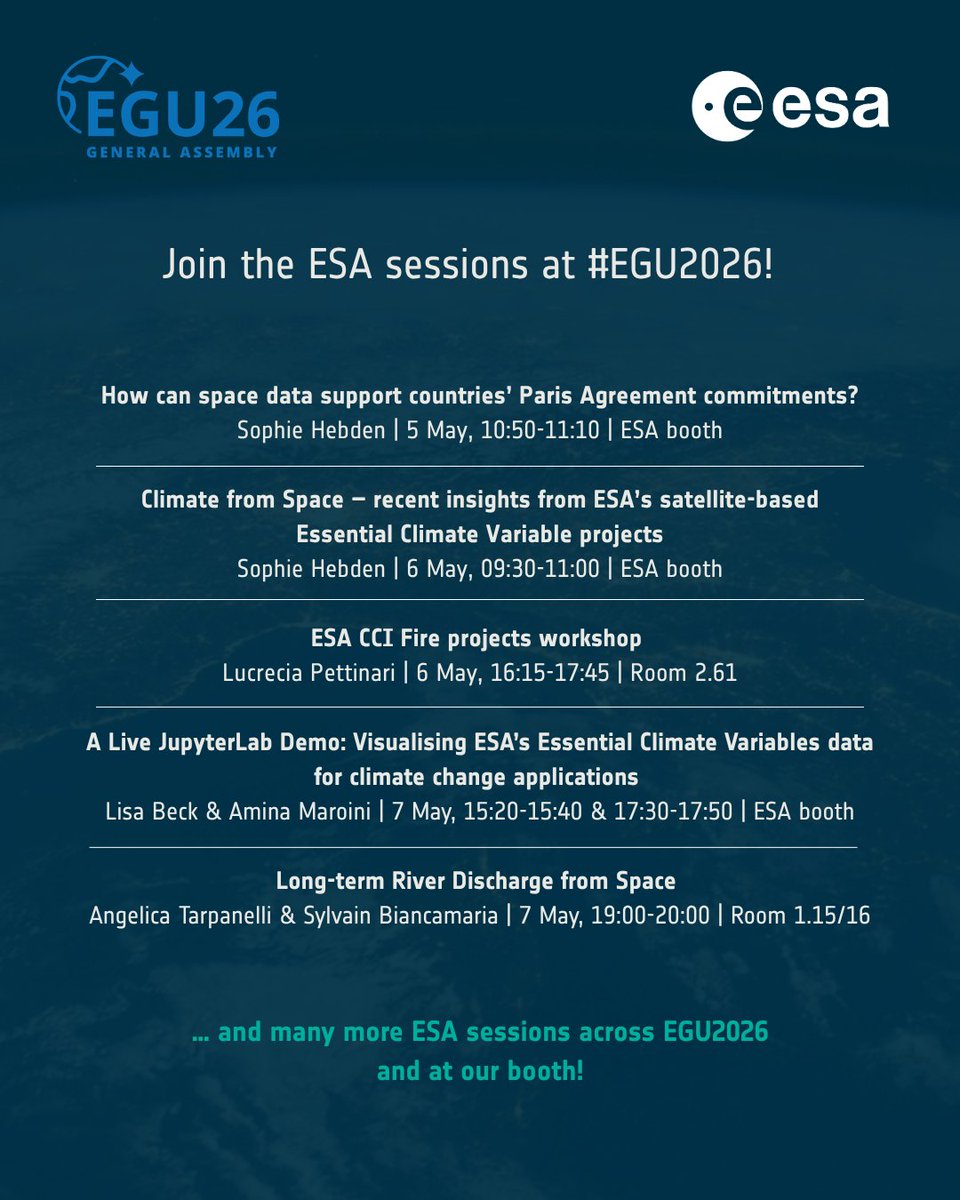
🛰️The ESA Climate Change Initiative is heading to #EGU26 in Vienna, 4–8 May – come and learn from leading scientists in satellite climate research! Numerous projects will be presenting the latest in satellite climate science. Find us at booth #X201 in Exhibition Hall X2, right next to the EGU stand. https://t.co/SWYeJ17wS4
The European State of the Climate 2025 from @CopernicusECMWF and @WMO is out today. Key findings: Record wildfire-burned area and emissions, the highest sea surface temperatures on record, glacier loss across all European regions, and snow cover at its third lowest on record.
ESA Climate Change Initiative data was used to track lake surface water temperatures, revealing that 81% of European lakes were warmer than average in 2025.
Full report: https://t.co/pH1p1qgXP7