Biological data analysis is complex and time consuming. Our freeCount tools guide users through the analysis of #omics data.
🎉 No coding required!
The easiest way to use our #R Shiny #bioinformatics apps is online with Posit Connect Cloud.
Learn more 👉 https://t.co/3oM6qa2s5l
After running a bunch of different analyses, venn diagrams are an intuitive and common way to show the relationships between sets. With freeCount you can quickly whip up venn diagrams.
Click to see how! 👉 https://t.co/ZPq9S4Ac9P
#R#Programming#Bioinformatics#Omics#Tutorial
Functional analysis can also be performed after weighted gene co-expression network analysis (WGCNA) to explore the biological functions driving the patterns of gene co-expression. 🧬
See how! 👇
https://t.co/Djh7Q745Dz
#Bioinformatics#Omics#R#Tutorial
If you are interested in understanding the expression of genes at the system-level, network analysis with WGCNA is a great approach. It just takes a few minutes to construct gene co-expression networks using the freeCount apps! 👉 https://t.co/cfCJSioRlD
#Bioinformatics#Tutorial
Functional analysis is performed after differential expression analysis to figure out what biological functions are driving the differences in gene expression. 🧬
See how in my latest freeCount #R shiny app #tutorial! 👇
https://t.co/yhz6VOddaD
#Bioinformatics#Omics
With freeCount it's easy to make lists of differentially expressed genes for your experiment.
My new tutorial will show you how to create a list of differentially expressed genes in just a few minutes!
👉 https://t.co/F8C2pCqQhb
#Bioinformatics#Omics#Transcriptomics#Tutorial
Our freeCount apps provide users with a set of common #bioinformatics tools for the analysis of count data. No #programming required!! 🤯
The freeCount #R Shiny apps can also be run online through Posit Cloud! See how 👇
https://t.co/6VHpmpMwCw
I was excited to introduce freeCount at #PEARC24 this week! freeCount is a coding-free analysis framework that provides a structured approach to biological count data analysis.
📌 Check out our publication:
https://t.co/ZIA9CmZWDa
🧬 #bioinformatics#omics#rshiny#rprogramming
I was very honored to receive the 2024 Center for Research Computing Award for Computational Sciences and Visualization from the
@NotreDame
Center for Research Computing (CRC). 🎉
Thank you Mike Pfrender for your support and the nomination! 😁
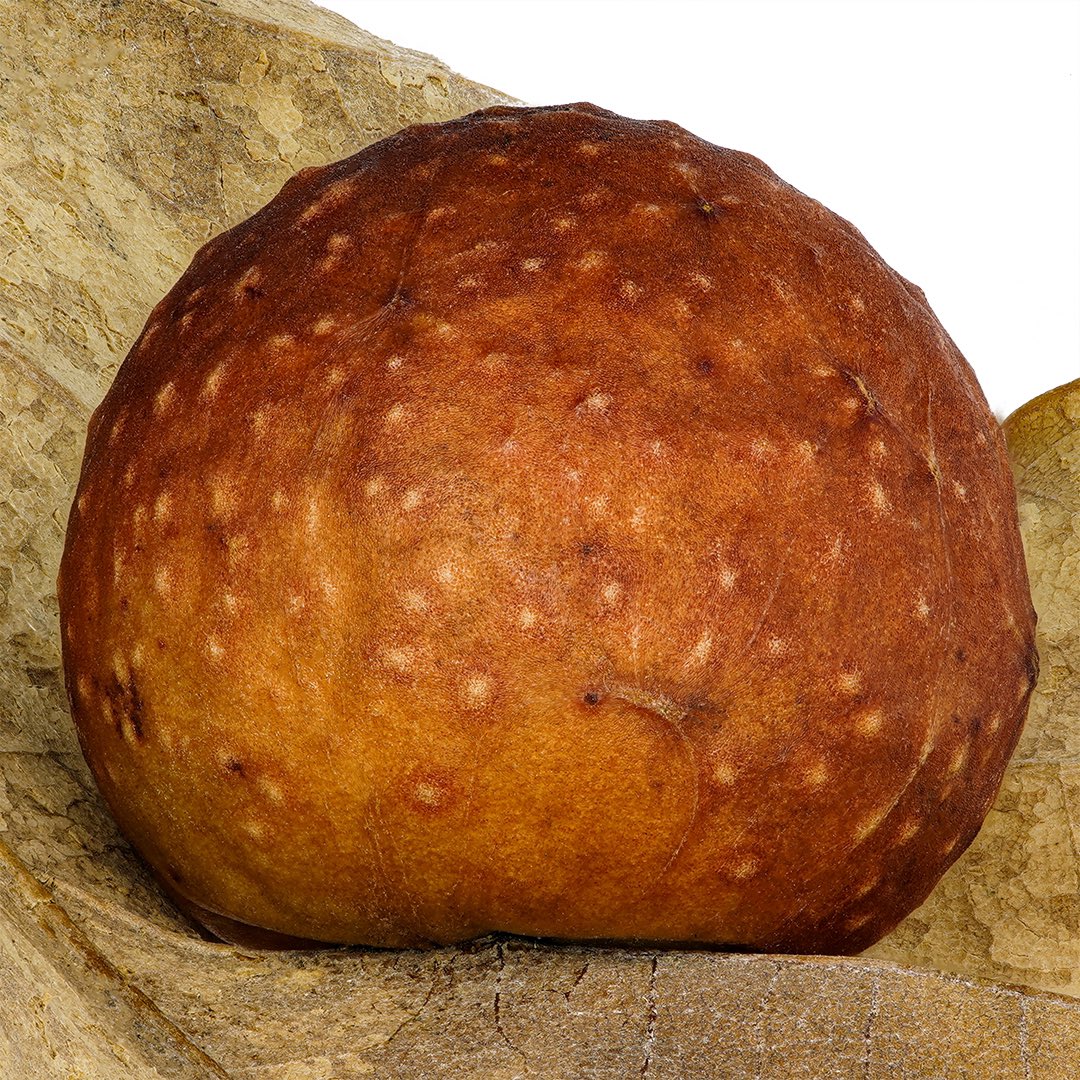
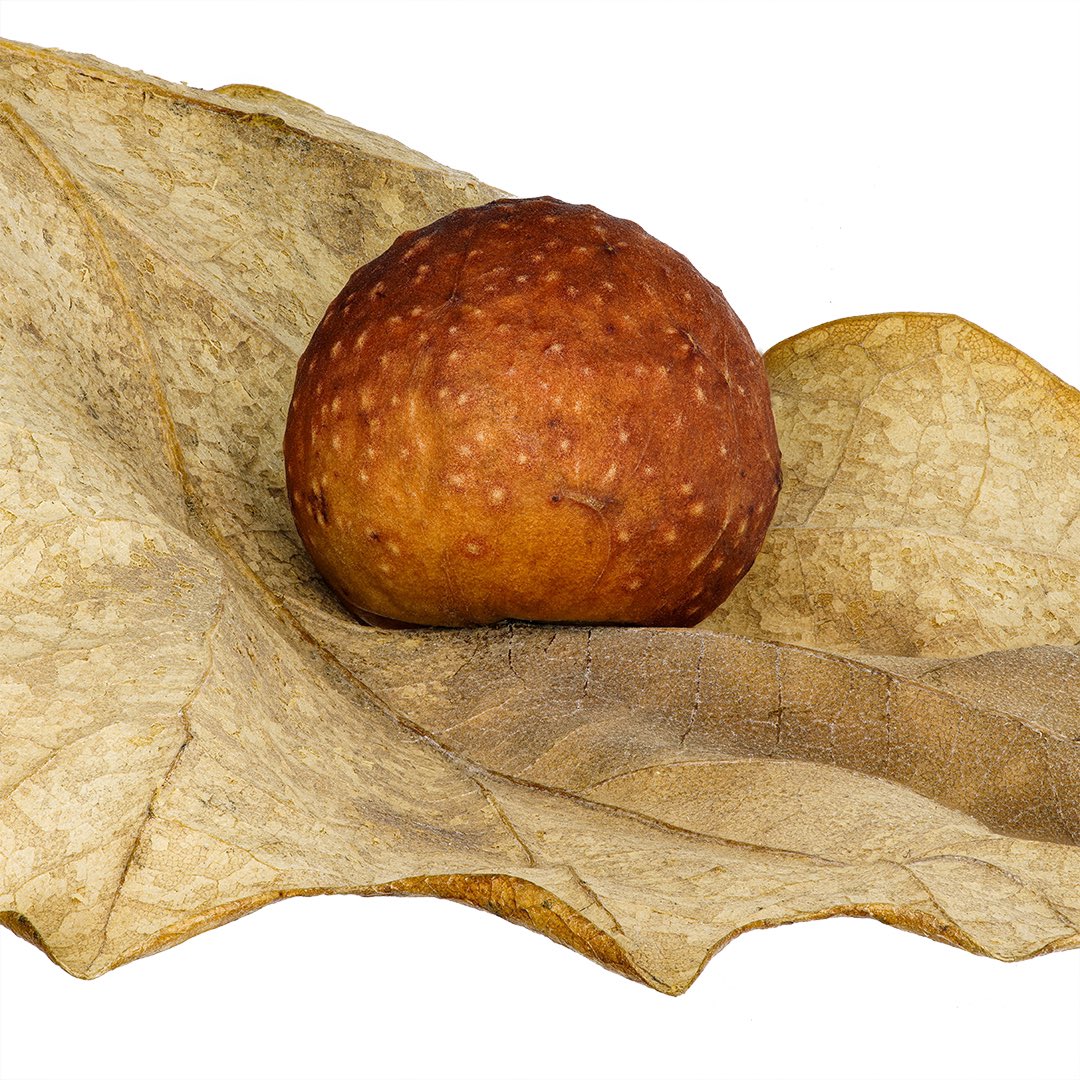
Oak gall or oak apple. A wasp such as the oak gall wasp (Cynips quercusfolii) stings the leaf vein and lays an egg there. A defense reaction of the oak produces this apple around the laying site. The so-called gall ink has been produced from these gall apples since the 3rd century BC. It is considered the most important ink of the Middle Ages and modern times. A large number of official documents were written with it. Such as Magna Carta, Codex Sinaiticus and the Declaration of Independence of the United States of America, the letters of Charles Darwin, the drawings of Leonardo da Vinci, Rembrandt van Rjin and Vincent van Gogh as well as the theories of Isaac Newton. Scores by Johann Sebastian Bach were also put down on paper with this ink.
#gallwespe #eichengalle #gallapfel #oakapple #oakgall #insects #ink #macrophotography #entomology #gallwasp
The Department of Biological Sciences at the University of Notre Dame seeks a broadly trained and innovative bioinformatician at the Assistant Professor of the Practice level to serve in the Genomics and Bioinformatics Core Facility. Learn more and apply: https://t.co/XoWAUnDn6f
Collaborating on #coding projects often requires a great deal of back and forth to exchange ideas.
#GitHub is a popular developer platform for keeping track of changes to your code with the #Git.
Check out my "GitHub Version Control Quick Start Guide"
👉 https://t.co/S6kyj9PrE3
In this blog post, I use our #Bioinformatics#Python tool STalign to align 2 Visium #SpatialTranscriptomics datasets. Since I prefer working in #Rstats I use reticulate to interface with Python from RStudio.
Try it out for yourself: https://t.co/gxDOjhjRwX
#codetutorials
It's raining and our garden is sopping wet. Decided on a springtail hunt nonetheless and was pleased to find this Dicyrtoma fusca. Has an unusual translucent-looking cuticle; perhaps it's had a recent moult. #Collembola#Mesofauna
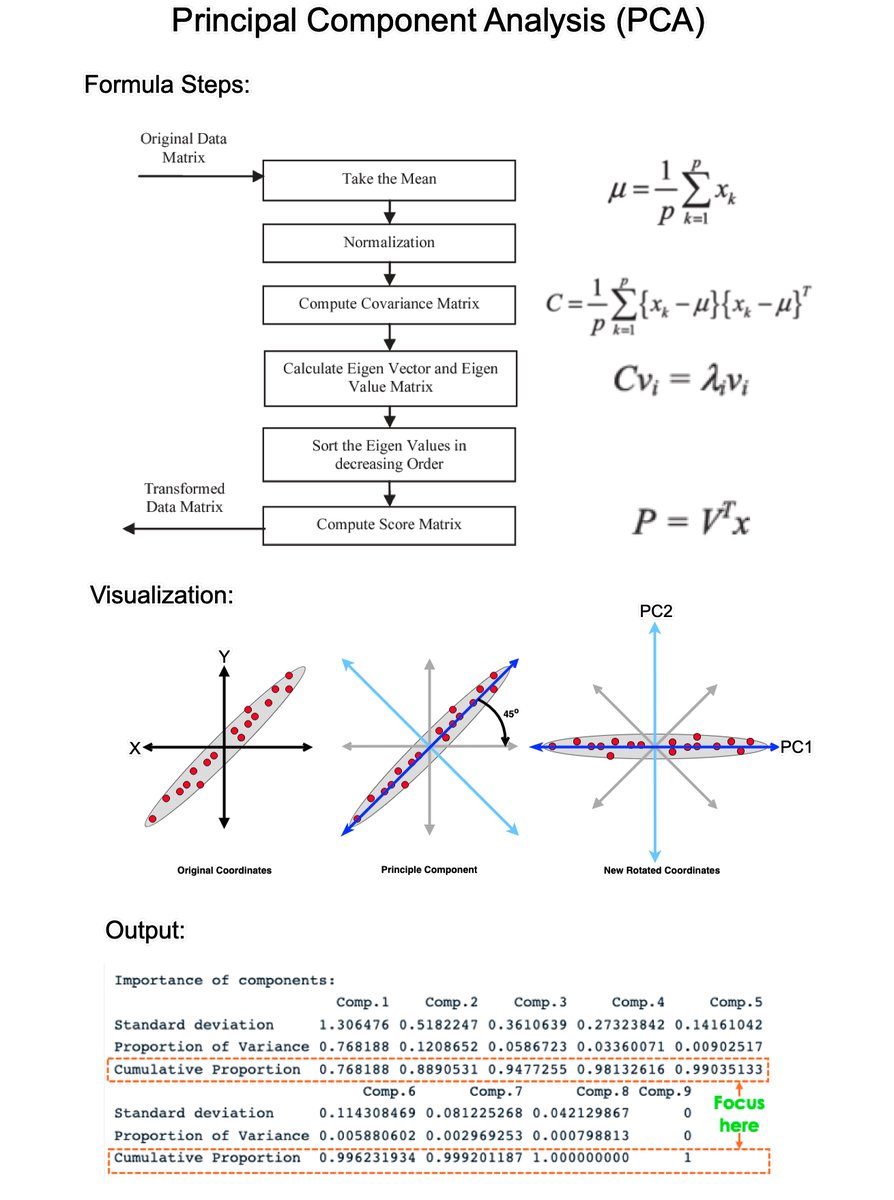
Principal Component Analysis (PCA) is the gold standard in dimensionality reduction with uses in business. In 5 minutes, I'll teach you what took me 5 weeks. Let's go!
1. What is PCA?: PCA is a statistical technique used in data analysis, mainly for dimensionality reduction. It's beneficial when dealing with large datasets with many variables, and it helps simplify the data's complexity while retaining as much variability as possible.
2. How PCA Works: PCA has 5 steps; Standardization, Covariance Matrix Computation, Eigen Vector Calculation, Choosing Principal Components, and Transforming the data.
3. Standardization: The first step in PCA is to standardize the data. Since the scale of the data influences PCA, standardizing the data (giving it mean of 0 and variance of 1) ensures that the analysis is not biased towards variables with greater magnitude.
4. Covariance Matrix Computation: PCA looks at the variance and the covariance of the data. Variance is a measure of the variability of a single feature, and covariance is a measure of how much two features change together. The covariance matrix is a table where each element represents the covariance between two features.
5. Eigenvalue and Eigenvector Calculation: From the covariance matrix, eigenvalues and eigenvectors are calculated. Eigenvectors are the directions of the axes where there is the most variance (i.e., the principal components), and eigenvalues are coefficients attached to eigenvectors that give the amount of variance carried in each Principal Component.
6. Choosing Principal Components: The eigenvectors are sorted by their eigenvalues in descending order. This gives the components in order of significance. Here, you decide how many principal components to keep. This is often based on the cumulative explained variance ratio, which is the amount of variance explained by each of the selected components.
7. Transforming Data: Finally, the original data is projected onto the principal components (eigenvectors) to transform the data into a new space. This results in a new dataset where the variables are uncorrelated and where the first few variables retain most of the variability of the original data.
8. Evaluation: Each PCA component accounts for a certain amount of the total variance in a dataset. The cumulative proportion of variance explained is just the cumulative sum of each PCA's variance explained. Often this is plotted on a Scree plot with Top N PCA components.
====
Ready to learn Data Science for Business?
I put together a free on-demand workshop that covers the 10 skills that helped me make the transition to Data Scientist: https://t.co/6Ji4GtOTzy
And if you'd like to speed it up, I have a live workshop next week where I'll share how to use ChatGPT for Data Science: https://t.co/Ydsmzv7trP
If you like this post, please reshare ♻️ it so others can get value.
Save the date! Seminar by Benoit Morel on "Gene tree inference under gene duplications, gene losses and horizontal gene transfers"
📅Wednesday 29.11 - 12:00 CET
▶ https://t.co/MXpSlhIfRb
#Phylogenomics#Biodiversity#genomics#Data#Analysis#seminars
https://t.co/W4y5TF4l0D