Thank you for the 100k followers!
It is now time for a giveaway! There are 100 10k 2-Step Omo accounts up for grabs
🍊 Follow
🍊 Like
🍊 Repost
For a chance to win. Good luck!
🎉 We just hit 80,000 Discord members!
To celebrate this incredible milestone, we’re giving away 500 x $10,000 Instant Accounts! 🚀
How to enter:
1️⃣ Like & Repost this post
2️⃣ Tag 3 friends
3️⃣ Like & Repost our latest 3 posts
4️⃣ Join our Discord: https://t.co/joHkUQZ1Bb
To qualify, you must also have a registered account on our website.
🏆 Winners announced: 10th August
Good luck to everyone! 🍀
Enter now! 👇
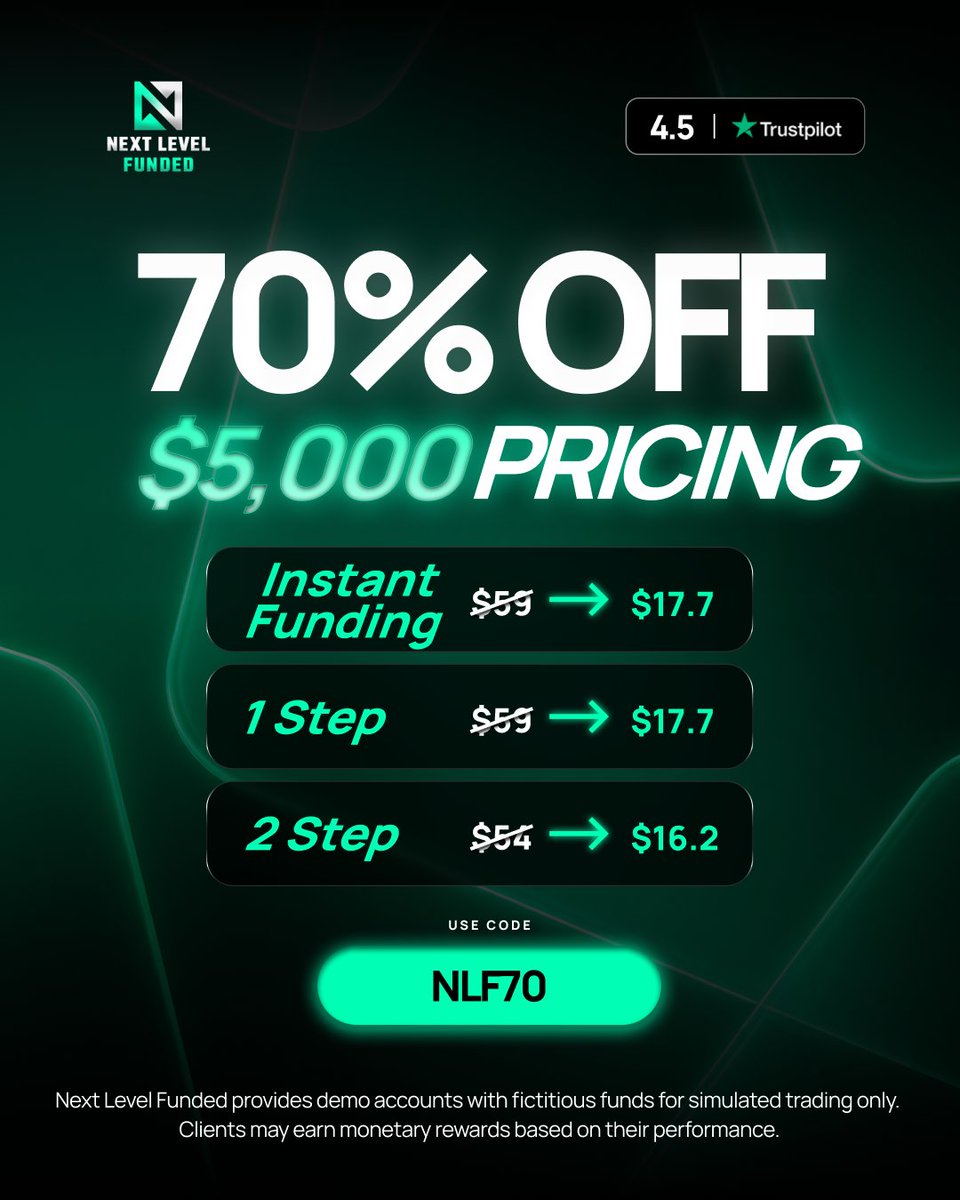
$5k Accounts for Less than $20 🤯
That's right!
70% OFF ALL $5k Accounts 🔥
Use CODE: NLF70 at Checkout to Save today!
Prop Trading has never been this easy to Enter...
Only with https://t.co/16w2bx1dBW
Another NLF $1,000,000 Account Giveaway 🔥
The Rules are Simple...
1. Follow both @NextLvlFunded & @SpencerNLF
2. Engage with our Pinned Post
3. Like, Share & Tag 3 Traders on this Post
Giveaway Ending in 72-Hours!
What I love most about GFT is the simplicity and transparency clear rules, smooth process, and a trader-first environment.
Shoutout to @GoatFunded & @EdwardXLreal for building something truly valuable for the trading community
🔥 BOGO + 40% OFF IS STILL LIVE 🔥
Get 40% OFF + receive a FREE account once you reach your first reward.
Start with any of these:
• 5K Challenge — $17
• 25K Challenge — $88
• 50K Challenge — $172
• 100K Challenge — $274
It will expire soon 🚨
Use code BOGO40 at checkout.
https://t.co/Vqc057y4WE
🔥 BOGO + 40% OFF IS STILL LIVE 🔥
Get 40% OFF + receive a FREE account once you reach your first reward.
Start with any of these:
• 5K Challenge — $17
• 25K Challenge — $88
• 50K Challenge — $172
• 100K Challenge — $274
It will expire soon 🚨
Use code BOGO40 at checkout.
https://t.co/Vqc057y4WE
🚨📱 GFT APP NEWS:
Over 60,000+ GOAT traders
are already using the Goat Funded Trader app to track, manage, and improve their performance.
📊 21K+ on iOS
📊 39K+ on Android
Join the traders already leveling up with GFT.
https://t.co/t15rnKULWS 🐐
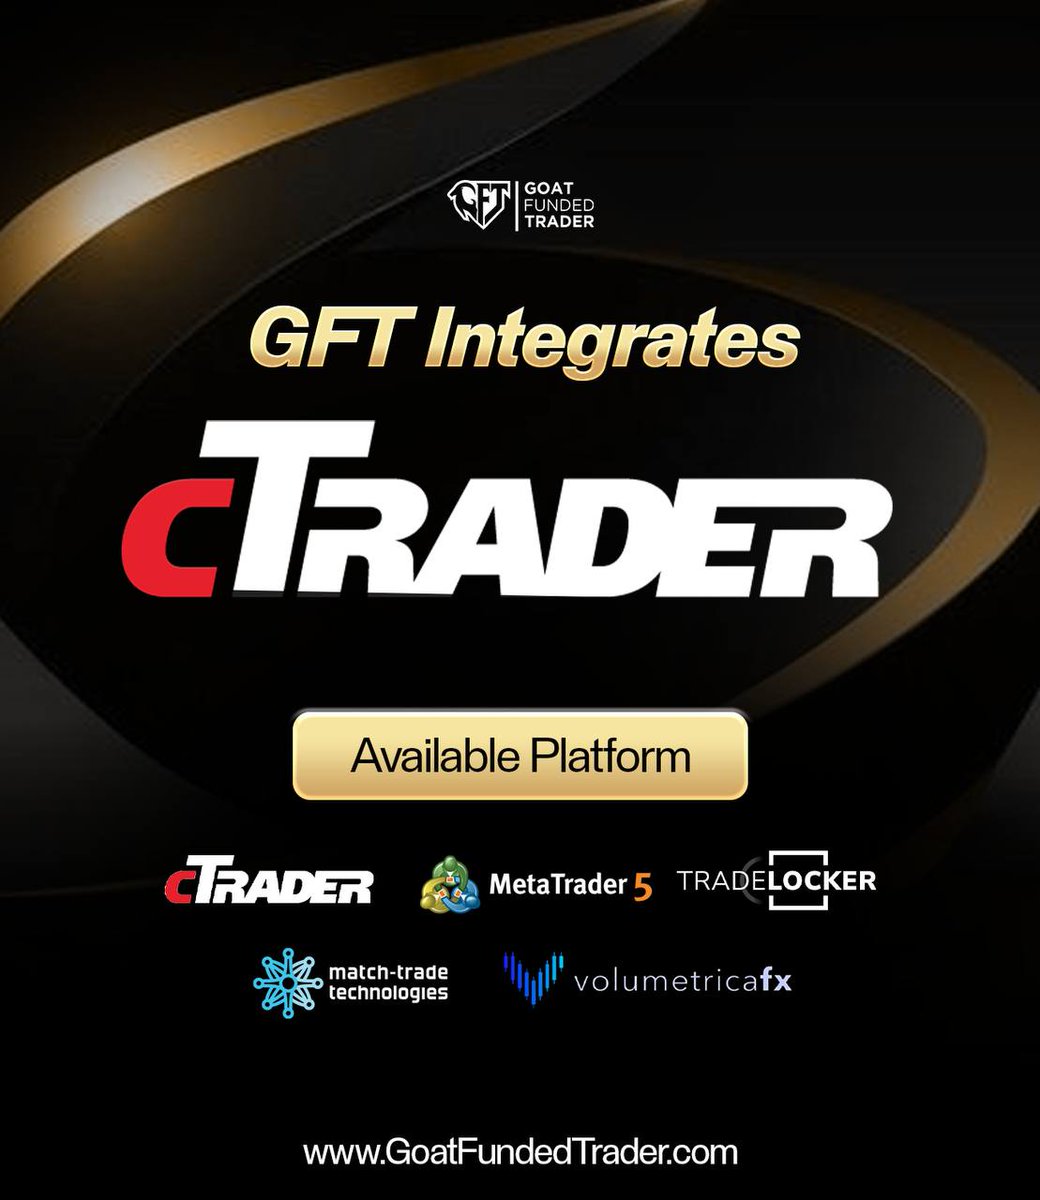
🚨 REMINDER: cTrader IS LIVE AT GFT 🚨
We integrated cTrader a few months ago..
and it’s here to stay.
Trade the way you prefer, on the platform that fits you best:
✅ cTrader
✅ MT5
✅ TradeLocker
✅ MatchTrader
✅ Volumetrica FX
Choose your platform and focus on performance.
🌐 https://t.co/wMzeKhRf1m 🚀
Great experience with the GFT support team fast responses, professional, and always helpful when needed.
Big respect to @Goatfunded & @EdwardXLreal for maintaining such high-quality support for traders 🙌
🎥 Vertical Horizontal Filter (VHF) in cTrader - how it works and how to use it
In this video, we explore the Vertical Horizontal Filter (VHF) in cTrader - an indicator used to assess trend strength and help distinguish between trending and ranging market conditions.
You’ll learn where to find the VHF in cTrader, how to customise its levels and appearance, and how traders use it to evaluate whether market conditions are strengthening or weakening.
We also look at how the VHF compares the price range over a selected period with the cumulative price movement over that same period, helping traders understand whether the market is showing stronger directional movement or moving into weaker, more ranging conditions.
The video also shows how traders may use the VHF to:
• Identify stronger trending conditions when the indicator rises
• Spot weakening or ranging conditions when the indicator falls
• Apply different levels depending on the instrument and market behaviour
• Combine the VHF with other indicators, such as RSI, for additional context
• Consider market conditions when thinking about stop-loss placement
📍 Timecodes
00:09 - Introduction: what is the vertical horizontal filter (VHF)
01:18 - Where to find the VHF in cTrader and how to adjust its settings
02:31 - Using the VHF to identify trending and ranging market conditions
03:12 - Combining the VHF with other indicators and using it in practice
04:21 - Using VHF breakouts to read market conditions
05:05 - Using VHF levels for different instruments and market conditions
- Learn more about the Vertical Horizontal Filter - https://t.co/1BBns7qfUc
- Join Discord - https://t.co/N23Rt86kcx
Don’t forget to like and share your thoughts in the comments!
_____________________________________
👉 Start Trading with cTrader - https://t.co/chQIER1Ve3 👈
🎥 Historical Volatility (HV) in cTrader - how it works and how to use it
In this video, we explore Historical Volatility (HV) in cTrader - an indicator that measures past price fluctuations over a specific period, helping traders understand market variability and risk.
You’ll learn where to find the Historical Volatility indicator in cTrader, how it is calculated using logarithmic price returns, standard deviation and annualisation, and how to customise settings such as standard deviation and bar history.
We also look at how traders use HV to:
• Identify rising volatility and expanding market swings
• Recognise falling volatility and quieter market conditions
• Confirm breakout conditions and trend continuation
• Adjust protection and stop-loss placement based on market volatility
• Combine HV with indicators such as ADX or moving averages
• Use HV in cBots
📍 Timecodes
00:09 – Introduction: what is Historical Volatility (HV)
01:14 – Where to find Historical Volatility and how to customise its settings
01:34 – How Historical Volatility helps identify changing market conditions
02:29 – Using HV to confirm breakouts and trend continuation
03:39 – Using volatility to adjust protection and stop-loss placement
05:08 – Combining HV with other indicators and using it in cBots
- Learn more about the Historical Volatility - https://t.co/ZR04tiGk4N
- Join Discord - https://t.co/N23Rt86kcx
Don’t forget to like and share your thoughts in the comments!
_____________________________________
👉 Start Trading with cTrader - https://t.co/chQIER1Ve3 👈
cTrader: How the forex and gold trading platform protects you from scam
Built on the Traders First™ principle, cTrader sets trusted, reputable brokers and prop firms apart from scammers. This video explains 10 ways cTrader protects traders from manipulative practices and promotes fair, transparent trading.
👉 Start safe trading with cTrader - https://t.co/chQIER1Ve3
🎥 Polynomial Regression Channels (PRC) in cTrader
In this video, we explore the Polynomial Regression Channels (PRC) in cTrader - an indicator that fits a polynomial regression line to recent price data and creates a channel around it to help identify market direction and potential dynamic support and resistance levels.
You’ll learn where to find the PRC in cTrader, how to adjust its settings and appearance, and how the indicator plots a curved, non-linear channel based on recent price data.
We also look at how traders use the PRC to interpret different market conditions. The video shows how the indicator can help identify bullish, bearish and ranging markets, spot overbought and oversold conditions when price moves outside the channel, and analyse pullbacks in trending conditions when price retraces towards the opposite band.
The walkthrough also includes a breakout example, showing how traders may watch for a shift in the channel direction together with price breaking above a prior high.
📍 Timecodes
00:09 – Introduction: what are Polynomial Regression Channels (PRC)
02:00 – Where to find the PRC in cTrader and how to customise its settings
02:27 – Using the PRC to identify bullish, bearish and ranging market conditions
03:07 – Spotting overbought and oversold conditions with the PRC
03:56 – Using the PRC to analyse pullbacks in trending markets
04:30 – Reviewing a breakout example with the PRC
- Learn more about the Polynomial Regression Channels - https://t.co/74uZpDlvQI
- Join Discord - https://t.co/N23Rt86kcx
Don’t forget to like and share your thoughts in the comments!
_____________________________________
👉 Start Trading with cTrader - https://t.co/chQIER1Ve3 👈