O "iPHONE MOMENT" DO CRÉDITO DIGITAL ACABOU DE ACONTECER
A Strategy comprou 22.337 BTC essa semana.
$1,58 bilhão. Uma das maiores compras semanais da história do Saylor.
Mas o número que NINGUÉM está discutindo é de onde veio o dinheiro.
Aqui está o que mudou:
→ Semana de 23/fev: STRC financiou $7M de $237M totais. 3% do capital.
→ Semana de 2/mar: STRC financiou $377M de $1,28B. 30% do capital.
→ Semana de 9/mar: STRC financiou $1,18B de $1,58B. 75% do capital.
Leia isso de novo.
Em três semanas, o STRC foi de erro de arredondamento a motor principal de aquisição de Bitcoin. A ação comum — MSTR — contribuiu apenas $396M. Um quarto do total.
Isso não é uma compra de Bitcoin. Isso é uma mudança de regime no mercado de capitais.
O STRC é preferred stock com yield de 11,5% ao ano, lastreado pelo maior tesouro corporativo de Bitcoin do planeta. É renda fixa. Investidores de crédito — fundos de pensão, seguradoras, family offices conservadores — estão INUNDANDO esse instrumento.
A matemática é implacável:
→ 761.068 BTC. 3,62% de todo Bitcoin que vai existir. Numa única empresa.
→ $1,18B em crédito digital levantado numa semana. Recorde absoluto do STRC.
→ Ainda restam $1,97B disponíveis pra emissão de STRC. E $20,3B em STRK.
→ Capacidade total restante no ATM: +$34 bilhões.
O que você testemunhou não foi Saylor comprando mais Bitcoin.
Foi o mercado de renda fixa tradicional abrindo uma porta que não fecha mais. Capital que NUNCA tocaria em Bitcoin diretamente está entrando pelo crédito digital a 11,5% de yield — e cada dólar desse se transforma em $BTC no balanço da Strategy.
Esse é o flywheel:
mais BTC → mais colateral → mais capacidade de emissão de preferred → mais BTC.
E o apetite do mercado por esses instrumentos está acelerando, não desacelerando.
Quando o mercado de crédito financia a acumulação de Bitcoin em escala de bilhão por semana, a tese mudou.
Não é mais sobre se instituições vão adotar Bitcoin.
É sobre a velocidade com que o mercado de renda fixa está sendo convertido em reserva digital.
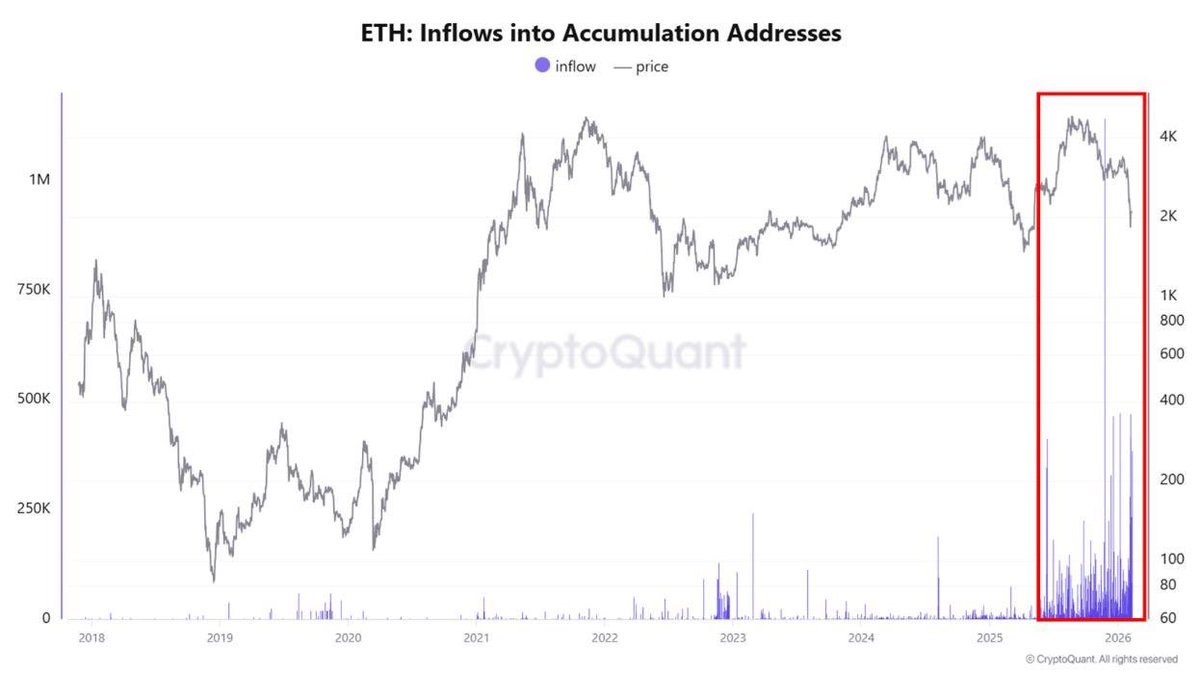
Ethereum investors are accumulating $ETH at the fastest pace in history.
Inflows into accumulation addresses have surged to record levels, signaling strong conviction from long-term holders.
Supply is moving into stronger hands, a constructive setup for future price expansion.
The US government shutdown is coming to an end.
Longest in history, but now a deal is on the table.
Once the House votes and the government reopens, nearly $1T locked in the TGA can start flowing back into markets.
Trump is also pushing for $2,000 “dividend” payments to every American.
If the stimmy money hits the market, we all know how this story plays out.
ETHEREUM transaction count just hit 1.7M per day!🎉
For 4 years, it was stuck below 1.2M. Now it just broke through.
And it's happening right as ETH price pushes toward all-time highs!📈
Almost nobody is paying attention.
🔹 Processing 1.6-1.7M transactions per day right now
🔹 Breaking through a ceiling that held since 2022
🔹 Momentum accelerating alongside the price rally
Look at the blue line. From 2022 through early 2025, ETH transactions were trapped between 900k and 1.2M per day.
For years, the network couldn't break above that level. Until now. We just smashed through it.
Here's the crazy part. During the March crash when ETH was bleeding and everyone was panic selling, the network was already doing 1.2M transactions per day. Go back to January 2023?
We could barely hit 1M.
🔹 January 2023: 1M transactions per day
🔹 March 2025 crash: 1.2M per day
🔹 Today: 1.6-1.7M and climbing fast
While price rallies toward ATH:
🔹 Network activity surging in parallel
🔹 DeFi expanding rapidly
🔹 Transaction momentum breaking multi-year resistance
🔹 Fundamentals confirming the price move
Think of it like a restaurant. If foot traffic breaks out of a multi-year range and starts climbing as business improves, you know real growth is happening. Revenue follows customers.
Ethereum works the same way. Network activity and price moving together is the strongest confirmation you can get.
The setup right now:
🔹 Transaction count: breaking out of 4-year range ✅
🔹 Price: approaching all-time highs ✅
🔹 Both moving in sync: momentum aligned ✅
When network usage breaks through multi-year resistance at the same time price is rallying, that's not a coincidence. That's confirmation.
The fundamentals are backing up the price action!
Most people talk about Ethereum. Few look at what's actually happening on the network.
But that's where the truth is. Not in narratives. In the data.
And right now?
Network activity and price momentum are telling the same story.📈
ACCELERATE. $ETH
🚨ETHEREUM exchange reserves are DRAINING!🚨
...again!
And the last two times this happened, explosive rallies followed.📈
Let me walk you through the chart and what it's telling us:
The blue line shows ETH reserves sitting on spot exchanges. The white line is ETH price. One can see three critical periods where reserves dropped hard.
Period 1 (2020-2021):
🔹 Reserves falling from 16M to 10M ETH
🔹 Price staying relatively flat during the drawdown
🔹 Network congestion and high gas fees dominating headlines
🔹 Then UNI airdrop + macro easing triggered demand
What happened next? ETH went from ~$400 to $4,800!
The supply had already left exchanges, so when buyers showed up, there was nothing to absorb the pressure.
Period 2 (2022-2023):
🔹 Reserves dropped from 15M to 9M ETH
🔹 This was late bear market - FTX collapsed, banks were failing
🔹 Price chopped sideways while reserves bled out
🔹 Most of this was old holders moving to self-custody
Then macro conditions improved slightly and ETH rallied from $1,100 to $4,000. Again, the supply drain set the stage.
Period 3 (NOW):
🔹 Reserves currently at historic lows near 9.2M ETH
🔹 Price consolidating around $1,900-2,000
🔹 ETH is leaving exchanges but price isn't moving yet 🔹 This tells us: buying is happening, but selling is absorbing it
Here's the pattern: reserves fall first, price follows later.
The lag time can be months, but when demand triggers, the move is violent because there's no liquidity left on exchanges.
Think of it like draining water from a bathtub. If you keep the drain open (ETH leaving exchanges) but the water level stays the same (flat price), it means new water is flowing in (buying) at the same rate old water leaves (selling).
BUT eventually, the sellers run out. When that happens and the tap opens (demand catalyst), the tub overflows fast.
What's missing right now? The demand catalyst.
🔹 Rate cuts continuing
🔹 Global M2 liquidity expanding
🔹 No major recession shock
🔹 Institutional AND retail capital returning
If these play out, we're looking at the same setup as periods 1 and 2.
The pattern is clear.
Reserves drain → price consolidates → demand triggers → violent rally.
The consolidation phase seems to be over.
The supply is gone.
Uncharted territories incoming! 🚀
MM: Esta descarga foi trazida a você pela Binance usando a Wintermute. Todas as linhas vermelhas (100x) removidas no Bitcoin, todas as amarelas (50x) removidas em $SOL e $XRP, todas as azuis (25x) removidas em $SUI, $ETH e $HYPE - quase nada foi descarregado em $BNB, o próprio token deles.