Stablecoin and Global Liquidity Recovery: The Catalyst for the next Crypto Rally?
What Will You Discover today?
1. Understanding the Significance of Liquidity for Bitcoin and the broader Crypto Market
2. Gearing up for a Stablecoin Liquidity Game-Changer as the Tokenization of U.S. Treasury Bonds accelerates.
Let’s dive in.
1. Why Stablecoin Liquidity and Global Liquidity matter for Bitcoin and the rest of the crypto market
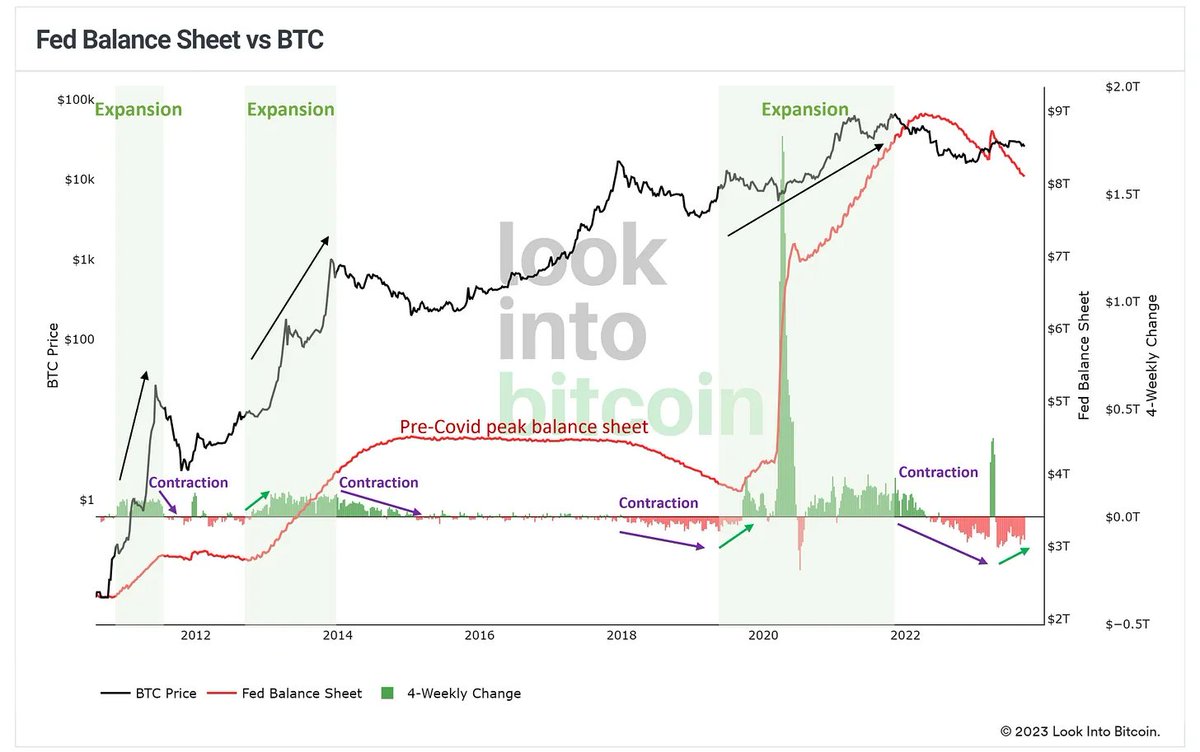
Within both traditional finance and the rapidly evolving world of cryptocurrencies, liquidity plays a pivotal role in ensuring market stability and fostering growth. The chart provided illustrates a compelling correlation: as the Federal Reserve's balance sheet expands, Bitcoin and other cryptocurrencies typically witness a price surge.
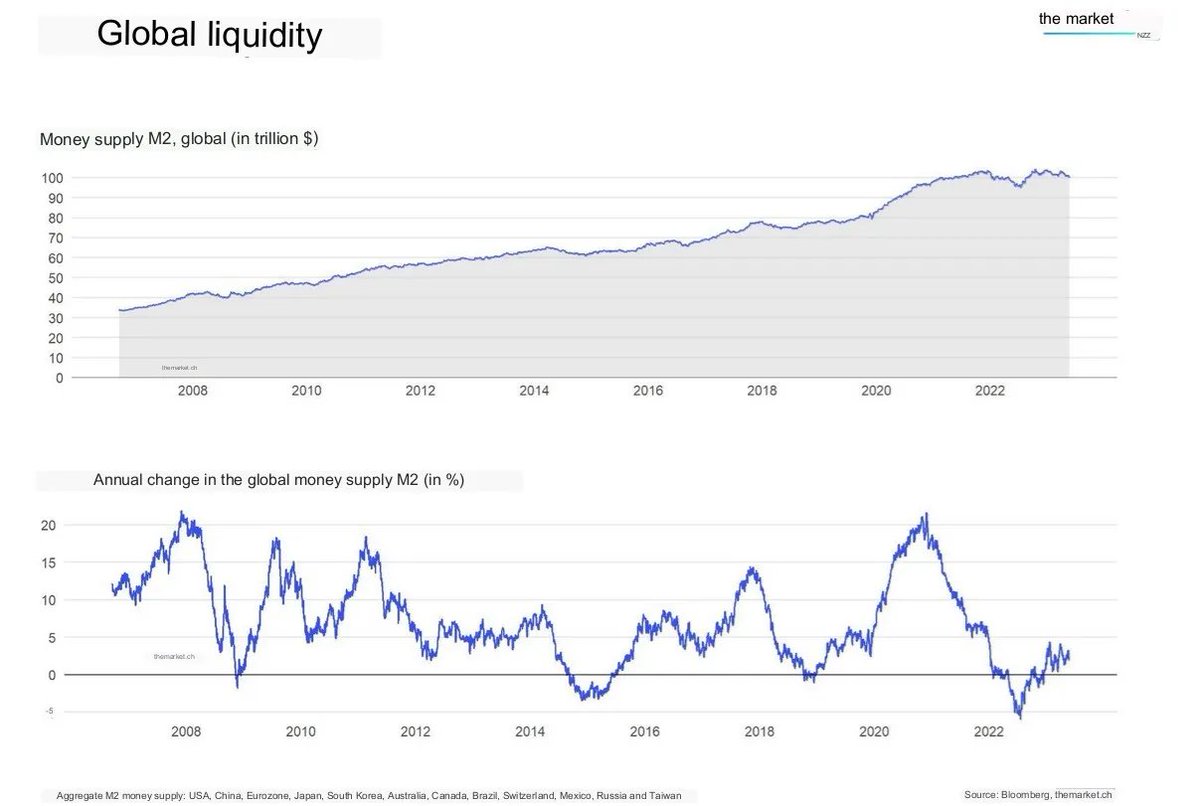
Zooming into today’s global liquidity picture, defined by the M2 metric, that combines all important money supply indicators across the globe, we're seeing a trend tilting towards a decline. This has placed Bitcoin and its crypto contemporaries in a somewhat muted phase.
Diving a bit deeper, a mirroring trend emerges on blockchain networks within the total Stablecoin market cap, or what can be likened to cryptos' "M2" indicator.
Post-April 2022, this Stablecoin metric dipped by a staggering $43 billion and is presently finding its feet just above the $120 billion threshold.
For the crypto giants like Bitcoin and its peers to gain traction again, a rejuvenation of liquidity is non-negotiable. Where do we stand in the current liquidity cycle, and what could potentially drive a resurgence in Stablecoin Liquidity?
Market Momentum Gearing Up for a 2024 Rebound📈
In the midst of prevailing uncertainty, there emerges a beacon of hope. Both the central banks' balance sheets and the Stablecoin market cap are showcasing a diminishing rate of decline. This points towards a potential relaxation in the liquidity crunch, hinting that the worst is behind us. Delving into the global money supply, specifically the M2 metric, we can already notice a positive shift. Globally, the growth rate of the money supply has swung back into positive territory.
In the past, global M2 growth and especially the expansion of the Fed's balance sheet led to a higher Bitcoin price and initiated the next bull market for cryptocurrencies.
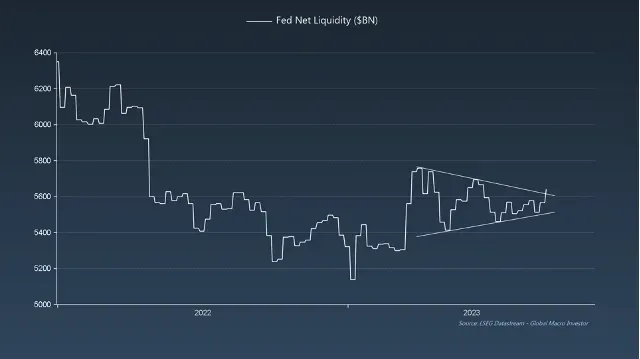
Building upon this, and recent developments in the Fed Net Liquidity, which is calculated as Net Liquidity = Fed Balance Sheet - (TGA + Reverse REPO), indicate that more liquidity is flowing into the markets. This influx lays the foundation for potential growth in asset prices soon.
If this positive trajectory maintains its course or even amplifies, several indicators point towards a significant liquidity revival on the horizon for 2024.
2. U.S. Treasury Bonds Tokenization and a new era for Stablecoin Liquidity
Turning our gaze to the cryptocurrency market, we can observe that while the (TVL) in DeFi, including liquid staking, has been fairly steady around the $60 billion mark, there are early signs of a stabilization of the stablecoin market cap. Since April 2022, the stablecoin market cap declined by -26%, but this decline seems to come to an end and over the last few weeks the stablecoin market cap has been stabilizing above the $120 billion dollar mark. This could be a signal for a potential revival in on-chain liquidity and a resurgence of investors’ interest.
This development is perhaps primarily driven by the ongoing tokenization of Real-World Assets (RWAs), that are used to back Stablecoins. For example, MakerDAOs DAI has been growing by over $1 billion since May and more and more Real-World Assets (especially U.S. Treasuries) are being used to back the Stablecoin to produce a yield of around 5% each year for everyone, who decides to lock their DAI into the Spark Protocol. The source of the yield can be verified on-chain and is generated by a mix of RWAs, staked Ethereum and other yield bearing assets.
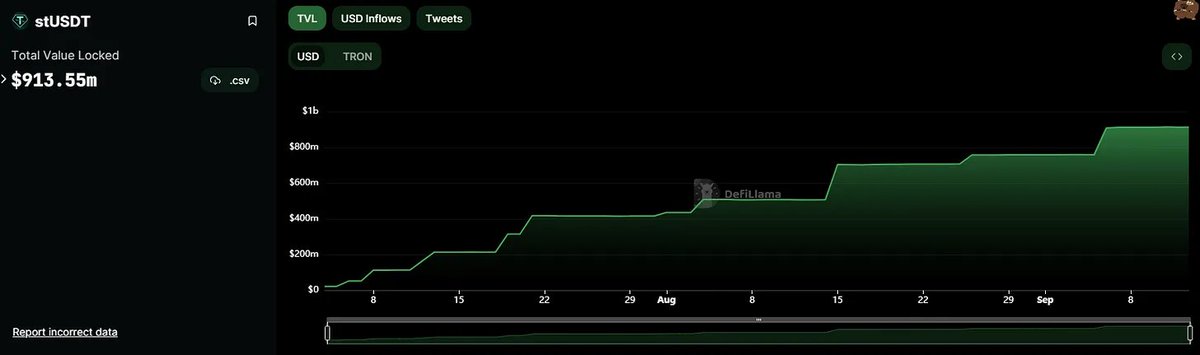
Tether's stUSDT stands out as another prime exemplar—a staked USDT iteration backed by RWAs, such as U.S. Treasuries, boasting an annual yield of around 4%-5%. The stUSDT's market cap has been on an upward trajectory, currently hovering around the $1 billion milestone.
Stablecoin yields seem to finally become competitive again due to more and more RWAs being tokenized on blockchain networks. Examining the overarching RWAs sector, a pronounced surge is palpable, potentially signaling a liquidity reentry into crypto markets.
This burgeoning on-chain evolution could herald the inception of a keenly awaited liquidity influx, essential for a lasting upswing in crypto asset values.
While Bitcoin and Ethereum might witness minor retractions in their valuations, my bullish stance remains unshaken. The wider lens—spanning both traditional finance and on-chain indicators—paints a promising future tableau. From both a traditional and on-chain liquidity perspective, the crypto market's current risk-reward profile is arguably one of the most enticing we've encountered in recent memory.
Remember, clarity and insights are paramount in our rapidly evolving financial landscape. Stay tuned for more in-depth analyses in subsequent publications.
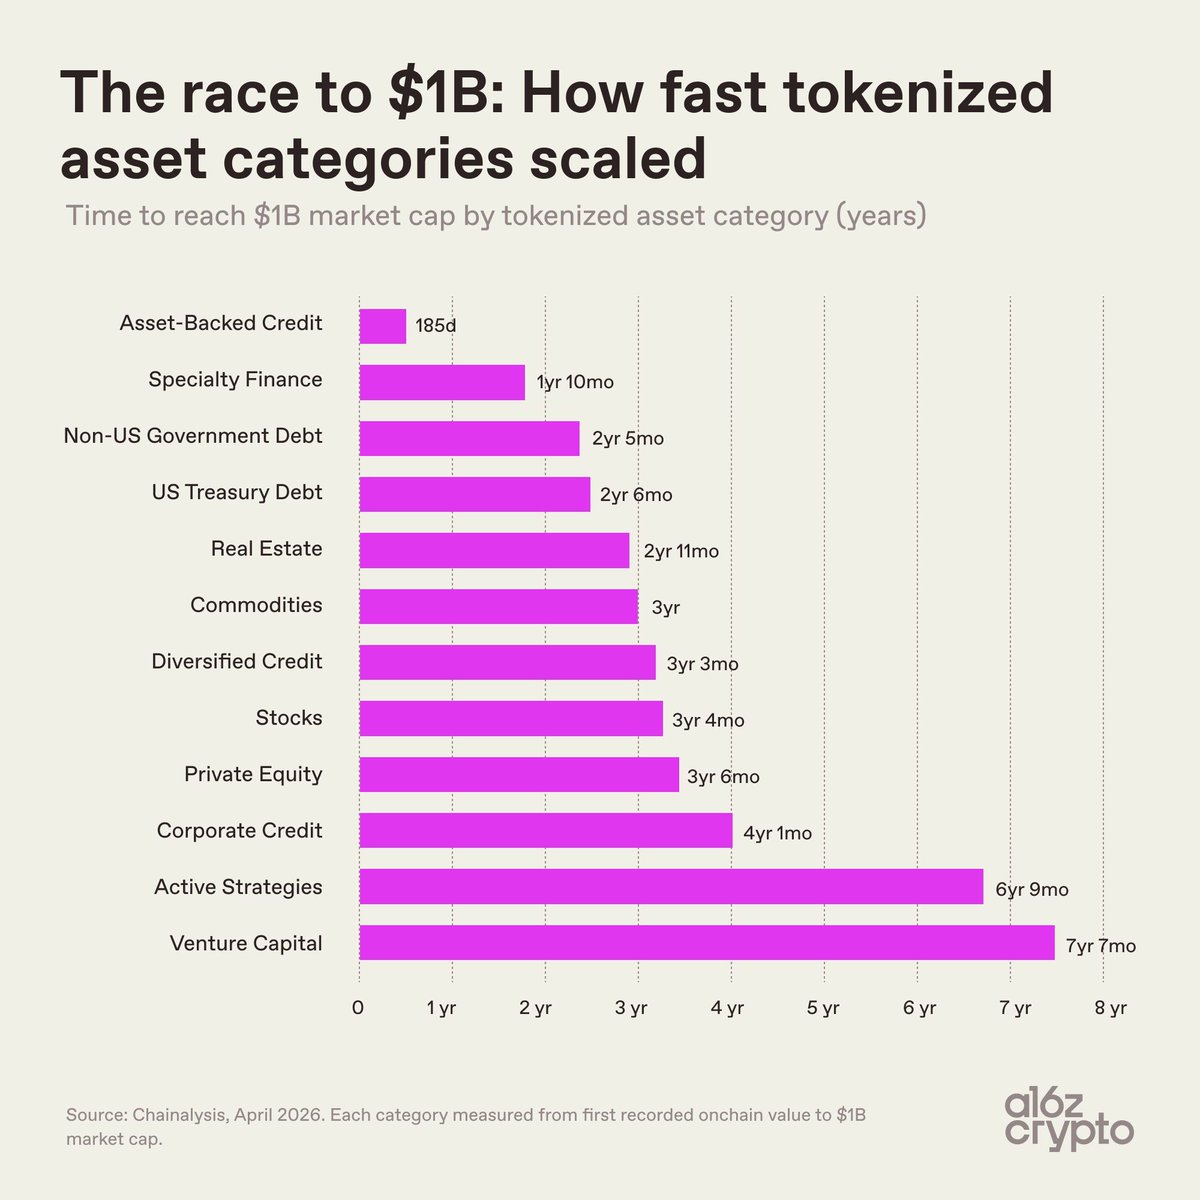
Tokenized assets are already a $34B market.
But the path to $1B looks very different by category.
Fastest to $1B:
🔹 Asset-backed credit: 185 days
🔹 Specialty finance: 1y 10m
🔹 Non-US government debt: 2y 5m
🔹 U.S. Treasury debt: 2y 6m
🔹 Real estate: 2y 11m
🔹 Commodities: 3y
Slowest:
🔹 Active strategies: 6y 9m
🔹 Venture capital: 7y 7m
➡️ The fastest categories are the ones with clear pricing, strong demand, and obvious onchain utility.
While most L2s are bleeding users, @Celo is up +41% over the past year! 📊
🔹 Celo: +41% 🟢
🔹 Ethereum: +23% 🟢
🔹 Polygon: +1.5%
🔹 Arbitrum: -44% 🔴
🔹 Base: -82% 🔴
🔹 OP Mainnet: -89% 🔴
Almost every chain shed users in the last 365 days.
Only a handful actually grew, and Celo leads them.
One honest note: the last 30 days cooled off (-20%), so the near-term momentum has softened.
But on the annual trend, Celo is firmly pointing up.
Real usage is consolidating onto the chains people actually want to use. 📈
Data via @growthepie_eth
ETH price is stuck near $1.9K. Everyone's bearish.
The onchain data tells the opposite story! 📊
🔹 ETH on exchanges: crashing to ~15.1M (multi-year low)
🔹 Staking rate: fresh ALL-TIME HIGH at 32.42%
🔹 Transactions: ALL-TIME HIGH
Less ETH on exchanges = less supply to sell.
More ETH staked = more supply locked away.
Holders aren't selling. They're accumulating and committing.
Price follows sentiment short term.
Onchain follows behavior.
Right now they point in opposite directions.
Data via @cryptoquant
Tokenized funds on Ethereum today: $19.3B.
Where they could land by 2029 according to @tokenterminal
🔹 Bear: $100B (+400%)
🔹 Base: $250B (+1,150%)
🔹 Bull: $500B (+2,400%)
Ethereum staking rate just broke another all-time high.
32.42% of all ETH is now locked and staked! 📈
Price fell while staking climbed.
🔹 Staking rate: fresh ATH at 32.42%
🔹 ETH price: down toward ~$1.9K
🔹 Stakers added through the drawdown, not the rally
Every staked ETH is supply pulled off the market and put to work securing settlement.
Data via @cryptoquant
Every major tokenized fund picked the same chain! 📊
The institutional roster, in order of arrival:
🔹 1. BlackRock BUIDL
🔹 2. Fidelity FDIT
🔹 3. J.P. Morgan MONY
🔹 4. BlackRock OnChain Shares (just filed)
All on Ethereum. Tokenized fund value there: $19.3B, from near 0 in two years.
Data via @tokenterminal
$308.6B in stablecoins live across 40 chains. One holds the majority! 💵
Stablecoin supply by chain:
🔹 1. Ethereum: $179.2B (58%)
🔹 2. Tron: $90.2B (29%)
🔹 3. Solana: $13.7B (4.4%)
🔹 4. Arbitrum: $6.9B (2.2%)
🔹 5. Base: $4.6B (1.5%)
Two chains hold 87% of all onchain dollars!
Data via @tokenterminal
Ethereum moves $55B in tokenized fund value a month.
Solana moves a fraction of that, BUT with nearly 3x the transfers!
🔹 Ethereum: highest value moved, far lower transfer count
🔹 Solana: ~420K transfers, tiny volume
🔹 The going rate: roughly $0.40 per transfer
So Ethereum wins the dollars but earns little directly. Big balances sit still.
They don't generate fees until they actually move.
The bottleneck isn't AUM, it's velocity.
Until tokenized shares change hands often, the base layer barely captures the upside!
Data via @tokenterminal
neobanks are being squeezed from two directions.
from the top, fintechs are pursuing bank charters to capture the economics they used to rent from sponsor banks: deposits, net interest income, payment access, and regulatory legitimacy.
from the bottom, stablecoins and public blockchains are rebuilding parts of the financial stack as open, programmable rails.
the result is compression.
the fat app thesis worked here, with the old neobank model being mostly a distribution layer:
- app + brand + customer relationship
- no balance sheet
- no direct rail access
- no deposit economics
the winning playbook is to own the economics. banking value does not accrue primarily to ux. it accrues to monetizable control points across store > move > grow > borrow money, such as:
- deposits
- credit
- settlement
- compliance
- liquidity
- customer trust
a neobank without these is just a frontend with rented economics.
this is why charters matter. a charter turns a neobank from a customer-acquisition machine into a balance-sheet business.
but charters are only half the story.
stablecoins attack the same stack from below by making settlement global, programmable, and cheaper. they weaken the monopoly of gated rails like ach, swift, and correspondent banking.
so the winning model is hybrid financial infrastructure: a mix of tradfi + crypto.
- regulated balance sheet where trust is required
- blockchain rails where speed and programmability matter
- defi protocols where financial products can be composed
- consumer apps where the relationship is owned
the future neobank is therefore not just a bank app.
most fintechs monetize only one layer. the trillion-dollar neobank captures all four.
this creates clear winners and losers.
winners:
- chartered fintechs
- crypto exchanges with distribution
- wallets that become financial apps
- defi protocols with real integrations
- stablecoin rails embedded into consumer finance
losers:
- middleware-dependent neobanks
- remittance firms relying on fx spreads
- wallets with no monetization
- banks with legacy ux
- defi protocols with no distribution
financial infrastructure is becoming more modular at the backend, but more consolidated at the frontend.
users will not care whether yield comes from a bank deposit, tokenized t-bills, @aave, @Morpho, or a stablecoin vault.
they will care about one thing if the app can be trusted to help them store, move, earn, borrow, and spend money better than their bank.
that is the endgame.
the bank account becomes a wallet.
the wallet becomes a bank.
the winner owns the interface between regulated finance and permissionless rails.
everything else is rented infrastructure.
Ethereum moves $55B in tokenized fund value a month.
Solana moves a fraction of that, BUT with nearly 3x the transfers!
🔹 Ethereum: highest value moved, far lower transfer count
🔹 Solana: ~420K transfers, tiny volume
🔹 The going rate: roughly $0.40 per transfer
So Ethereum wins the dollars but earns little directly. Big balances sit still.
They don't generate fees until they actually move.
The bottleneck isn't AUM, it's velocity.
Until tokenized shares change hands often, the base layer barely captures the upside!
Data via @tokenterminal
Tokenized assets are still only ~$34B today!
But major institutions expect this market to explode:
🔹 @McKinsey: $2-4T by 2030
🔹 @Citi: $5-6T by 2030
🔹 @BCG / @Ripple: $9.4T by 2030
🔹 @ARKInvest: $11T by 2030
🔹 @BCG / @Ripple: $18.9T by 2033-34
🔹 @StanChart: $30.1T by 2033-34
That means forecasts range from ~60x to almost 900x growth from today.
The exact number does not matter.
The direction does.
Tokenized assets are moving from niche crypto rails to global financial infrastructure.
$308.6B in stablecoins live across 40 chains. One holds the majority! 💵
Stablecoin supply by chain:
🔹 1. Ethereum: $179.2B (58%)
🔹 2. Tron: $90.2B (29%)
🔹 3. Solana: $13.7B (4.4%)
🔹 4. Arbitrum: $6.9B (2.2%)
🔹 5. Base: $4.6B (1.5%)
Two chains hold 87% of all onchain dollars!
Data via @tokenterminal
Tokenized assets are no longer just Treasurys and gold.
They still dominate.
But the market is clearly diversifying.
At ~$34B total market size:
🔹 U.S. Treasurys remain the largest category
🔹 Commodities are still a major share
🔹 Asset-backed credit is growing fast
🔹 Special finance is gaining share
🔹 Stocks, non-US gov debt, and active strategies are emerging
The key shift:
In early 2024, tokenized assets were almost entirely Treasurys + commodities.
Today, new categories are taking real share.
Tokenization started with the easiest assets.
Now it is moving into the broader financial system.
Every major tokenized fund picked the same chain! 📊
The institutional roster, in order of arrival:
🔹 1. BlackRock BUIDL
🔹 2. Fidelity FDIT
🔹 3. J.P. Morgan MONY
🔹 4. BlackRock OnChain Shares (just filed)
All on Ethereum. Tokenized fund value there: $19.3B, from near 0 in two years.
Data via @tokenterminal
Ethereum staking keeps climbing higher! 📈
🔹 39.15M ETH is now staked
🔹 That equals 32.16% of total ETH supply
Nearly one-third of all ETH is now securing the network 👏
Tokenized assets are already a $34B market.
But the path to $1B looks very different by category.
Fastest to $1B:
🔹 Asset-backed credit: 185 days
🔹 Specialty finance: 1y 10m
🔹 Non-US government debt: 2y 5m
🔹 U.S. Treasury debt: 2y 6m
🔹 Real estate: 2y 11m
🔹 Commodities: 3y
Slowest:
🔹 Active strategies: 6y 9m
🔹 Venture capital: 7y 7m
➡️ The fastest categories are the ones with clear pricing, strong demand, and obvious onchain utility.
Ethereum staking keeps climbing higher! 📈
🔹 39.15M ETH is now staked
🔹 That equals 32.16% of total ETH supply
Nearly one-third of all ETH is now securing the network 👏