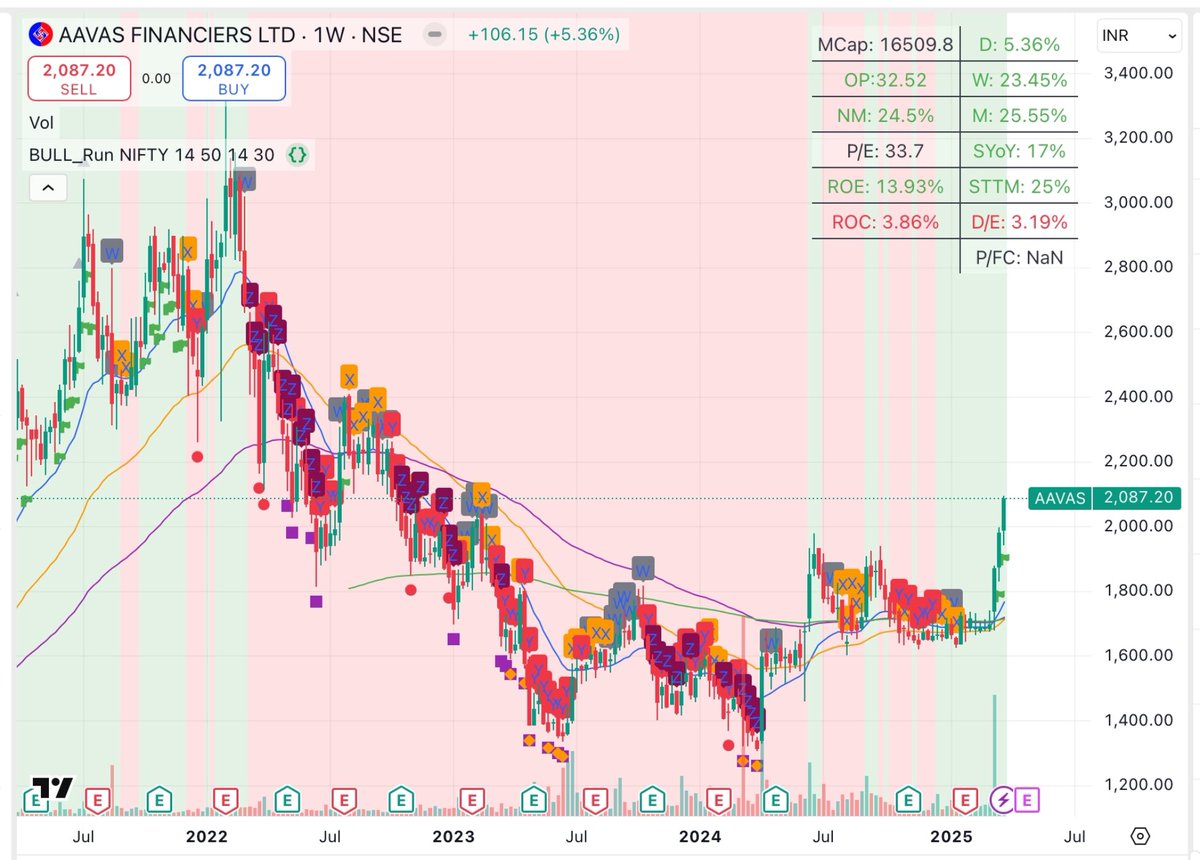
🚀 Unlock Your Trading Potential!
Introducing the Stage 2 Indicator on TradingView! 📈
This powerful tool helps you minimize drawdowns and maximize gains by identifying key breakout points. Say goodbye to portfolio stress #Stage2Indicator#TradingSuccess#InvestSmart#stock
@Uber_Support@Uber_India Shakurbasti railway station to gurgaon fare shown 574 and later doubled to 1151 at drop.. no change in pickup and drop location Is it some #scam operated by uber and it’s drivers. #BharatTaxi
Focus on high-margin products (coils, transformers)
- Enhanced ESG and operational excellence
- Long-term contract wins in HVDC/FACTS sectors
- Internal funding for capex; strategic M&A
- Investment in grid modernization R&D
*Potential market cap of ~₹34,300 Cr by FY30
## QPOWER 5-Year Outlook 🚀
- Revenue to grow from ₹392 Cr (FY25) to ₹2,008 Cr (FY30)
- PAT (Net Profit) to rise from ₹100 Cr to ₹361 Cr
- Aggressive capacity expansion (Sangli, Cochin, Mehru plants)
- Strong order book and pipeline for FY26
What is the paper Gold and Real Gold supply issue...
Real Gold in existence : 200K Metric tonnes
Paper Gold contracts : 4.39M Metric tonnes or more than 22 times the underlying.
While not all paper contracts will ever stand for delivery, this 22:1 and more ratio is susceptible to a squeeze anytime. On top of that very small amount of actual physical gold is available for delivery.
But you can start to see the issue here!
*********************
Assumptions in coming up with these nos is listed below with Groks help.
1. Physical Gold Supply
Physical gold supply refers to the actual gold that exists in the world, including mined gold held by central banks, investors, and in jewelry or industrial use. Based on the web results and industry estimates:
Total Physical Gold Stock: Web ID 3 (Europhoenix, 2020) estimates the total value of physical gold at around USD 11 trillion in 2020. To estimate the physical quantity, we need the gold price at that time. In 2020, the average gold price was approximately $1,770 per ounce (a rough average based on historical data). Using this:
Total ounces = $11 trillion ÷ $1,770 per ounce = ~6.21 billion ounces.
This translates to roughly 193,000 metric tons (since 1 metric ton = 32,150 troy ounces).
This figure aligns with estimates from the World Gold Council, which reported around 190,000–200,000 metric tons of above-ground gold stocks by 2020, including jewelry (about 50%), investor-held gold (bars, coins, ETFs), central bank reserves, and industrial use.
Central Bank Holdings: Web ID 3 mentions that central bank holdings are a significant portion of this total. As of 2025, central banks hold around 35,000 metric tons of gold (based on World Gold Council data, which reported 34,000 tons in 2020, with steady accumulation since). This is about 18% of the total physical supply.
Annual Production: Web ID 2 (Intelligent Partnership, 2016) notes that annual physical gold production was around 2,700 metric tons per year in 2011 (5,400 tons over two years). By 2025, global gold production has hovered around 3,000 metric tons annually (World Gold Council data), adding to the total stock each year.
So, as of 2025, the total physical gold supply is likely around 200,000 metric tons, or roughly 6.43 billion ounces, assuming modest growth in stocks since 2020 and a current gold price of around $2,600 per ounce (a reasonable estimate for early 2025 based on market trends).
2. Paper Gold Contracts
Paper gold refers to financial instruments like futures, options, ETFs, and other derivatives that represent gold but are not necessarily backed by physical gold on a 1:1 basis. The X post and web results highlight the disparity between paper contracts and physical gold.
Total Paper Gold Value: Web ID 3 estimates the value of paper gold (ETFs, futures, options, etc.) at USD 200–300 trillion in 2020. Let’s take the midpoint of $250 trillion for simplicity. Using the 2020 gold price of $1,770 per ounce:
Total paper gold in ounces = $250 trillion ÷ $1,770 per ounce = ~141 billion ounces.
This is equivalent to 4.39 million metric tons of gold—far exceeding the physical supply.
COMEX and LBMA Volumes: The X post specifically mentions COMEX, a major gold futures exchange under CME Group (Web ID 0). Web ID 2 provides historical context:
The LBMA Liquidity Survey (Q1 2011) reported 173.7 million ounces (5,400 tons) of paper gold traded per day, with only two-thirds of members reporting. If we extrapolate to 100% of members, this could be closer to 260 million ounces per day.
Annualized (assuming 252 trading days), this is 65.5 billion ounces per year—about 10 times the total physical gold stock.
COMEX data from Web ID 0 shows trades equivalent to 27 million ounces per day in gold futures, or 6.8 billion ounces per year. This is still a massive volume compared to physical gold.
Ratio of Paper to Physical: Web ID 2 and 3 highlight the disconnect:
In 2011, the LBMA paper gold trading volume was equivalent to over 2 years of physical gold production per day. By 2025, with annual production at 3,000 tons (96.5 million ounces), daily LBMA volumes (if unchanged) would still represent over 2.7 years of production.
The total paper gold market ($200–300 trillion) is 20–27 times the value of physical gold ($11 trillion in 2020). Adjusting for 2025 gold prices (~$2,600 per ounce), the physical gold stock is worth ~$16.7 trillion, so the paper-to-physical value ratio is still around 15–18:1.
🚀 Maximize your trading efficiency! With our TradingView script, create a watchlist from 1,000 stocks in just 10 seconds! 📈 Get instant exit alerts and save precious time. Don’t miss out on opportunities—level up your trading game today! 💪 #stocks#StockMarket#StocksTobuy
🚀 Unlock Your Trading Potential!
Introducing the Stage 2 Indicator on TradingView! 📈
This powerful tool helps you minimize drawdowns and maximize gains by identifying key breakout points. Say goodbye to portfolio stress #Stage2Indicator#TradingSuccess#InvestSmart#stock
“As of 2022, the estimated market opportunity for hyperscale cloud companies was approximately $1.5T. We believe it is likely even larger now, due in part to the significant ramp up in GenAI investments…”. Polen Capital
“As of 2022, the estimated market opportunity for hyperscale cloud companies was approximately $1.5T. We believe it is likely even larger now, due in part to the significant ramp up in GenAI investments…”. Polen Capital