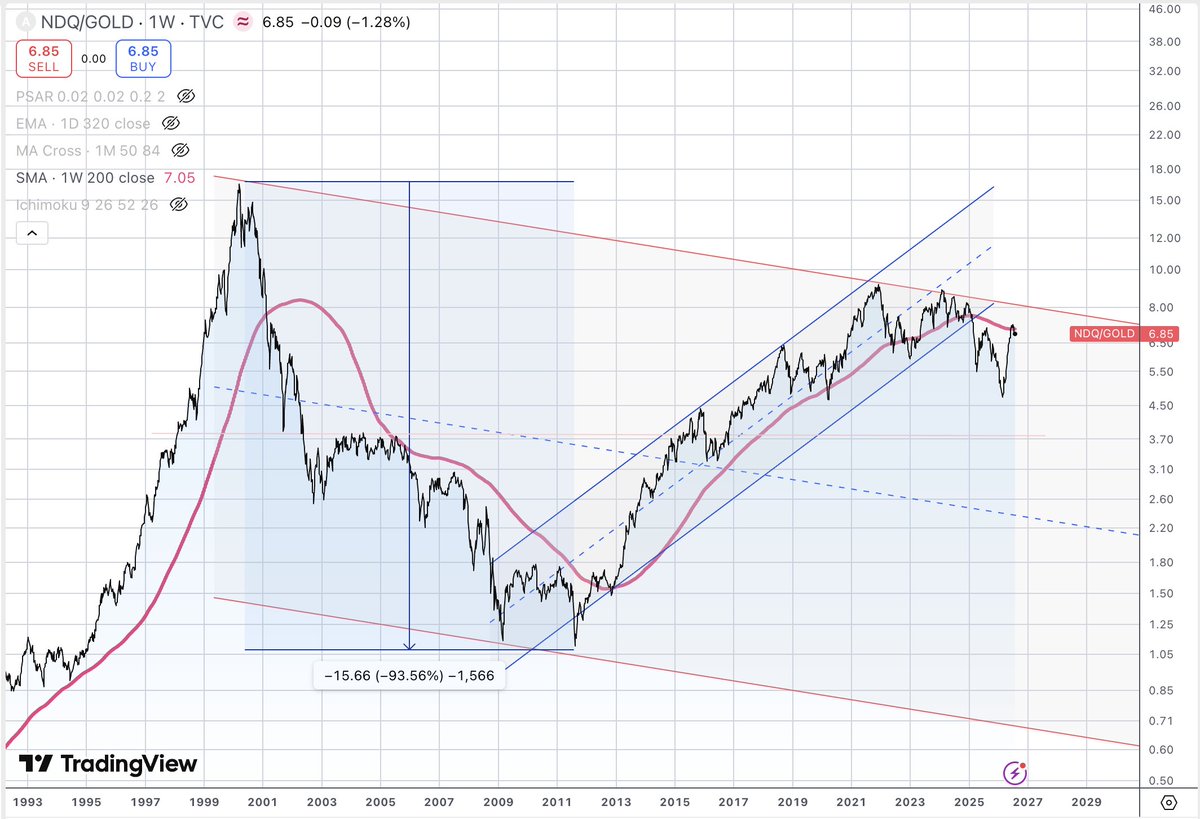
#NDX / #Gold is the chart that tells the story for me.
The bullish side says AI is the real thing.
The bearish side says the bill is coming due on thirty years of cheap money.
Funny how #Bitcoin fits right in
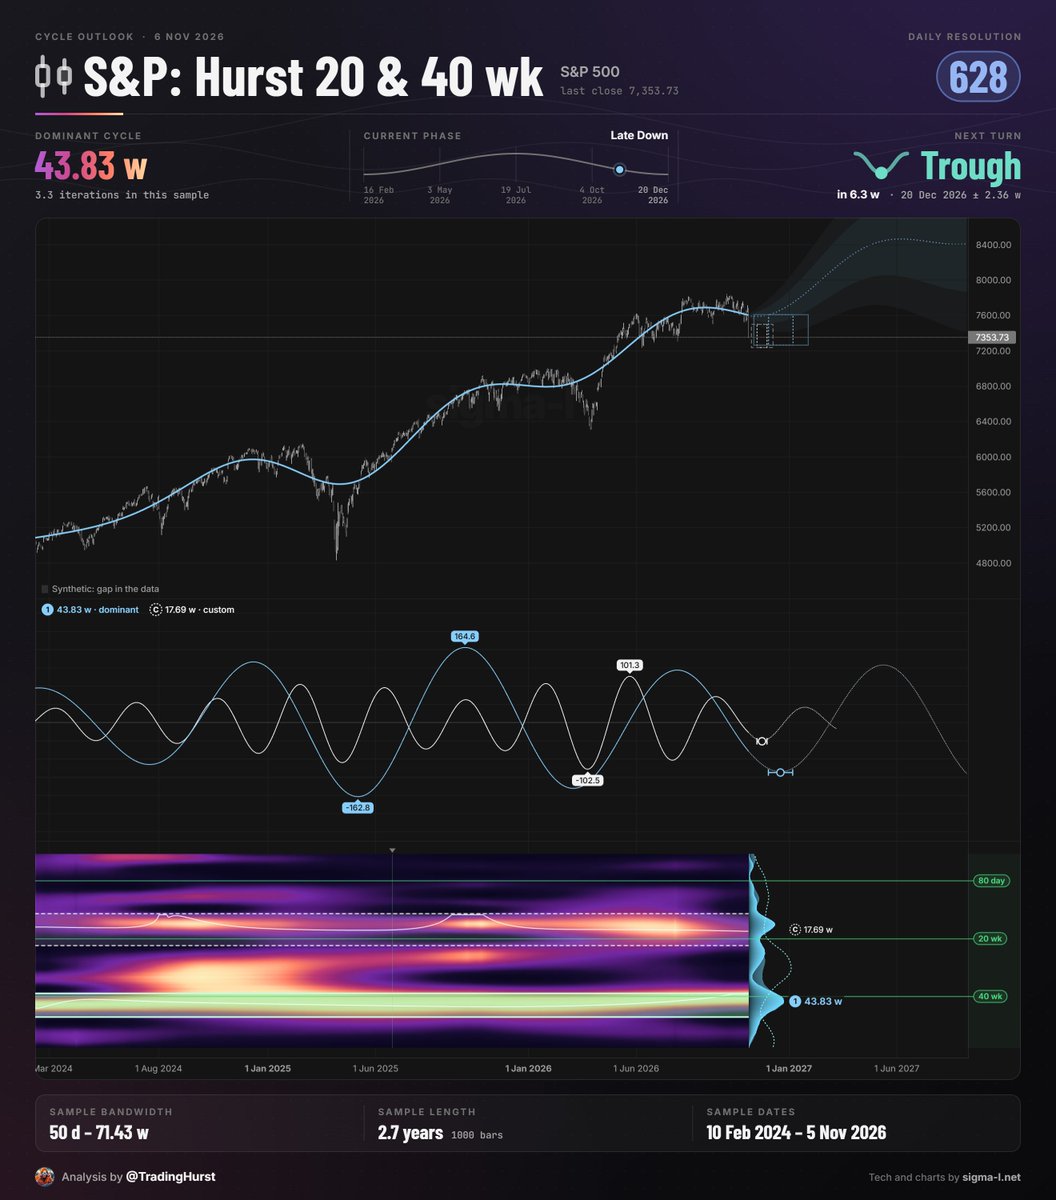
Overlay the original JM Hurst 'nominal model' (green lines) to examine the efficacy of the framework several decades on. Here the 20 and 40 week wave in the S&P 500 align closely.
$AAPL $GDX $HUI $GLD
Retesting the breakdown and stopped on a dime. A declining 200wk MA and below the cloud has not happened since the 2000 bubble. So, you need to know that GDX miners are the anti-bubble. This should not be happening to AAPL in a bull market.
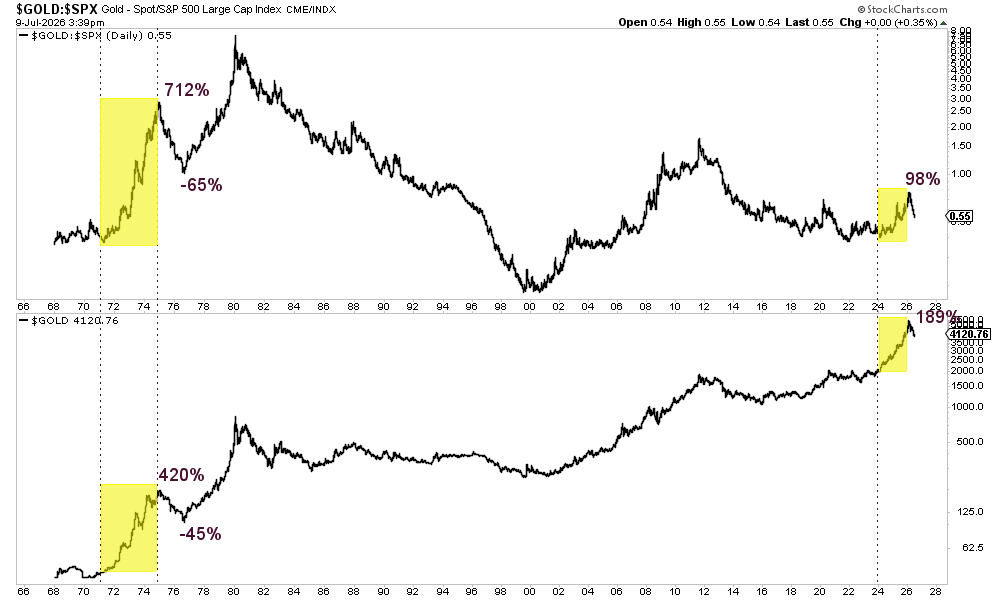
Gold isn’t showing the classic topping characteristics we saw in 1980, 2011–12, or 1975–76: no prolonged distribution, no major relative peak vs stocks, no true bearish consolidation.
The 1975–76 ~50% decline came after an extreme move. Gold surged 5x in 4 years and +712% vs stocks.
Compare that to today: 189% over 2 years and ~100% vs stocks. Strong, but not remotely the same magnitude.
Even the 2018–2026 advance, which is closer to 1971–74, included a 3-year-long consolidation.
In 1975–76, Gold retraced ~58% of its prior gain. A similar retracement today would imply $3450. Not a prediction, just historical context.
Bottom line: The real rotation phase (1971–74, 2001–03) still lies ahead.
YES.
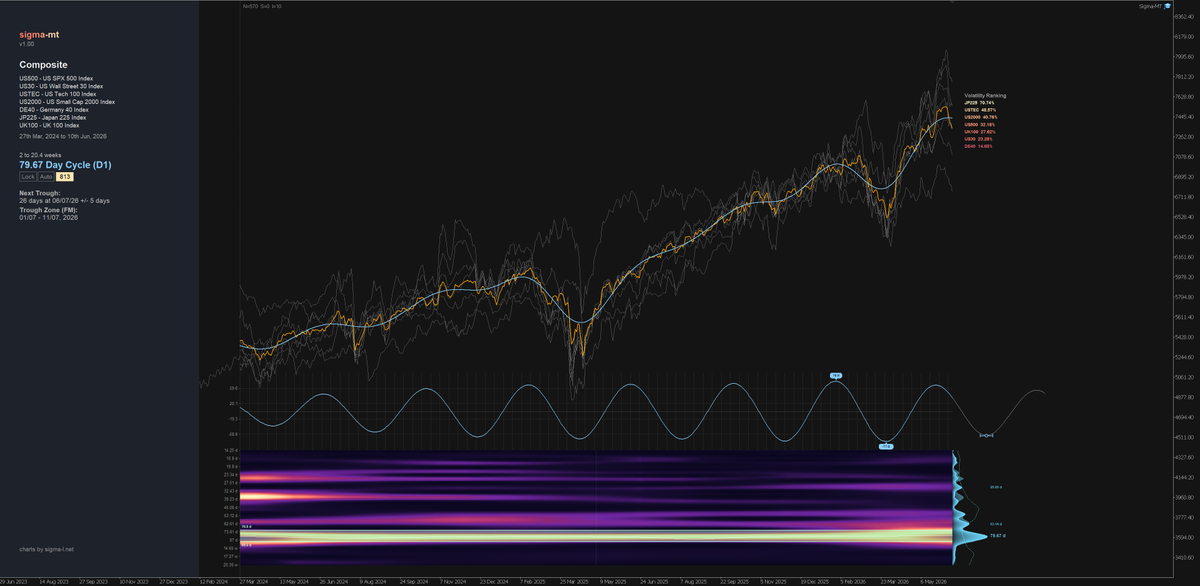
Even while I have warned you about the SHORTER term DOWNSIDE for gold & silver...
I am also warning you about the huge LONG term UPSIDE still left on the table.
It's that early.
Have a nice weekend!
My current buy zone candidates.
Healthy pullbacks that are near a rising 200w MA when denominated in Gold.
There are not many that I can find.
TLDR: I think Gold will remain strong and outperform the S&P thru ~2035...I want to be allocated to assets that will keep up + outperform.
1/12: $NVDA