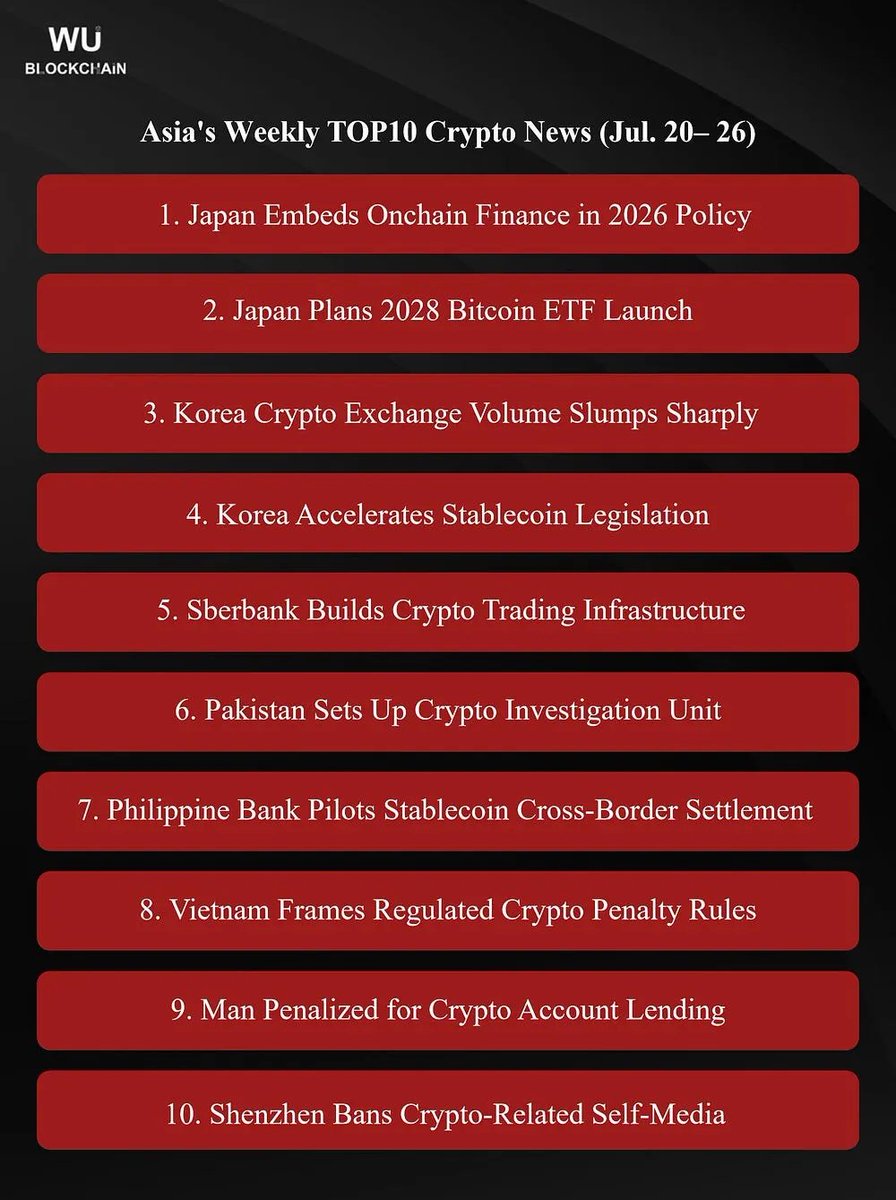
Asia's weekly TOP10 crypto news: Japan Elevates On-Chain Finance to National Policy and Targets Bitcoin ETFs by 2028, South Korea Moves to Expand Institutional Crypto Access as Exchange Volumes Plunge, Russia’s Sberbank Builds Regulated Crypto Trading Infrastructure, and the Philippines and Vietnam Advance Stablecoin and Crypto-Market Frameworks.
Fireworks turned night into day in the Vietnamese city of Thanh Hóa.
Residents celebrating Lunar New Year launched more than a hundred fireworks every minute for several consecutive hours.
LESSON 5: Trading On Different Time Frames
❤️ & ♻️ are appreciated.
One of TA's key concepts is using different time frames (TF). Using different time frames can provide a better perspective on an asset & can be used to create a more complete picture of its potential price movements.
The TA time frames shown on charts range from one-minute to monthly or even yearly, time spans. Popular time frames that technical analysts most frequently examine include:
1-minute chart: This chart shows the price movements of an asset over a one-minute period. It is commonly used to identify short-term trends & potential entry & exit points.
5-minute chart: This chart shows the price movements of an asset over a five-minute period. It can provide a broader view of short-term trends and can be used in conjunction with 1-minute charts to make trading decisions.
15-minute chart: It can be used to identify longer-term trends & potential support/resistance levels.
30-minute & 1H charts: It is similar to the 15-minute chart, but provides a wider view of the market & can be used to identify longer-term trends & potential support/resistance levels.
4-12H (swing traders) TF charts: This chart shows mid TF. The trader can see more clearer view than lower TFs & levels from these TFs are more stronger than LTFs.
Daily, Weekly & Monthly TFs: are considered as HTFs, especially Weekly & Monthly charts followed by long-term investors, provide solid S/R levels.
No matter what TF you work with, you need to consider & mark your S/R levels from Monthly-1H charts, this is called a top-down analysis.
Day traders, those who open & close positions within a single trading day, prefer to analyze price action on shorter time frame charts, e.g. 5-minute or 15-minute charts.
Swing & long-term traders who hold market positions overnight & for extended periods are more likely to analyze the market using hourly, 4-hour, daily or weekly charts.
More lessons on the way, turn on your 🔔
I’d appreciate it if you could give this a ❤️ & RT to help it reach more people.
On November 12, Bitcoin spot ETFs had a total net inflow of $818 million, continuing a net inflow for 5 consecutive days. BlackRock ETF IBIT had a single-day net inflow of $778 million. https://t.co/59u0BnEqLG