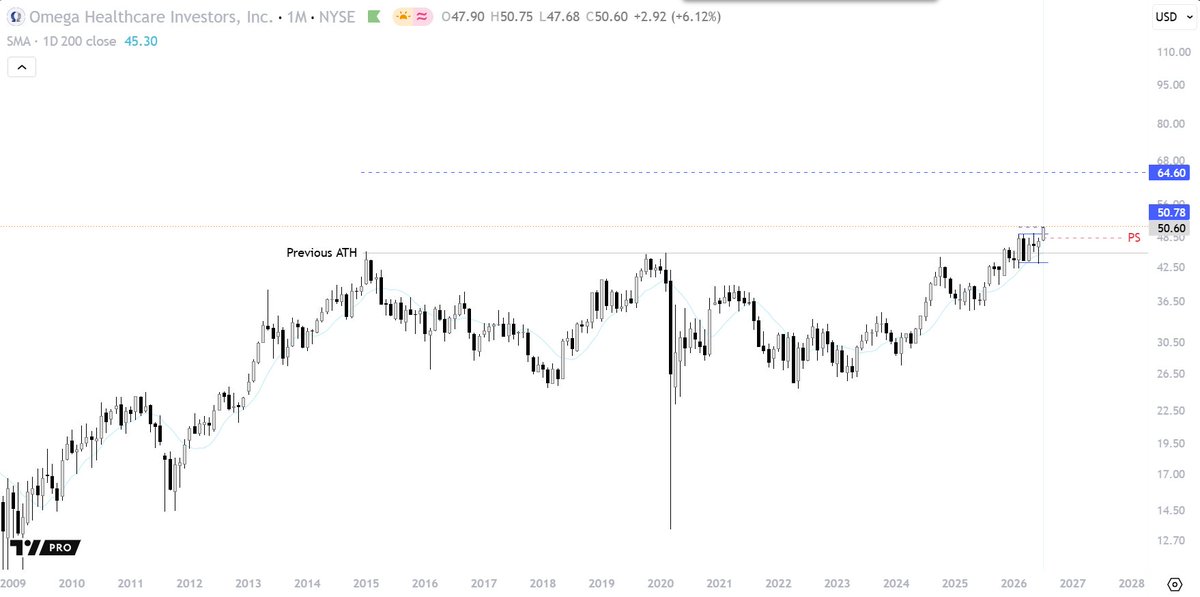
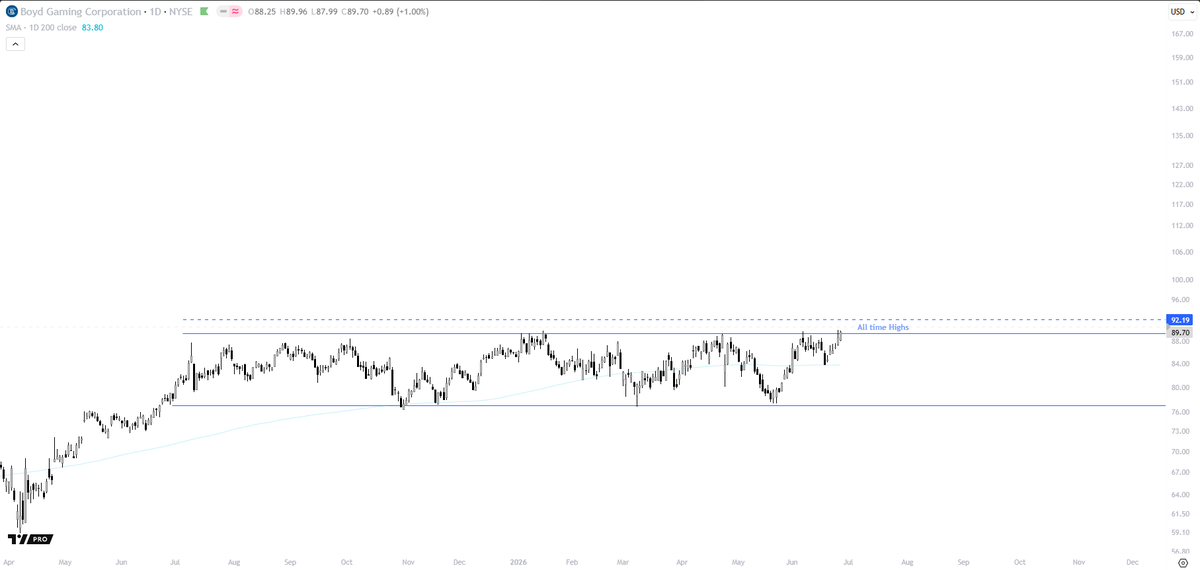
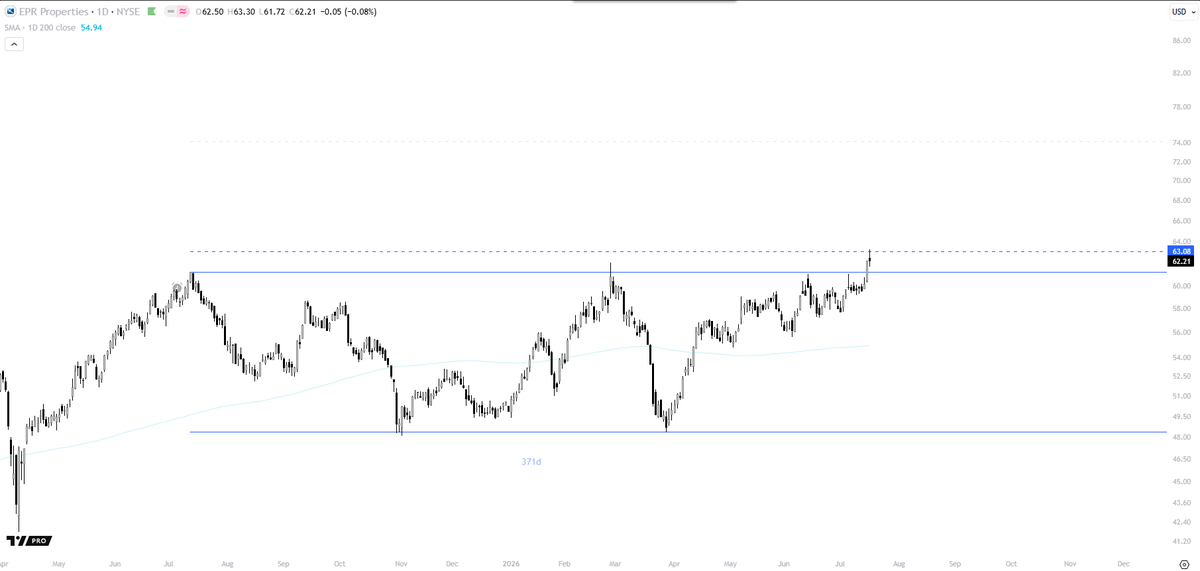
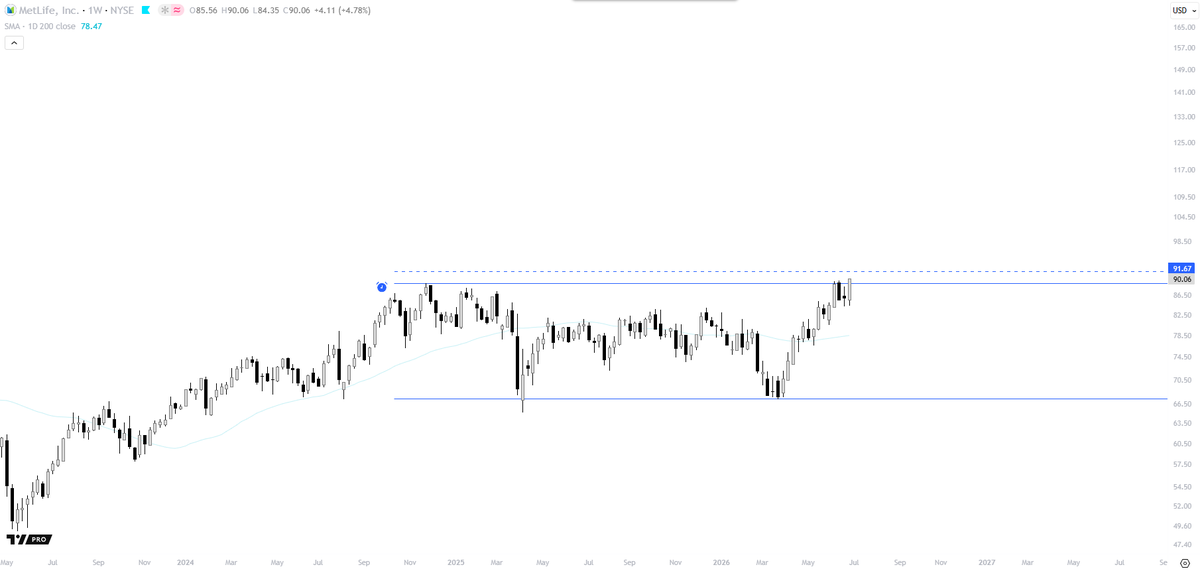
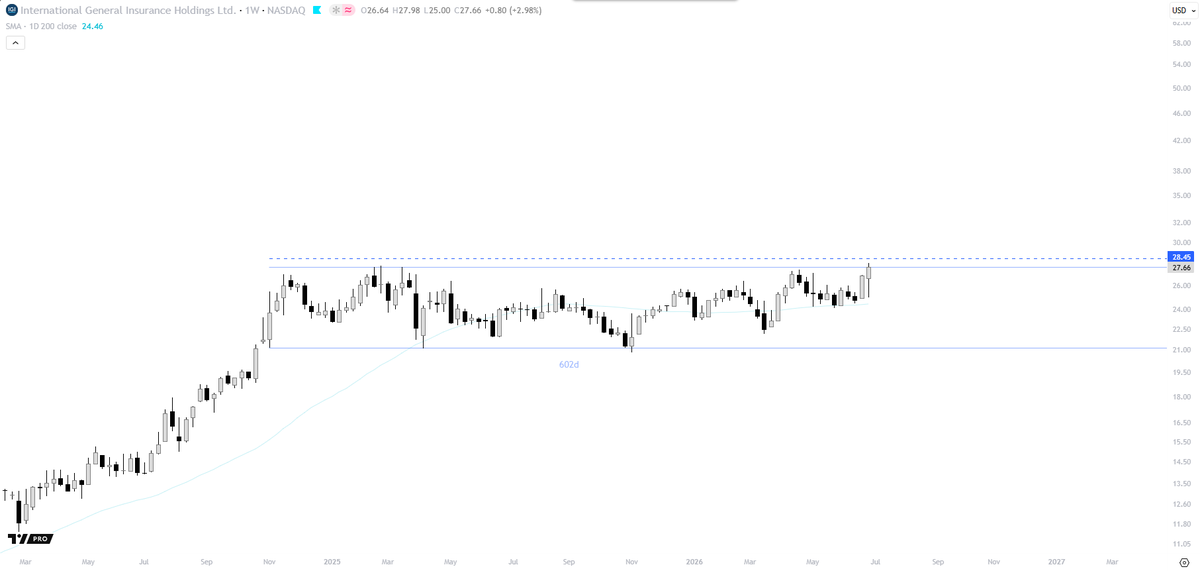
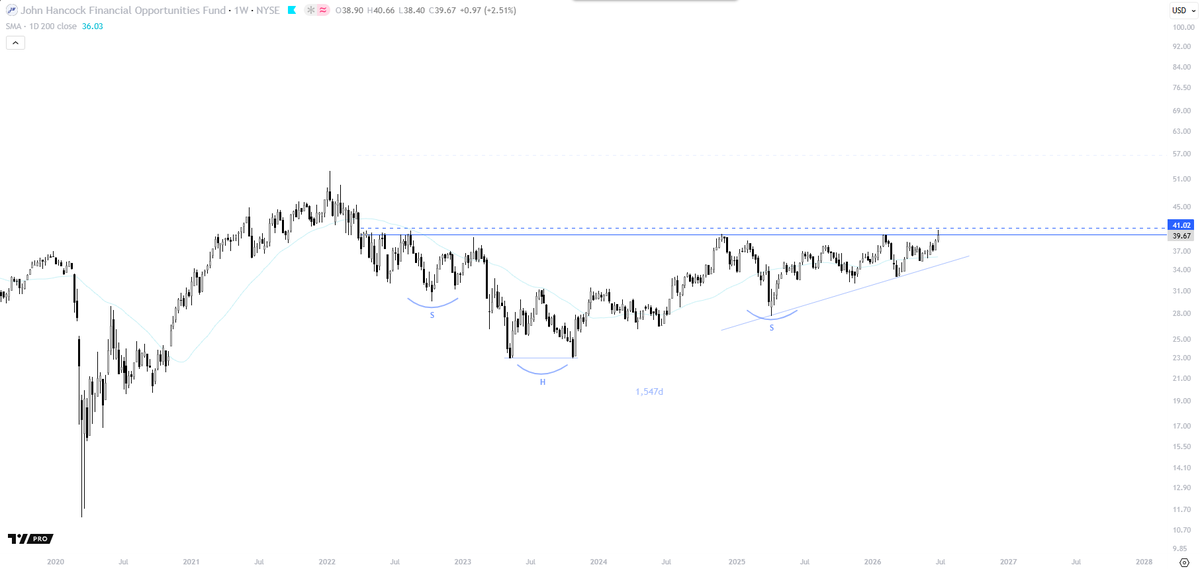
A range breakout at all-time highs is the market's way of communicating.
Every opinion, earnings report, valuation model, and headline has been expressed through one thing...
Price.
When price breaks into new highs, it's telling you demand has won the vote
Buystop is in place
Monthly & Daily timeframes below — same ticker.
Imagine watching an 11-year setup unfold...
...then blaming luck when it finally moves.
People call it luck because admitting they ignored it is harder.
Preparation creates its own opportunities.
@TechCharts@PeterLBrandt@chartsdb Everyone has different tastes and preferences, not to say one's better than the other.... that's what makes for good horse races
Reading Edwards & Magee, they describe a rounding bottom as the gradual exhaustion of supply.
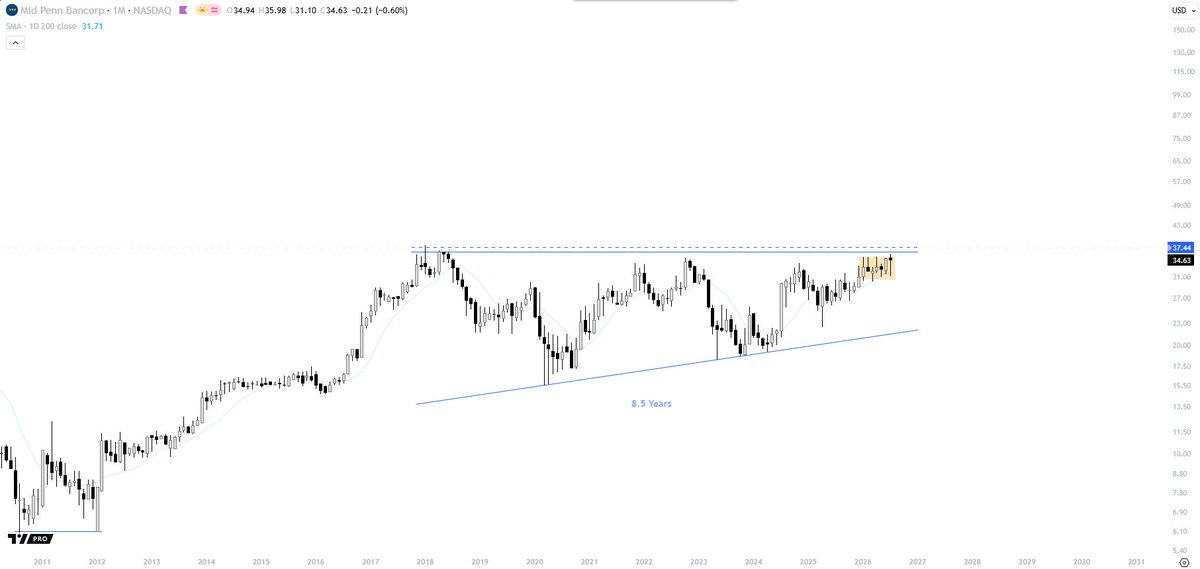
Schabacker saw it as a slow shift in market psychology. Now it's pressing against the apex of a multi-year symmetrical triangle.
Compression precedes expansion.
@TechCharts@PeterLBrandt Thanks @chartsdb
The only indicator I use is the 200-day SMA, volume's something I rarely look at. Indicators feel like emotional band-aids—tools traders lean on to quiet their inner dialogue. They're all derivatives of price so I'd rather focus on the source than interpretation
Reading Edwards & Magee, they describe a rounding bottom as the gradual exhaustion of supply.
Schabacker saw it as a slow shift in market psychology. Now it's pressing against the apex of a multi-year symmetrical triangle.
Compression precedes expansion.
@TechCharts@LuckyRokusho@PeterLBrandt Awesome, thanks for your reply and its interesting to hear.
Do you avoid these lengthier setups due to more frequently occurring hard retests of pattern boundaries, or other reasons? Mabey preffered capital allocation elsewhere?
Interested to hear your thoughts too @PeterLBrandt
The opportunity isn't in predicting the breakout.
It's in recognizing when 8.5 years of price action have created the conditions for one
Volatility compression at the highs may be followed by strong directional move 👀
How would you trade this @TechCharts ?
#AscendingTriangle
1M: Parabolas can start after repeated failures at higher prices on higher timeframes
Each rejection removes supply from the market.
Sellers who once capped the move get absorbed.
Eventually, the ceiling can break — and price accelerates.
Caution, crowd view may be a rising wedge
Watching a market quietly tighten beneath resistance with alerts. If the breakout comes, great. If not, onto the next one. Orders ready - Patience pays. #Ascending#Triangle#Breakout Weakly TF
@PeterLBrandt@TechCharts Yeah your right, like moths to the flame.
I think your the first person to reply to any one of my posts too, 😂 Thanks for your time, I was starting to think I had a setting turned off.
A structure-based trailing stop rather than targets can improve expectancy.
After BE - I advance once the market's confirmed a meaningful low given TF context, - Daily or above.
Objective's not to protect every $, but to stay invested for the meaningful part of the trend.
A quote from Annie Duke's book, Thinking in Bets:
"What good poker players and good decision-makers have in common is their comfort with the world being an uncertain and unpredictable place. They understand that they can almost never know exactly how something will turn out.
They embrace the uncertainty, and instead of focusing on being sure, they try to figure out how unsure they are, making their best guess at the chances that different outcomes will occur. The accuracy of those guesses will depend on how much information they have and how