$BTC historically major lows tend to form ~260–410 days after ATH and usually move below Realized Price. The key timing window points to Jun–Nov 2026. My base case: first more chop, then one more leg down into 45k–52k,with a brief panic wick lower, followed by a longer bottoming.
#Bitcoin – What's Next?
The Big Sunday Report: All We Need to Know
🚩 TA / LCA / Psychological Breakdown:
THE FINAL TRAP: Today I want to speak about the most important development on the chart right now, and it is going to be very interesting. I am watching the MA200 weekly closely, and what we are seeing is what looks like a retest of the MA200 weekly. Hold on, this is exactly the moment where things get dangerous. Let me take you back to 2022 to explain what is loading right now. In 2022, Bitcoin lost the MA200 weekly and everyone believed it was over. Then something happened that trapped everyone. A few weeks later, Bitcoin regained the MA200 weekly, and not only that, BTC printed three weekly closes above it. Bitcoin pumped 10% above the MA200 weekly in 2022, and guess what happened with the narrative? Everyone thought the bottom was in. "Wow, MA200 weekly reclaimed, this is bullish, the bear is over." This is exactly what they said. And so many bought right above the MA200 weekly, believing it was the confirmation they needed. Just to get trapped again. This was the final trap, and this is what led directly to the capitulation event. The reclaim of the MA200 weekly in 2022 was not the bottom signal, it was the trap that preceded the final flush to 15-16k.
Why This Matters Right Now:
Look at where we are today. Bitcoin lost the MA200 weekly. And now BTC is doing exactly what happened in 2022. It is testing the MA200 weekly from below, and there is a very real possibility that we see the same repeat. So in my idea there if we see a weekly close above MA200 Weekly, it will be definitely a trap! And for this case I told two weeks ago at 60k that I am placing short orders at 68-69k in case market allows to visit. This is exactly the setup I have been warning about for the last two weeks when I spoke about the white and blue lines converging and the death cross loading. The MA200 weekly retest is the key ingredient of the final trap, and history is about to repeat with almost perfect timing.
The reason this trap works every single time is because retail cannot resist a reclaim of a major moving average. When Bitcoin closes above the MA200 weekly, every one will be bullish and start FOMO buying. And this is exactly why it works. Market makers need this trap to build the maximum amount of long liquidity before the final flush. Without this trap, the capitulation would not have enough fuel. The final trap is what generates the liquidity for the final flush. This is how bear markets always end, and this is how this one will end too.
Why This Aligns With the CBB
If the 2022 pattern repeats, the final flush after the trap lands us directly at the CBB, the 40-50k zone where the BlackRock ETF launched. My timeline of September-October 2026 for the bottom aligns perfectly with the timing of a MA200 weekly reclaim happening now, followed by a fake bullish move in July-August, followed by the final rejection and capitulation in September-October. Every piece of the puzzle continues to fit. (Visit our website: https://t.co/oP8wCPuO9J) The 2022 playbook, the death cross setup, the aSOPR realized losses, the MA200 weekly trap, and the CBB target all point to the same conclusion.
My Positioning
Both shorts remain fully open. The 120k big short and the 80,500 average are in deep profit. New short orders at 68-69k remain prepared in case the market allows another visit. The plan is for the macro move toward the CBB, but the sideways zone between 57-68k is not over yet. I would not bet on an upside move, but I would bet that if the market allows another visit to 68-69k, I add more into my shorts. I am not interested in adding below this zone. If the MA200 weekly reclaim scenario plays out and BTC pumps 10% above the line, this is the perfect zone for me to add aggressively.
Calendar This Week:
FOMC minutes from the June 16-17 meeting release Wednesday July 8 at 2:00 p.m. This is a major event because it was Warsh's first FOMC as Chair, and the meeting delivered a clear hawkish shift with the median federal funds forecast implying the potential for one rate HIKE before year-end 2026, not a cut. Exactly what I predicted in the June 14 Sunday report when I said the dovish pivot would not be delivered cleanly. The minutes will show how divided the Committee was and how strong the hawkish argument was internally. Any confirmation of the hawkish tone will give us more sell pressure. Initial jobless claims Thursday July 9. Consumer credit data also Wednesday July 8.]
Join Premium: https://t.co/oP8wCPuO9J
THIS IS NO FINANCIAL ADVICE BUT EDUCATIONAL CONTENT ONLY.
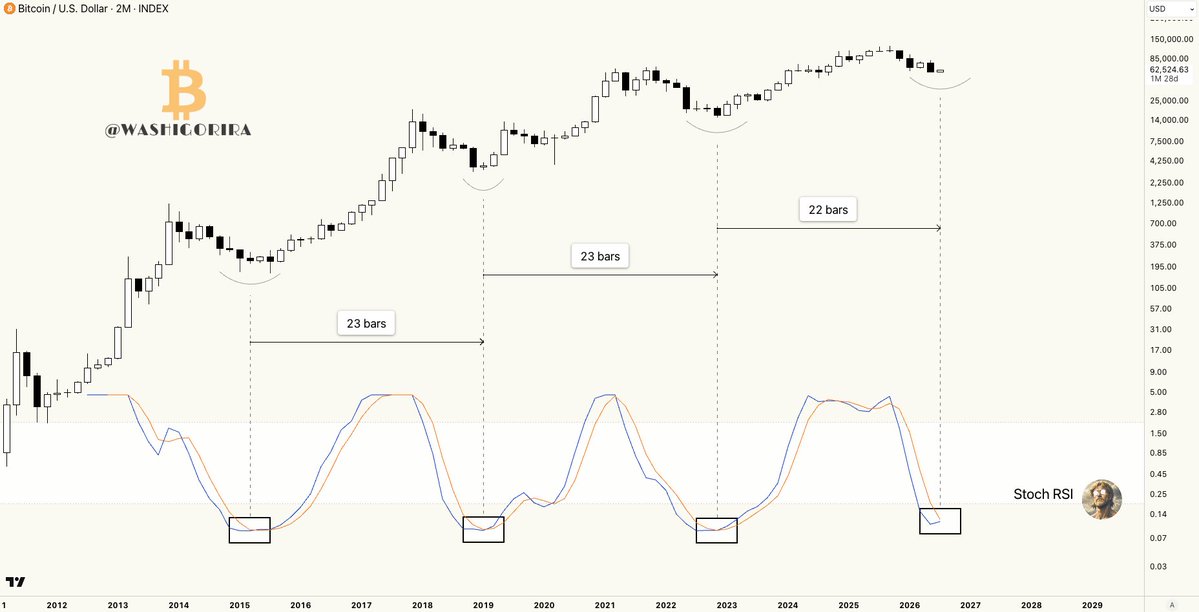
#Bitcoin Major Regime Shift Incoming.
The 2-month Stochastic RSI has consistently marked major regime shifts throughout Bitcoin’s history.
Another bullish crossover may not be far away.
$BTC historically major lows tend to form ~260–410 days after ATH and usually move below Realized Price. The key timing window points to Jun–Nov 2026. My base case: first more chop, then one more leg down into 45k–52k,with a brief panic wick lower, followed by a longer bottoming.
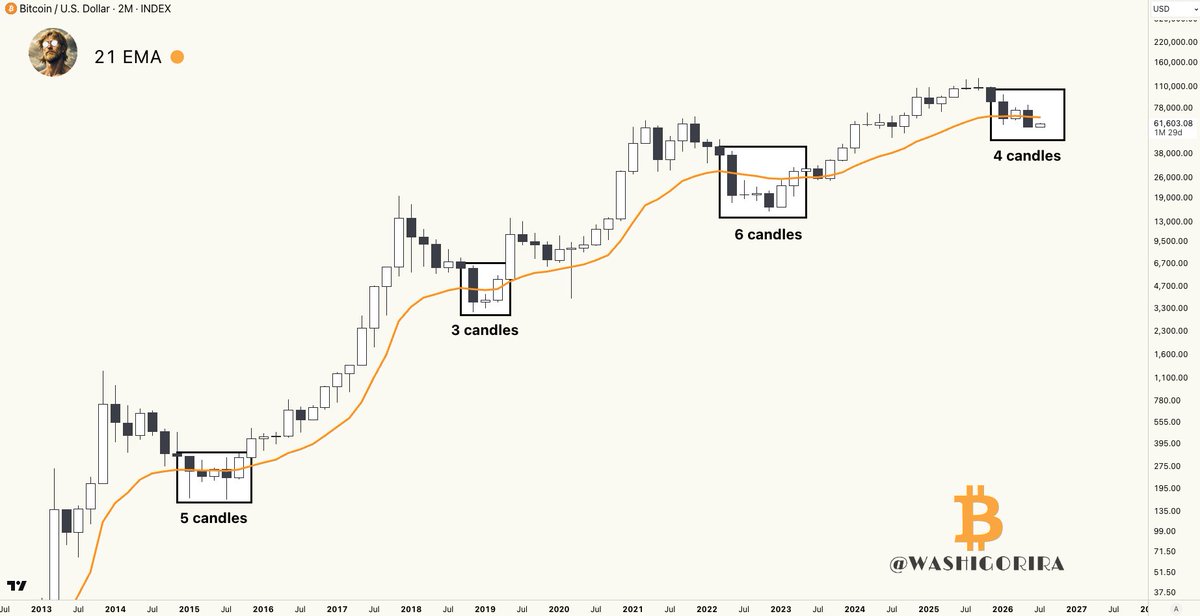
Is #Bitcoin Bottom Already Underway?
Historically, BTC bottoms tend to form below the 2-month 21 EMA.
It spent roughly 3 to 6 candles below it while bottoming.
This cycle, it has already spent 4 candles below it.
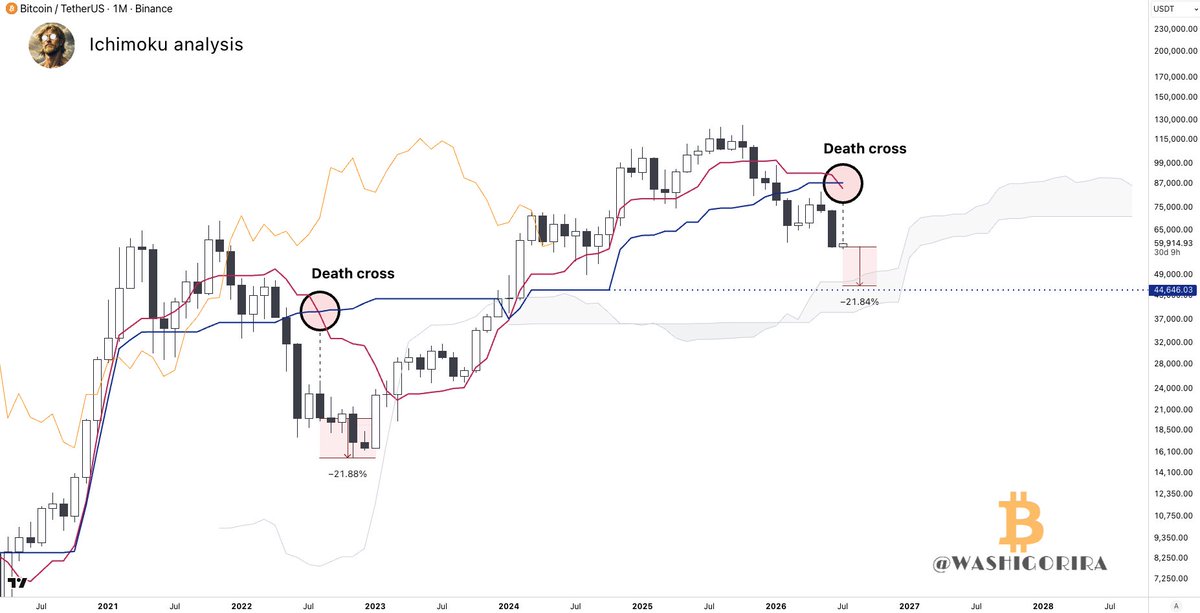
#Bitcoin Monthly Ichimoku death cross confirmed.
Last time this happened, Bitcoin dropped another 22% before bottoming.
History doesn’t always repeat, but I don’t expect this cycle to bottom below $44K.
The monthly Kumo and the projected flat Kijun 🔵 are aligning in the same region, forming a strong macro support area.
We've successfully closed the weekly below the 200 SMA. Once this happened before, which was also in June of 2022, we ended up quickly retesting the 200 SMA then followed by a 38% drop.
I expect a possible retest then eventually massive capitulation.
I begin to DCA near $50K.
#Bitcoin Power Law V2.0
According to this indicator, the probability of BTC dropping below $43K remains low, as price has never broken below the green band.
That would imply a drawdown of roughly 65%.
The chances of an expanding diagonal playing out for Bitcoin is extremely high.
If this scenario plays out, I'd liquidate every asset I own, get a multimillion dollar loan from the bank, then take everything leveraged into a 9 figure long.
Then I'll be a crypto billionaire.
$BTC: After ten months of constantly warning Saylor to realize gains, Saylor finally admits that Strategy needs to sell their Bitcoin! Not at 120k, not at 100k, not at 80k, no he decided to do this at 60k, calling it the "Monetization Program."
Now watch this: Saylor dumping BTC to protect his stock and pay out the dividends. And watch what happens when the market forces him to sell lower and lower, as the market forced him to sell! The panic will hit bigger once people realize the amount of BTC he has to sell to protect his USD reserve of 1.25bn, the dividend payments, and the re-purchase of MSTR stock.
This happens after months of predictions, and the timing couldnt be better, its happening right where I am expecting a large capitulation event to happen. Guess what I believe will lead to this event ? Good luck everyone.
$BTC historically major lows tend to form ~260–410 days after ATH and usually move below Realized Price. The key timing window points to Jun–Nov 2026. My base case: first more chop, then one more leg down into 45k–52k,with a brief panic wick lower, followed by a longer bottoming.
#Bitcoin – What's Next?
The Big Sunday Report: All We Need to Know
🚩 TA / LCA / Psychological Breakdown:
Today I want to share something very important that almost no one is talking about. At least I have not seen a single account on X pointing this out yet, and the best part is that it aligns perfectly with the capitulation event I have been expecting since the start of Stage 5. So what is it? In 2022, Bitcoin saw a death cross on the 1-week chart, with the white line crossing below the blue line. That death cross happened right after BTC lost the MA200 weekly. Two months after the death cross, the capitulation candle printed at 15-16k, and Bitcoin went down another 30% after the death cross. This is exactly what marked the end of the previous bear market. Now look at what is happening right now in 2026.
First, BTC lost the MA200 weekly. Same as 2022. Second, BTC is now showing the same white-crossing-blue structure on the 1-week chart that preceded the previous death cross, and the death cross is loading once again. Third, in 2022 BTC dropped 30% after the death cross. The same setup is loading right now. Do you notice the pattern? The repeat is in front of us, on the same indicators, with the same structural sequence. It is also worth mentioning that I made a clear warning recently regarding the MA200 weekly, and I told you I did not believe it would hold. The big mistake many people made is buying right into the MA200 weekly support, believing it is a strong support, and we are not below it and lost it. Recent buyers are trapped and they keep arguing their mistakes with: "It does not matter at what price Iam buying" And I showed many times that indeed it mattes, it matters a lot! Entry is everything and whoever fails to understand this shouldnt trade.
Another CRUCIAL point: In every bear market in Bitcoin history, BTC has always dropped 30% below the MA200 weekly. Always. Not once, not twice, every single time. And let me add the salsa on top of the food: every bear market ended with a capitulation event, never with a slow grind back up from the MA200 weekly. So I ask: what makes this cycle different? Why would people blindly buy at current prices believing the MA200 weekly will hold for the first time in Bitcoin history? People are free to do what they want, and I respect their decision, but I am skipping this zone and I will buy lower. The math is simple, the pattern is in front of everyone, and yet most still refuse to see it.
Why This Aligns With the CBB:
If we take the current level around 60k as the reference and apply the historical 30% drop pattern, we land directly in the 42-43k zone. This is exactly the CBB region I have been pointing to since September 2025! Exactly where the BlackRock ETF launched, exactly where the Golden Bull bottom support sits, and exactly where my September-October 2026 timeline projects the bottom, and I expect it to be hit in September - October! Multiple independent indicators are converging toward the same target zone. This is why Premium is important and very few will understand.
We are now several weeks into Stage 5: Whoever does not know what Stage 5 is , please read the previous Sunday reports. The white-crossing-blue structure forming again is the next confirmation that the architecture is playing out as designed. Capitulation has not happened yet and the fear is building and has not reached a peak level yet. You havent seen a bottom yet if you believe it was the bottom. At the same time realized losses are growing, but the extreme single-event moment has not arrived. To make it very short: I am waiting for the total capitulation event! Its only two days to go and the doors for the free premium membership trial ends. You can join now before the free trial ends: https://t.co/SBmkqCq0oI
THIS IS NO FINANCIAL ADVICE BUT EDUCATIONAL CONTENT ONLY.
$BTC historically major lows tend to form ~260–410 days after ATH and usually move below Realized Price. The key timing window points to Jun–Nov 2026. My base case: first more chop, then one more leg down into 45k–52k,with a brief panic wick lower, followed by a longer bottoming.
$BTC: Big Warning about the MA200 Weekly
In the last three bear markets, Bitcoin has NOT found its bottom at the MA200 Weekly, but in fact 30% below the MA200! If History repeats, the bottom should be between 40-42k area based on this indicator!
I see many analysts speaking about this support as a major buy signal. And yet this mistake will cost the investors a lot of Money, because its simply wrong and dangerous to trust a pattern that proved a 30% downside move each single time! This confirms my bearish thesis about the market. DrProfitPremium FREE ends in end of June, enjoy the last days of free Premium content: https://t.co/SBmkqCq0oI
We’re currently seeing the tightest cluster of Bitcoin’s major on-chain bottoming models in history.
Realised Price: $53.4K
Cointime Price: $51.9K
LTH Realised Price: $49.7K
Investor Price: $48.9K
CVDD: $48.9K
5 independent frameworks now sit within just a few thousand dollars of one another.
That’s a remarkable level of confluence.





![DrProfitCrypto's tweet photo. #Bitcoin – What's Next?
The Big Sunday Report: All We Need to Know
🚩 TA / LCA / Psychological Breakdown:
THE FINAL TRAP: Today I want to speak about the most important development on the chart right now, and it is going to be very interesting. I am watching the MA200 weekly closely, and what we are seeing is what looks like a retest of the MA200 weekly. Hold on, this is exactly the moment where things get dangerous. Let me take you back to 2022 to explain what is loading right now. In 2022, Bitcoin lost the MA200 weekly and everyone believed it was over. Then something happened that trapped everyone. A few weeks later, Bitcoin regained the MA200 weekly, and not only that, BTC printed three weekly closes above it. Bitcoin pumped 10% above the MA200 weekly in 2022, and guess what happened with the narrative? Everyone thought the bottom was in. "Wow, MA200 weekly reclaimed, this is bullish, the bear is over." This is exactly what they said. And so many bought right above the MA200 weekly, believing it was the confirmation they needed. Just to get trapped again. This was the final trap, and this is what led directly to the capitulation event. The reclaim of the MA200 weekly in 2022 was not the bottom signal, it was the trap that preceded the final flush to 15-16k.
Why This Matters Right Now:
Look at where we are today. Bitcoin lost the MA200 weekly. And now BTC is doing exactly what happened in 2022. It is testing the MA200 weekly from below, and there is a very real possibility that we see the same repeat. So in my idea there if we see a weekly close above MA200 Weekly, it will be definitely a trap! And for this case I told two weeks ago at 60k that I am placing short orders at 68-69k in case market allows to visit. This is exactly the setup I have been warning about for the last two weeks when I spoke about the white and blue lines converging and the death cross loading. The MA200 weekly retest is the key ingredient of the final trap, and history is about to repeat with almost perfect timing.
The reason this trap works every single time is because retail cannot resist a reclaim of a major moving average. When Bitcoin closes above the MA200 weekly, every one will be bullish and start FOMO buying. And this is exactly why it works. Market makers need this trap to build the maximum amount of long liquidity before the final flush. Without this trap, the capitulation would not have enough fuel. The final trap is what generates the liquidity for the final flush. This is how bear markets always end, and this is how this one will end too.
Why This Aligns With the CBB
If the 2022 pattern repeats, the final flush after the trap lands us directly at the CBB, the 40-50k zone where the BlackRock ETF launched. My timeline of September-October 2026 for the bottom aligns perfectly with the timing of a MA200 weekly reclaim happening now, followed by a fake bullish move in July-August, followed by the final rejection and capitulation in September-October. Every piece of the puzzle continues to fit. (Visit our website: https://t.co/oP8wCPuO9J) The 2022 playbook, the death cross setup, the aSOPR realized losses, the MA200 weekly trap, and the CBB target all point to the same conclusion.
My Positioning
Both shorts remain fully open. The 120k big short and the 80,500 average are in deep profit. New short orders at 68-69k remain prepared in case the market allows another visit. The plan is for the macro move toward the CBB, but the sideways zone between 57-68k is not over yet. I would not bet on an upside move, but I would bet that if the market allows another visit to 68-69k, I add more into my shorts. I am not interested in adding below this zone. If the MA200 weekly reclaim scenario plays out and BTC pumps 10% above the line, this is the perfect zone for me to add aggressively.
Calendar This Week:
FOMC minutes from the June 16-17 meeting release Wednesday July 8 at 2:00 p.m. This is a major event because it was Warsh's first FOMC as Chair, and the meeting delivered a clear hawkish shift with the median federal funds forecast implying the potential for one rate HIKE before year-end 2026, not a cut. Exactly what I predicted in the June 14 Sunday report when I said the dovish pivot would not be delivered cleanly. The minutes will show how divided the Committee was and how strong the hawkish argument was internally. Any confirmation of the hawkish tone will give us more sell pressure. Initial jobless claims Thursday July 9. Consumer credit data also Wednesday July 8.]
Join Premium: https://t.co/oP8wCPuO9J
THIS IS NO FINANCIAL ADVICE BUT EDUCATIONAL CONTENT ONLY.](https://pbs.twimg.com/media/HMfEF-8WMAAz6g0.jpg)