My first shinny app illustrating differences in differences approach. You can see the plot and results choosing different pre- and post treatment values https://t.co/TQY6Hu2JGf
#epidemiology#methods#datascience#r#causal
@Benjami44645994@InformaCosmos La tierra no es una superficie perfecta, lo que estaba bajo y sobre el mar varía en altura. Por lo tanto a igual subida de mar, a nivel mundial afecta diferente, a eso sumale la cordillera de la costa qué es una barrera.
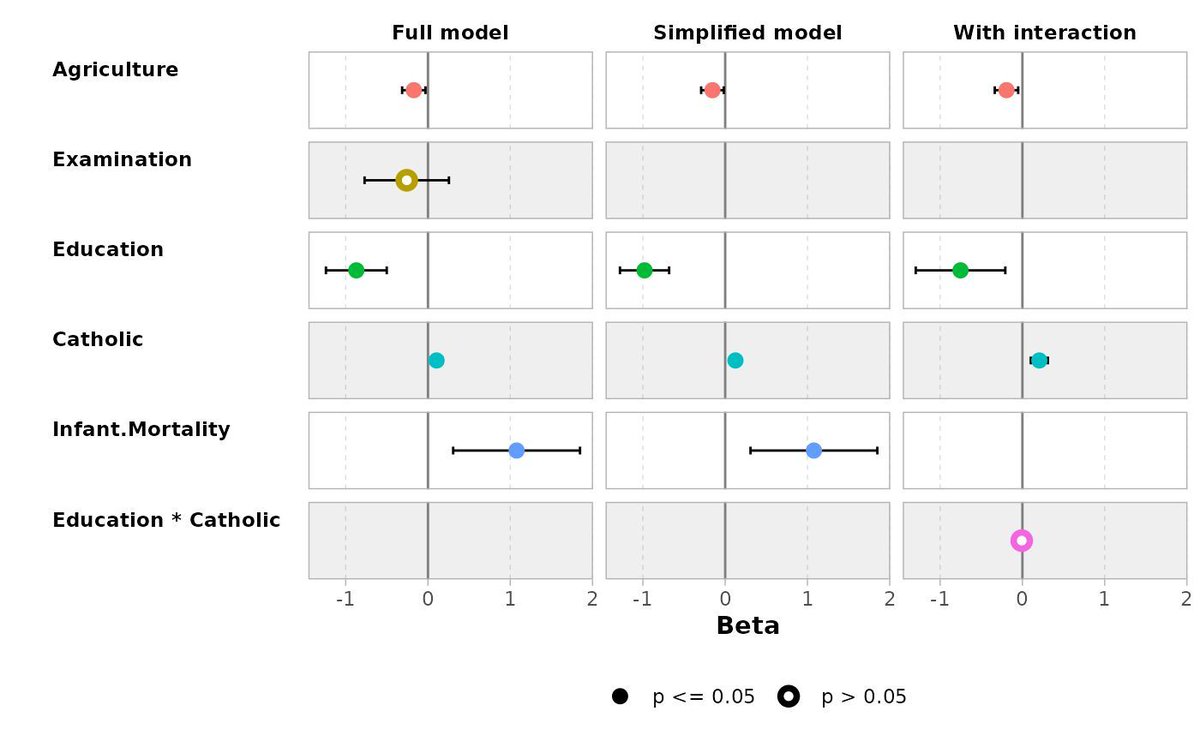
Compare multiple statistical models effortlessly with ggstats, a versatile extension package for ggplot2 that simplifies data visualization tasks. The ggcoef_compare() function allows you to compare the coefficients of several models side by side, providing an intuitive way to analyze and present differences between them.
Why use ggcoef_compare()?
✔️ Clear comparisons: Visualize the coefficients of multiple models in a single, cohesive plot to identify patterns and differences at a glance.
✔️ Customizable outputs: Adjust the appearance of the plot to meet your presentation or analysis needs.
✔️ Easy to use: Integrates seamlessly with ggplot2, making it straightforward to add model comparison capabilities to your workflow.
The example visualization showcasing this functionality originates from the ggstats documentation and demonstrates how it can enhance your model comparison tasks: https://t.co/AITQvg3t7G
Explore more ways to elevate your data visualization skills in R and learn about ggplot2 extensions in my online course, "Data Visualization in R Using ggplot2 & Friends!" See this link for additional information: https://t.co/ztlEzoEDWv
#ggplot2 #DataAnalytics #rstudioglobal #Rpackage #RStats #Data #DataViz #VisualAnalytics
First person in the family to become an academic:
Cons:
- No money
- No investments
- Questionable career prospects
- Wearing a backpack
Pros:
- more peer-reviewed articles than siblings
@MatiasBascunan_@notanpesima Esos colegios son una minoría. Un poco de estadística básica, calcular la proporción de quienes ganan esas becas según el colegio de origen en vez de números absolutos
📦 esquisse es un complemento de R que te permite arrastrar y soltar tus variables para crear gráficos personalizados al instante.🔥
🙌 Es genial para quienes están cansados de pelearse con el código, pero siguen queriendo aprovechar el poder de ggplot2.
https://t.co/adXTyJahu6
@lluaces@MiriForbes That what I was thinking. New diagnosis catch new disorders (entities) , or catch false negative to older dsm versions. Otherwise, only they define subgroups in older categories
What kind of childhood makes a top scientist? Is it enough to have all the right traits (brilliance, grit, etc) or do you need the right family too?
And why should we care? A 🧵 on our paper on the Nobel Laureates.
A teaser: the income distribution of the laureates' fathers.1/N
Estoy muy agradecido por la valiosa experiencia de haber participado en el XVIII Congreso Chileno de Psicología 2024, realizado en Chillán.
@DoctoradoEpiUC
lo que contribuye en mi búsqueda de integrar la epidemiología, inferencia causal, psicometría y psicología, con un enfoque en las poblaciones más desventajadas socialmente.
Este importante evento académico fue una oportunidad enriquecedora para compartir conocimientos y recibir los comentarios y reflexiones de colegas expertos,
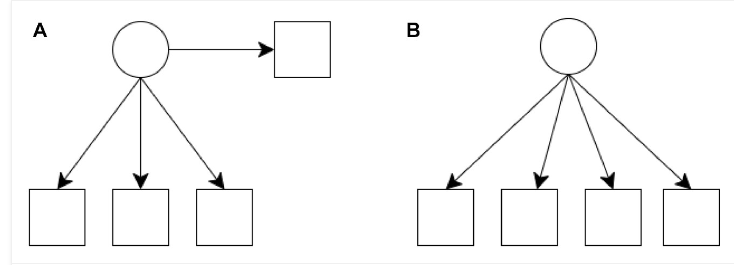
New paper w/@RoyLevy11 - These 2 path diagrams are conceptually different (regression with a latent predictor that has 3 indicators vs. a factor model with 4 indicators) but they are mathematically equivalent.
https://t.co/r40JGi61X1