Thread: Get to meet me (Mubarak Bamimore Ayodeji) || Nurse + Data Analyst
1/
I am Mubarak Bamimore Ayodeji, a fresh graduate with a BNSc from LAUTECH, Nigeria. Friends call me General.
I believe in using knowledge to serve humanity. But, behind this, is a purpose-driven story.
One thing worth knowing about Power BI: a beautiful dashboard doesn't automatically mean good analysis.
The real value is in the insights behind the visuals and the decisions they help people make.
Data is more than charts. 📊
#PowerBI#DataAnalytics
We've explored Excel, and now it's time to take things a step further with Power BI.
From spreadsheets to interactive dashboards, the journey continues.
Welcome to the Power BI phase! 📊
#SynalyxAnalyticals#PowerBI#DataAnalytics
Your growth is not determined by how fast you start, but by how consistently you keep learning.
Stay curious, keep building, and let every small step count. The results will speak.
SYNALYX ANALYTICS 🚀
#DataAnalytics#SynalyxAnalyticals
New week, new opportunities to get better.
Don't wait until you have everything figured out. Start with what you know, keep learning, and let consistency do its work.
Have a productive week ahead! 🚀
#SynalyxAnalytics#MondayMotivation#DataAnalytics
DATA CLEANING 🧹
Oya, let's talk data cleaning📊
Before you analyse any dataset, there are a few things you need to get right. I've put some important steps together in this post.
Which of these steps do you think is the most important? 👀
#SynalyxAnalyticals#DataAnalytics
New week, new lessons, new wins. 🤲🏽
May God bless the knowledge we seek and the work we put in. This week, let’s learn something that moves us forward.
Happy new week 💻
SYNALYX DATA SERIES | EP. 01
Monday: ₦15,000
Tuesday: ₦8,000
Wednesday: ₦22,000
You're the analyst. 👀
Which day recorded the highest sales, and what would you investigate next?
#SynalyxAnalyticals#DataAnalyst#DataAnalytics
Your data is only as powerful as the story it tells
Don't just collect data. Clean it, explore it, and turn it into decisions that matter.
That’s the real skill
#SynalyxAnalyticals#dataanalytics
LASUCOM, see you soon!😍
Come ready to learn, engage, and explore what excellence beyond the classroom truly means.
Register here: https://t.co/08ROE0vTMs
Data is everywhere. Insights are not. 👀📊
Two people can look at the same dataset, yet only one sees the story hidden inside.
The difference? Knowing what to look for. 🔍
#DataAnalytics#SynalyxAnalytics#SYNALYX
5 Free E-books every Data Analyst should have on their reading list 📚
1. Storytelling with Data: Cole Nussbaumer Knaflic
Knowing how to analyse data is one thing. Communicating your findings in a way people understand is another.
https://t.co/pgRcCBARG8
2. Data Analytics Made Accessible: Dr. Anil Maheshwari
This book breaks down key concepts into simpler explanations and practical examples.
A good resource for beginners building their foundation.
https://t.co/HmkSLdTqBG
3. Python for Data Analysis: Wes McKinney
A valuable read if you're looking to add Python to your analytics toolkit.
https://t.co/VSmC5QqUTk
4. A Beginner’s Guide to Data and Analytics: Harvard Business School
Data Analytics isn't just about writing SQL queries or building dashboards. It's also about understanding how data helps businesses solve problems and make better decisions.
https://t.co/UpTFipLPhB
5. The Data Warehouse Toolkit: Ralph Kimball and Margy Ross
This classic introduces dimensional modelling and data warehouse design, concepts that are especially useful as you grow in BI and analytics.
https://t.co/a9uvZYTGnS
You don't have to read all five at once. Start with the one that addresses your current learning gap. 📚
Which of these books have you read, and which one are you adding to your reading list? 👇🏽
#DataAnalytics #PowerBI #criticalthinking #data #problemsolving
Learn Power BI in 12 Days
Day 1 – Introduction to Power BI Understand Power BI, its components (Desktop, Service, Mobile), and where it's used.
Day 2 – Connecting to Data Import data from Excel, CSV, SQL Server, and Web sources.
Day 3 – Data Cleaning with Power Query Clean data by removing errors, filtering rows, and fixing data types.
Day 4 – Building Your First Report Create visuals: bar charts, pie charts, tables, and cards.
Day 5 – Introduction to DAX Learn key DAX functions: SUM, AVERAGE, COUNTROWS, IF.
Day 6 – Visual Customization Add new insights using calculated fields and DAX measures.
Day 7 – Data Modeling Create relationships between tables (star & snowflake schema).
Day 8 – Filters & Slicers Use interactive filters and slicers for dynamic dashboards.
Day 9 – Time Intelligence in DAX Build time-based metrics like YTD, MTD, and rolling averages.
Day 10 – Publishing & Sharing Publish to Power BI Service, build dashboards, and share reports.
Day 11 – Row-Level Security (RLS) Control who can see what using RLS roles.
Day 12 – Final Project & Recap Build your first end-to-end dashboard using real-world data!
🧵 DATA ANALYTICS IS MORE THAN JUST MAKING DASHBOARDS.
Let’s talk about what it really means 👇
1/5 📊
Data Analytics is the process of turning raw data into useful insights that help people make better decisions.
Every number has a story. A data analyst helps uncover it.
Excel tip for every Data Analyst! 📊
Why click multiple times when a keyboard shortcut can get the job done faster?
Here are 13 Excel shortcuts to save time and boost your productivity 👇
✅ "Alt + Enter": New line within a cell
✅ "Ctrl + Z": Undo
✅ "Ctrl + +": Insert rows/columns
✅ "Ctrl + -": Delete rows/columns
✅ "Ctrl + Page Up": Previous worksheet
✅ "Ctrl + Page Down": Next worksheet
✅ "Ctrl + ↓": Jump to the last filled cell in a column
✅ "Ctrl + A": Select the data range (when inside a table)
✅ "Ctrl + T": Convert a range into a table
✅ "Ctrl + S": Save your workbook
✅ "Ctrl + F": Find data quickly
✅ "Ctrl + 1": Open Format Cells
✅ "Ctrl + C / Ctrl + V": Copy and paste
Small shortcuts, big productivity gains! 🚀
Which Excel shortcut do you use the most? Add yours👇🏽
#ExcelTips #DataAnalytics #ExcelShortcuts #LearnDataAnalytics #DataSkills
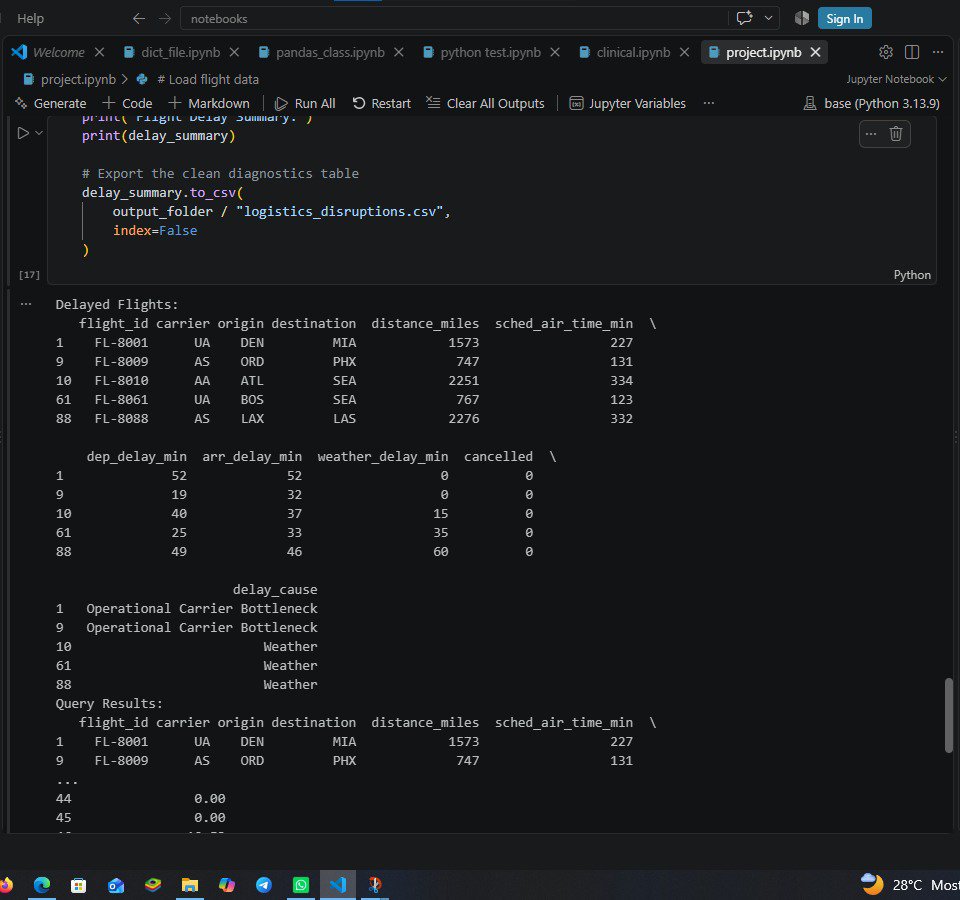
Today, I practised data filtering, categorizing delay causes, and summarizing data using Pandas.
Just putting in the work and getting better at Python🐍📊
#Python#DataAnalytics#EDA