The Everything Code suggests that over time the NDX has a 97% correlation with GMI Total Global Liquidity.
Total Liquidity is at all time highs.
NDX is following.
We have been long tech stocks in GMI (and RV Pro) since Dec 2022 when liquidity bottomed.
Crypto has digested the lagged effect of the US shutdown and liquidity crunch and should follow suit and head back to new highs as the business cycle improves and the Iran war fades. This has been a nasty mid cycle correction in my view and as marginal liquidity was withdrawn it got hit hard but as it comes back, it should accelerate.
Let's see but nothing in my framework has changed. That led me to keep adding into weakness.
Once we hit over 1 standard deviation overbought on the log trend, that'll be the time to take lifestyle chips off. I didn't before because it didn't get to that zone so I added on weakness instead.
Good luck. Let's see...
$BTC.D (1M) - This is where altseason is decided
Bitcoin dominance is back at a key decision point.
And the structure is starting to mirror the previous cycle almost perfectly.
Last cycle followed a clear sequence:
• MACD bearish cross
• Decision point
• Move higher → bullish cross
• Rejection at resistance
• MACD bearish cross again
• Breakdown below 58% → altseason
That final breakdown triggered
a full rotation into altcoins.
Now look at today:
• MACD has printed a bearish cross
• Price is sitting at the same decision level (~58%)
The key question:
Do we break higher first…
or roll over from here?
A direct breakdown could trigger
another rotation into altcoins.
But structurally, a move higher first (like last cycle) would likely lead to a more explosive shift.
Key level remains unchanged: ~58%
As long as BTC.D holds, alts remain suppressed.
Lose it…
and the rotation doesn’t happen slowly.
So many sold their soul to become a bear OR metals analyst right before the biggest run in history.
Disgusting. Vanhallah or death. There is no pivoting.
This is why you can’t script this man.
Reporter: “Who takes over now that the supreme leader is dead?”
Trump: “I don’t know… I guess the position’s open. I’m creating jobs in Iran too.”
😭king.
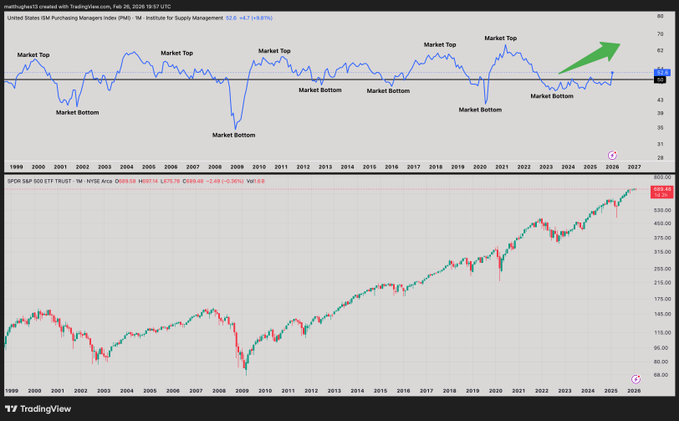
More on #ism data crossing 50 with overlay of #nasdaq#ndx $nq
Green vert lines: $ism crosses above 50
Red vert lines : ISM crosses below 50
green lines show clear pattern of bullish environment
Redlines bearish environment (less sig)
I’m not fading.
@fartcoinbase higher.
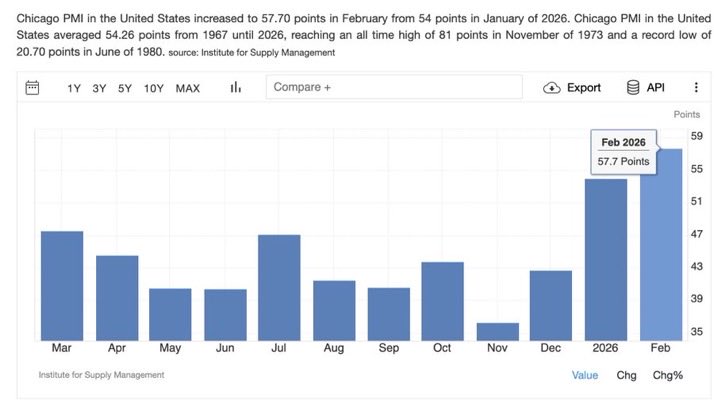
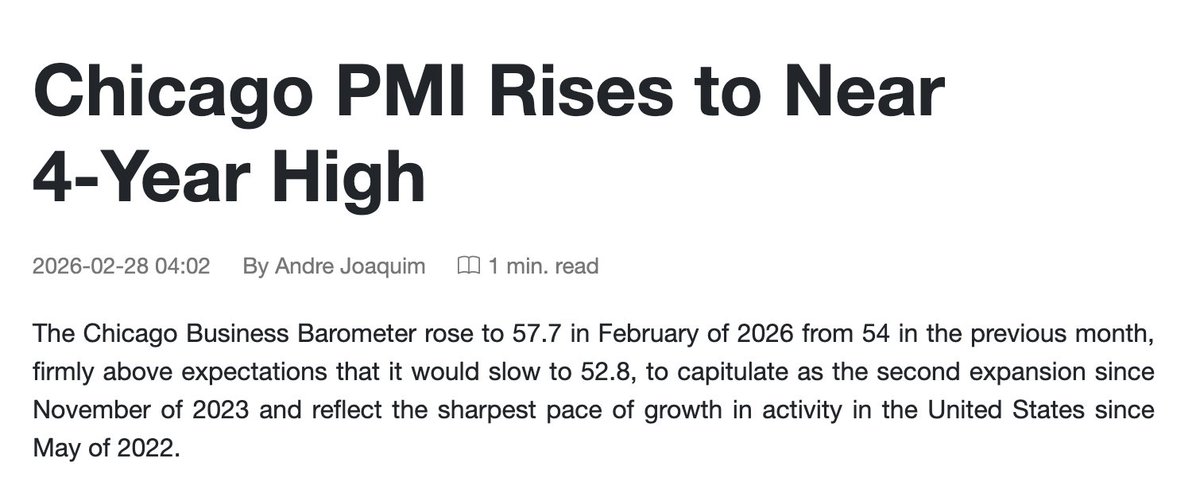
🚨 BREAKING: Chicago PMI just printed 57.7 vs 52.1 expected.
57.7 is by far the strongest reading in years.
Chicago PMI often leads national ISM Manufacturing PMI, which prints Monday.
There’s a direct correlation to +50 and Bull/Alt Seasons… 57.7 is massive
stay tuned for Monday’s National Numbers.
The biggest Alt Season signal is coming up this Monday with PMI ISM numbers.
Every bull market aligns with ISM trending up +50, last month shattered expectations and broke out to 52.6 for the first time in 4 years.
The connection is very clear:
2017 +50: Alts did 20-100x (many did 10,000x)
2021 +50: 10-40X (many saw more than 10,000x)
It's pretty simple, ISM is SPIKING up right now.
Bad actors have been keeping us down.
Clarity Act is coming and further expansion Monday means Alt Season could kick off at any moment.
HODL.
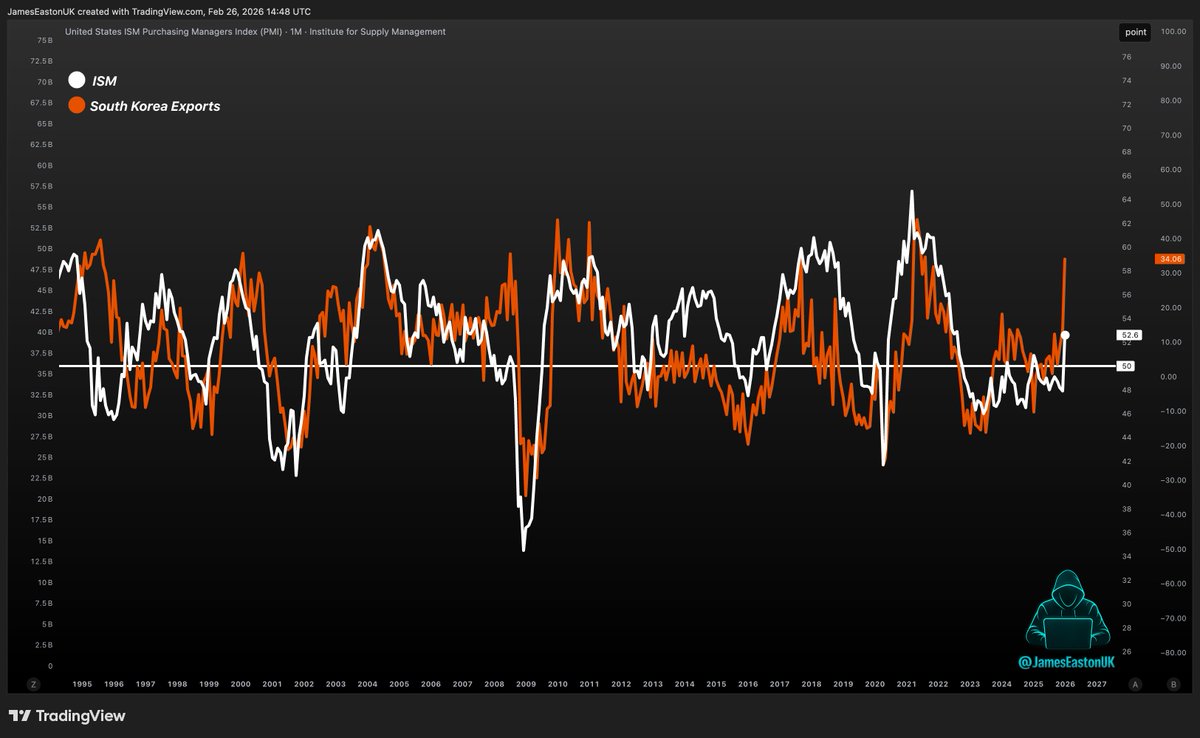
Every major Bitcoin top aligned with an ISM PMI peak.
Now flip it.
ISM PMI just bottomed and is turning higher.
If macro momentum is reversing up, Bitcoin likely already did too.
$60K looks like the bottom.
This has sealed the deal.
ISM will be coming in ever higher on March 3rd.
This will be 2 months straight of solid expansion, beating estimates across the board.
All regionals apart from two are higher this month, and the ones that aren't higher are very similar.
January was 52.6.
February will probably be about 53.
Two months in a row, increasing.
The reason the analysts keep getting this wrong is the same reason no one can see what is actually happening here.
We are expanding, and soon we will be climbing the wall of worry whilst everyone asks.... "why are prices up?"
This is hard economic data, rooted in actual business.
All the signs are there you just need to look.
Chicago PMI just printed 57.7 vs 52.1 expected!
Was 54.0 previously.
Anything above 50 signals expansion, and this is the highest reading in over 3 years.
Serious acceleration in manufacturing activity. Chicago PMI often leads ISM Manufacturing PMI, which prints Monday.