OECD Economic Outlook, Volume 2026 Issue 1
Under Pressure
https://t.co/ZD4wVHXk4L
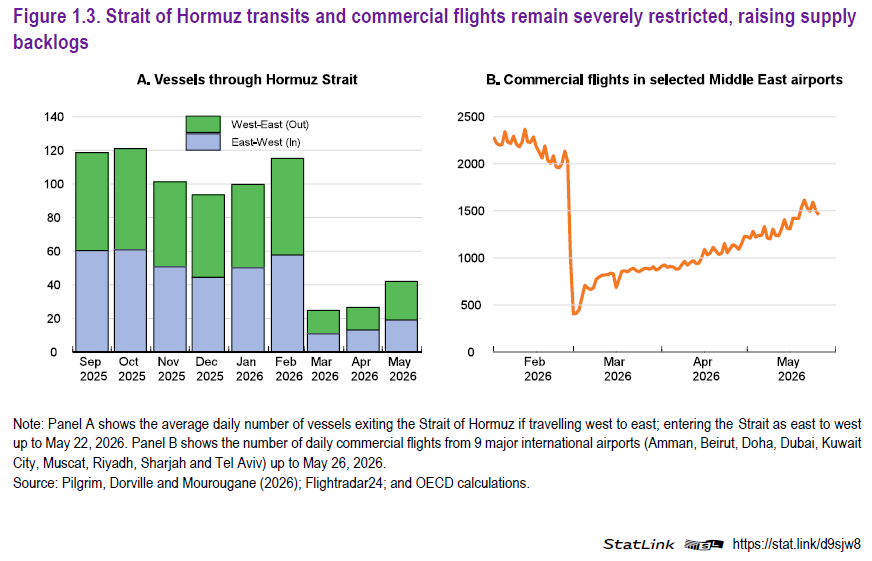
see chapter "From energy shocks to stronger resilience"
"StatLink" at the bottom right of the charts provides the data in Excell👍
On average, June is the highest injection month of the year. If June storage injections behave like April/May, such sub-300 Mcm/d injections will leave storage well below 70% utilization. Just to reach even 70%, injections at the 5Y avg. will be necessary. @ColumbiaUEnergy
This is how Qatar is quietly moving LNG through Hormuz 🇶🇦🚢
💰 Attract seafarers with pay packages double their salaries
🗺️ Go dark during transit by switching off tracking
🤝 Move in small convoys with other tankers
Al Rayyan did all of this in its voyage last week 👇🧵
Excellent chart and one that highlights the upcoming threat to Europe in its need to increase storage injections over the next few months. It serves LNG sellers to push more to Asia now as the price is higher. Plus it will lift European prices for next winter. @ColumbiaUEnergy
So far, only eight LNG cargoes have been exported via Hormuz since the war began. That's tiny compared to pre-war levels of 3/day
But running out of time and patience, Qatar and Adnoc are increasingly deploying these tactics to get LNG through Hormuz
https://t.co/ss9LXirWEP
If upcoming European storage injections continue at their April/May pace relative vs. the 5-year average, storage will be only 68% full by end Oct. That's the lowest end Oct. number since 2012. Overall demand is also lower, but peak demand remains a serious risk. @ColumbiaUEnergy
While overall LNG imports are down by 400 Mcm/d since peaking in January 2026 due to the loss of Qatari volumes, the figures for May show a Y/Y loss of only 32 Mcm/d. Cuts in Europe for May reflect lower storage injections Y/Y. @ColumbiaUEnergy
Glass half bearish?
LNG supply is down only 40 Mcm/d Y/Y
Glass half bullish?
The market has essentially lost one year of supply growth thanks to Qatari and AD losses.
Question
At best, Qatar will return with 85% of existing capacity. Is the glass half bullish or bearish? @ColumbiaUEnergy
COLUMN: The future of LNG.
Supply: away from LNG via the Strait of Hormuz.
Demand: away from LNG itself, into solar and coal.
"... It may sound counterintuitive [....] but the contours of a long-term surplus are already starting to emerge..."
@Opinion
https://t.co/XSHFBknUGD
Reading that power sector gas use in India is on the rise. It's not showing up in the #LNG import numbers just yet. Indian imports are down Y/Y for the fourth month in a row. Prior to the March cuttoff, Qatar accounted for 45% of India's LNG imports since 2024. @ColumbiaUEnergy
Trump on the Strait of Hormuz, with a message to Oman — rather than Iran:
“… Oman will behave like everybody else or we’ll have to blow them up. They understand that…”
Must read from @michalmei on how China has managed to reduce oil imports so sharply without (based on available data) tapping stocks.
She offers an alternative to the ‘China-is-tapping-in-secret-its-SPR’ narrative, focusing on refinery yield shifts.
📑: https://t.co/XmH0RuFf1t
Since LNG supply peaked in January, plenty of focus has been on who's cutting tied to Qatar and Abu Dhabi losses. Here's the top 10 countries that have bought more LNG in April vs. January purchases. Some of these changes are seasonal; others are substitution. @ColumbiaUEnergy
Asia is pulling LNG away from Europe
🚢 🚢 🚢
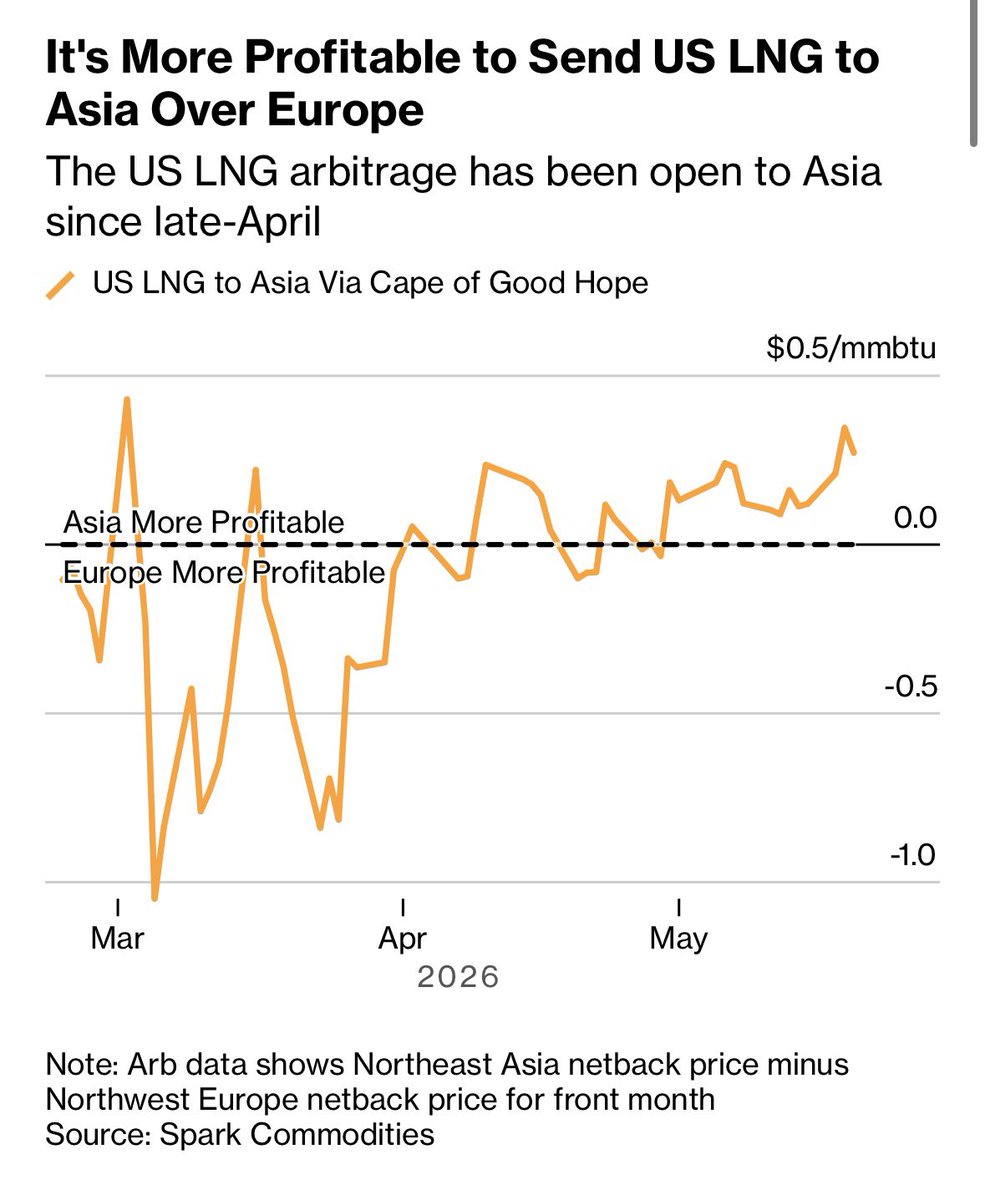
It has been more profitable to send LNG to Asia since late-April
That’s reducing LNG flows to Europe — imports into the region are down 16% compared to this time last year (on a 30-day moving basis)
https://t.co/IIErYazW7h
Two Qatari #LNG vessels out!
The Al Rayyan has Guangdong as its destination, while Fuwairit is bound for Port Qasim.
Courtesy of @WoodMackenzie's VesselTracker.
#TTF#natgas