A PE operating partner asked us to build production AI agents inside a portfolio company's billing system, processing real healthcare claims under HIPAA.
Two people hand-wrote every rule in their claims engine across 300+ denial codes and payer logic that changes quarterly.
Four months later, seven production agents handle it with zero patient data exposure.
First month, we didn't touch a model. We mapped their data: where it sits and what's missing, so agents reason from structured facts instead of guessing.
I've watched teams skip this step across dozens of engagements. They bolt a model onto the product, watch it hallucinate over unstructured inputs, and decide AI isn't ready for their industry. The data work is what makes it ready.
We built an enrichment layer that assembles 34 dynamic variables per claim before any LLM sees it, pre-computed and versioned so the agent receives ranked facts instead of searching for context.
Every agent follows one pattern: pre-compute context, strip all patient data before the model sees it, validate output against a strict schema, let deterministic code accept or reject the action. If the output falls outside the allowlist, the system fails closed.
Seven agents, each locked to a single workflow like denied claim follow-up or billing reconciliation, each running its own enrichment payload.
Then we built the eval harness.
Every agent runs against a curated test suite before any update reaches production. When a model provider ships a new version or payer logic changes, the harness catches regression before a single live claim is affected. The flagship agent reconciles denials to the penny: 59 out of 60 on the eval set.
Most teams launch an agent and hope it keeps working. We launch one and prove it does on every deployment.
We route calls across two model providers. Swapping one changes nothing in the output because the eval harness verifies it.
Model integration was the shortest line item in the four-month build.
The operating partner now benchmarks the rest of the portfolio against this system.
That's the line between a portfolio company running AI and one still running demos.
my eyes usually glaze over at seeing the same skyline transformation pics of shenzhen and shanghai but this is a city almost no one even talks about and that empty first photo was apparently taken in..2006
Americans would rather have a nuclear power plant built in their community than a data center, this may be the worst corporate public-relations fumble of all time
adding the Jeremy Irons quote from Margin Call to every claude prompt these days
"Maybe you could tell me what is going on. And please, speak as you might to a young child. Or a golden retriever. It wasn't brains that brought me here; I assure you that."
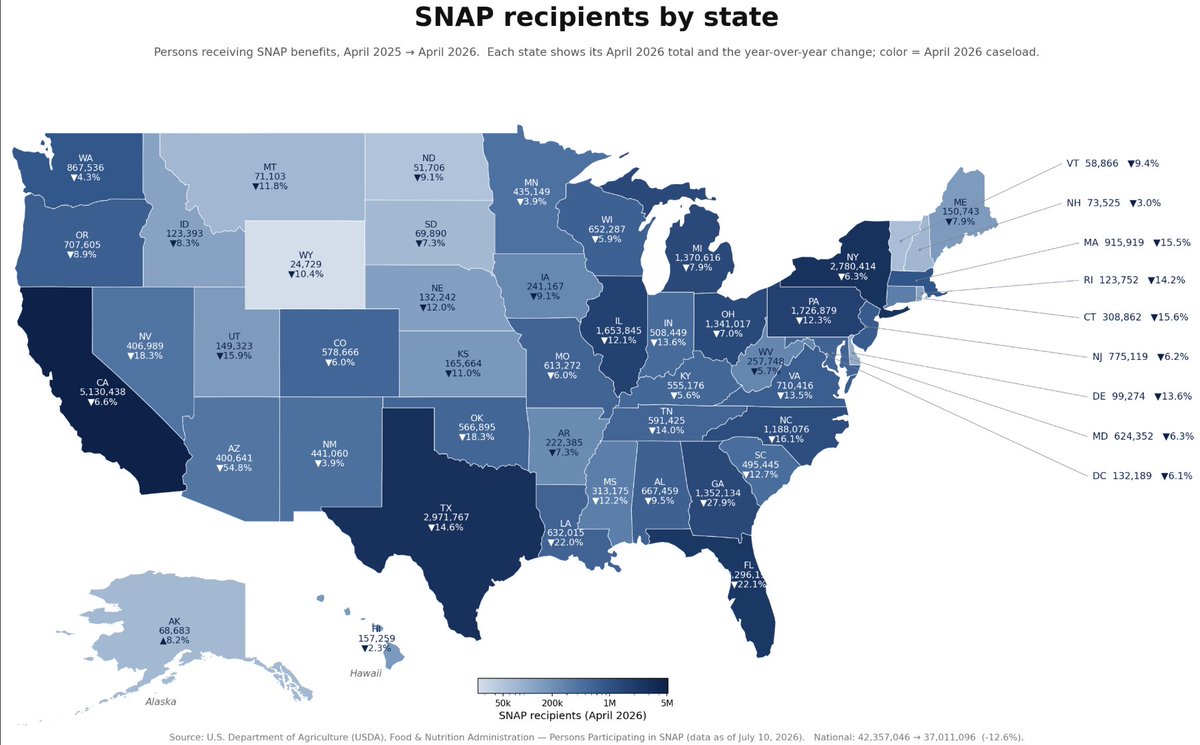
In the early 70s, there were ~4 million SNAP recipients, or about 1/50 Americans. Today there are over 37 million SNAP receipts, or about 1/9 Americans.
That 9X increase wasn’t driven by a surge in poverty. The poverty rate today is notably lower than that of the early 70s.
AI is improving knowledge work faster than most of Wall St appreciates imho. From my own use, it keeps gettin better and faster. Things particularly improve when you make models / agents argue with each other in front of a judge w/ verifier agents. This is all anecdotal, but the gap versus a few months ago is notable to me.
The catch, and I’ve harped on this in the past, is the tools are as good as the curated context (including what services / research you connect)
“Give me the bull case on MU” gets you a meh answer on the chat bot. Point the same model with a harness, curated “source of truth” (curated sources), persistent memory of key debates / work you’ve already done and the output is miles better.
As an example of recent workflow, I had Claude build a “ Refresher”, a living html doc per name / theme for everything I own. It has the basic thesis, a change log since it was last read, estimate changes, valuation, and my leans on the top few debates on the name based on prior work / IBs / emails etc. And where I have no recorded view the model proposes a lean and labels it as its own until I sign off.
The build itself was agents all the way down. 3 agents debated the format, a four-analyst council reviewed each initial doc, all in front of a judge. Most impressively, much of this was done in parallel (ultracode!) in a few hours.
It’s simply never been easier to curious and wild to think this wasn’t possible a year ago.
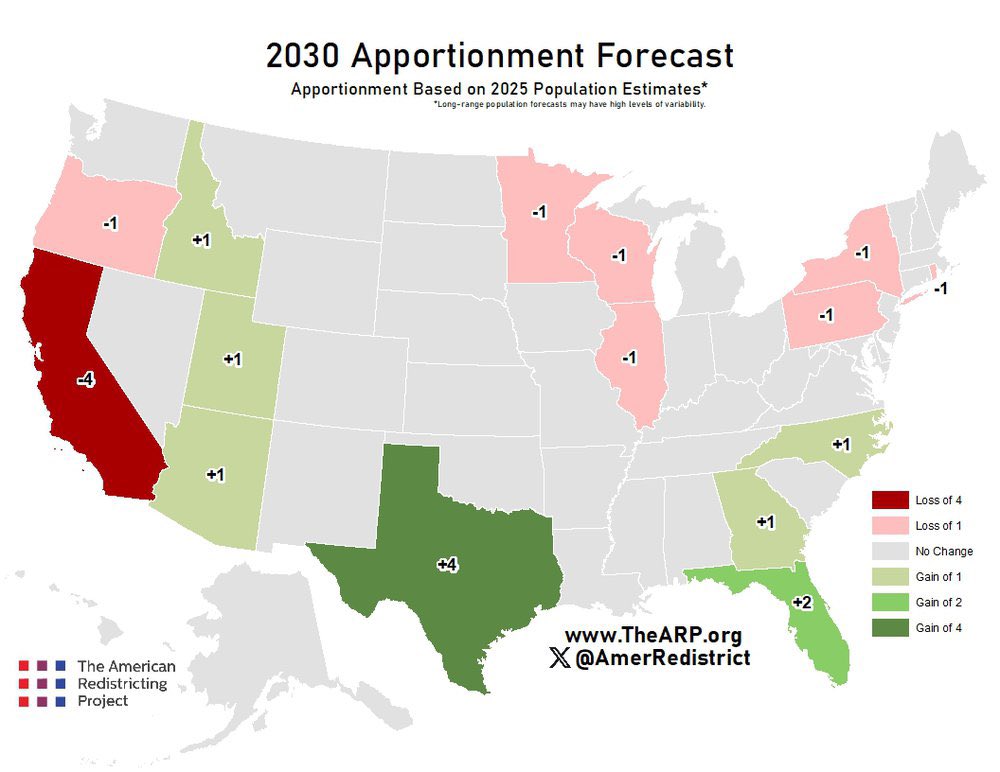
Something interesting to me is currently, the northeast (VA through ME), the upper Midwest (MI/WI/MN/OH/IL), and the west coast currently have a bare majority of House of Representatives seats, but after 2030 reapportionment they no longer will.
In 2008, the travel story was Europeans flying to New York to shop. The euro hit $1.55, the dollar was weak, and Manhattan felt like an outlet mall to anyone paid in euros. 18 years later the Wall Street Journal is writing about the unstoppable American tourist, and Portugal grew American visitors 5x in a decade.
The whole boom is one chart wearing a vacation outfit.
In 2008, the EU economy was 131% the size of the US economy. Today it's 71%. Europe went from a third bigger than America to a third smaller in the span of one iPhone.
Per person it gets worse. EU GDP per capita was 76% of America's in 2008. By 2023 it was 50%. Half. The average American now out-earns the average European by more than the average European earns.
In 2000, France was as rich as the 36th richest US state. By 2021 it had fallen below Arkansas. Germany dropped to Oklahoma. Italy sits below Mississippi, the state Americans use as the punchline for poor.
A software engineer in Lisbon earns €35,000 to €40,000. The same engineer in New York clears $170,000. Same job, same laptop. He books a month in Portugal, eats out every night, and his bank account grows.
If the trend holds, by 2035 the US-Europe income gap equals the gap between Japan and Ecuador today.
Europeans flew west in 2008 because of a currency blip. Americans fly east in 2026 because an entire continent's paycheck stopped growing for a generation. Only one of those trips ends.
For every dollar apartments returned to investors between 1978 and 2020, roughly 68 cents came from rent. The remaining 32 cents came from appreciation.
What happened heading pre/post covid was the exception, not the rule.
What a $1m grant from 2023 at @AnthropicAI and @OpenAI is worth today.
Anthropic: ~$51m
OpenAI: ~$16m
These figures are adjusted for dilution. Anthropic has had an incredible run in the last few years, and it clearly outpaced OpenAI in growth.
Part of it is that OpenAI was already at a ~$30B valuation in 2023, while Anthropic was trailing at ~$4B.
Anthropic’s valuation went up 235x from there. OpenAI’s went up ~28x.
Anthropic diluted about twice as much in the same timeframe, ~78% vs 39% at OpenAI.
You can view the timeline of some of the tender offers issued along the way too.
The phrase “kubota properties” is always rattling around in my head. It’s probably the most incisive thing ever said about rural america on this app.
@Empty_America
It’s interesting that Pittsburgh has attracted all these heavy hitter tech companies, become the exemplar of the meds n eds economy, and has such a huge presence in cutting-edge robotics and yet that hasn’t translated into any regional population growth. It’s down almost 100,000 people since 2000 and down 35,000 since 2020.
From an owner-operator standpoint, the most important quality in a tenant (other than ability and willingness to pay rent) has to be graciousness.
Have a tenant in south LA who’s tatted all over, every inch of his body. But every interaction: “hey man, so sorry to bother you, can you please xyz?” Or “thank you so much man,” and if I ever lag a little, “don’t worry it’s all good man I know you’re busy, we’re good, thanks again”
Then I have this young couple in Silver Lake. “The sink is dripping.” “I saw a cockroach outside, send the bug guy.” And when things get done, silence. Never a thank you. Just absolute pieces of shit.
Similarily, France has a law where hiring a licensed architect becomes mandatory for housing units >150 sq m.
Consequently, the graph of house sizes each year looks like this.