$SILJ / $SILVER
Miners versus silver. Since 2016, SILJ has lost roughly 60%+ versus silver itself.
And what do we have now?
Compression after a multi-year relative downtrend.
This type of triangle usually does not appear out of nowhere. When it forms after prolonged weakness, the default assumption is continuation lower; unless the ratio can break and hold above the upper trendline...
So again: don’t shoot the messenger.
Silver miners are still not proving leadership versus silver itself...
The precious metals complex is in the early stages of rebounding from deeply oversold levels, but Iran-related developments are a key factor in determining how that rebound unfolds.
Learn more in my latest update:
https://t.co/oZmLL5zzQJ
$PHYS $PSLV
China’s gold recycling industry is now growing at the fastest pace in a decade.
Think carefully about what that means.
China is not behaving like a country expecting cheap and abundant precious metals in the future.
It is building infrastructure to RECOVER every possible gram.
- hundreds of new recycling firms
- explosive growth
- massive investment demand
- booming bullion accumulation
- expanding gold trading networks
At the same time:
Gold jewelry demand is falling.
But gold bar and coin demand just surged +46%.
That is not luxury buying.
That is monetary behavior.
People are shifting from decoration… to protection.
And here’s the part silver stackers should understand very clearly:
Gold usually moves first.
Silver tends to move later…
but far more violently. 🥈
Because silver is not only money.
It is also:
- electronics
- AI infrastructure
- solar
- military systems
- robotics
- medicine
- energy transition infrastructure
Gold is mostly stored.
Silver is consumed.
Destroyed.
Scattered.
Irrecoverable in many industrial applications.
So when nations start aggressively securing and recycling precious metals infrastructure…
you should probably ask yourself what they see coming.
The East is preparing for a world where real assets matter again. 😄🥈
#Gold #Silver #SilverStackers #PreciousMetals #SoundMoney #SilverSqueeze
India just changed silver imports from “Free” to “Restricted.”
That is NOT the same thing as a tariff hike.
A tariff only makes silver more expensive.
A restriction means silver imports now require permission.
Read that again carefully.
India is no longer just taxing silver demand.
It is trying to CONTROL the physical flow of silver into the country. 🥈
And that matters because India is one of the largest physical silver buyers on Earth.
Why would a country do this?
Because silver is no longer behaving like a normal commodity.
It is:
• an industrial metal
• a monetary metal
• a store of value
• and a drain on dollar reserves during import surges
When energy-importing nations start restricting monetary metal inflows, it usually means pressure is building somewhere in:
• trade deficits
• forex reserves
• currency stability
• or dollar liquidity
Now think about the consequences:
→ Physical supply tightens
→ Domestic premiums can rise
→ Importers lose flexibility
→ Inventory hoarding accelerates
→ Paper price and physical price begin diverging
This is how real stress slowly appears in commodity systems.
Not with headlines.
With controls.
Silver is increasingly being treated as a strategic asset.
And markets usually realize the significance too late.
#Silver #SilverStackers #SilverSqueeze #COMEX #MCX #PreciousMetals
I DON'T THINK YOU UNDERSTAND WHAT JUST HAPPENED.
The entire US Treasury yield curve just broke simultaneously.
2yr. 5yr. 20yr. 30yr.
All at the exact same moment.
This is not a glitch.
Only one type of seller moves like this.
A sovereign. A central bank. A country.
China holds $700B in US Treasuries.
Japan holds $1.24T. UK holds $897B.
If any of them started exiting today…
This is exactly what it would look like.
The bond market is the largest on earth.
When it breaks like this something is fundamentally wrong.
Stocks haven't reacted yet.
But they will.
Watch this week very closely.
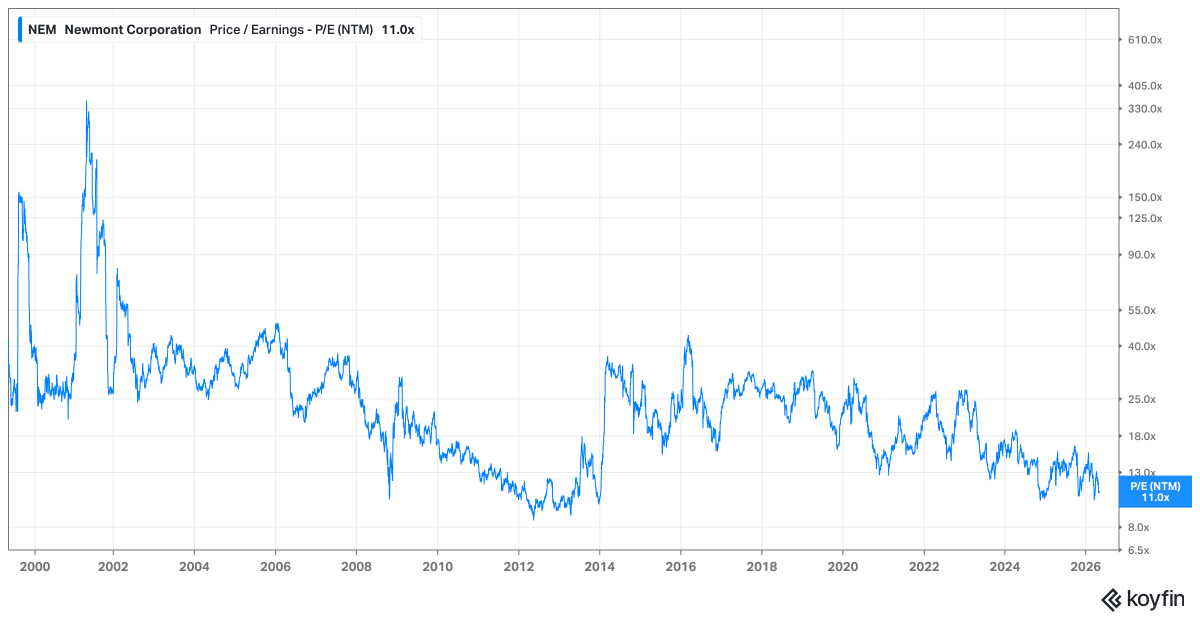
There is a huge bubble in gold mining stocks. Newmont's forward P/E ratio just dropped to 11, which is one of the lowest readings in the last 10 years.
$NEM
The majority looks fantastic to me. Combine that with the weekly view, where indicators are at rock bottom and a new weekly cycle is about to start, and it suggests significant upside ahead.
Here are some examples:
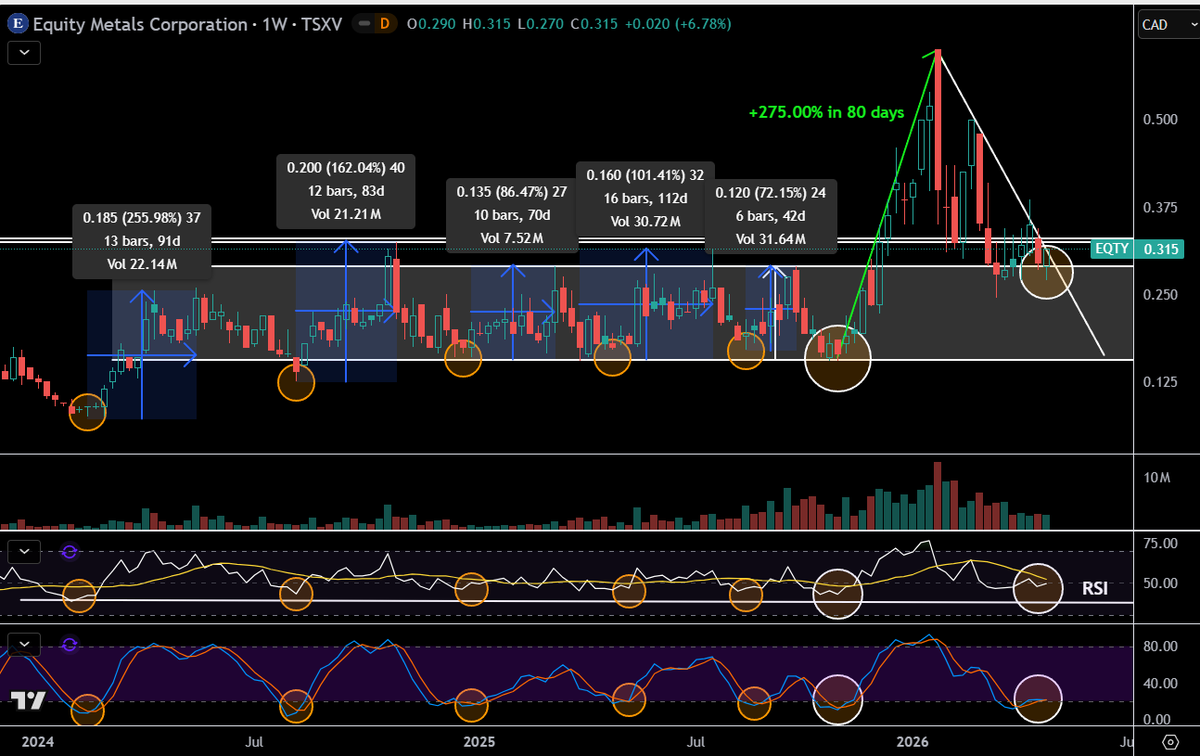
Chart #1:
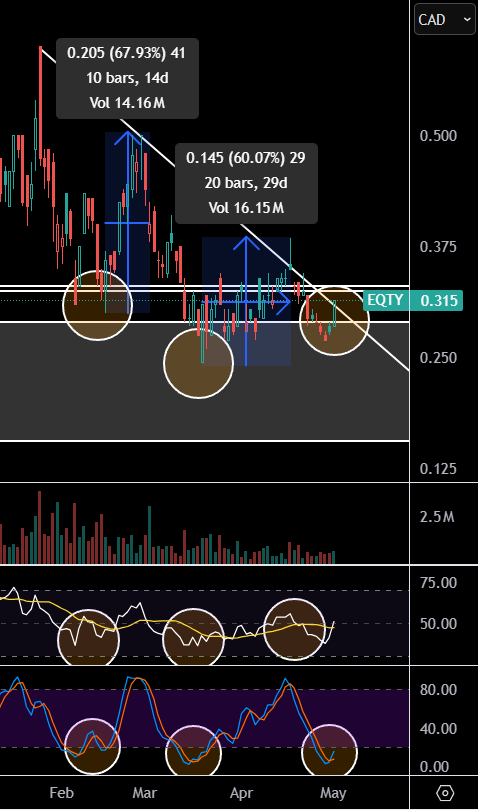
$EQTY.v - Equity Metals Corp
This pattern and indicator have been 100% accurate since the #Silver move began in February 2024.
+255.98% in 91 days
+162.04% in 83 days
+86.47% in 70 days
+101.41% in 112 days
+72.15% in 42 days
+275.00% in 80 days
Average gain: +158.84%
Average time: 79.7 days
The stock is on the verge of breaking its downtrend line aswell as dropping a long awaited updated MRE that should serve as extra fundamental fuel for upside. As they most likely have grown their resource with 100% since the last MRE.
Easy buy right now, and looks great on the chart.
-------------------------------------------------------
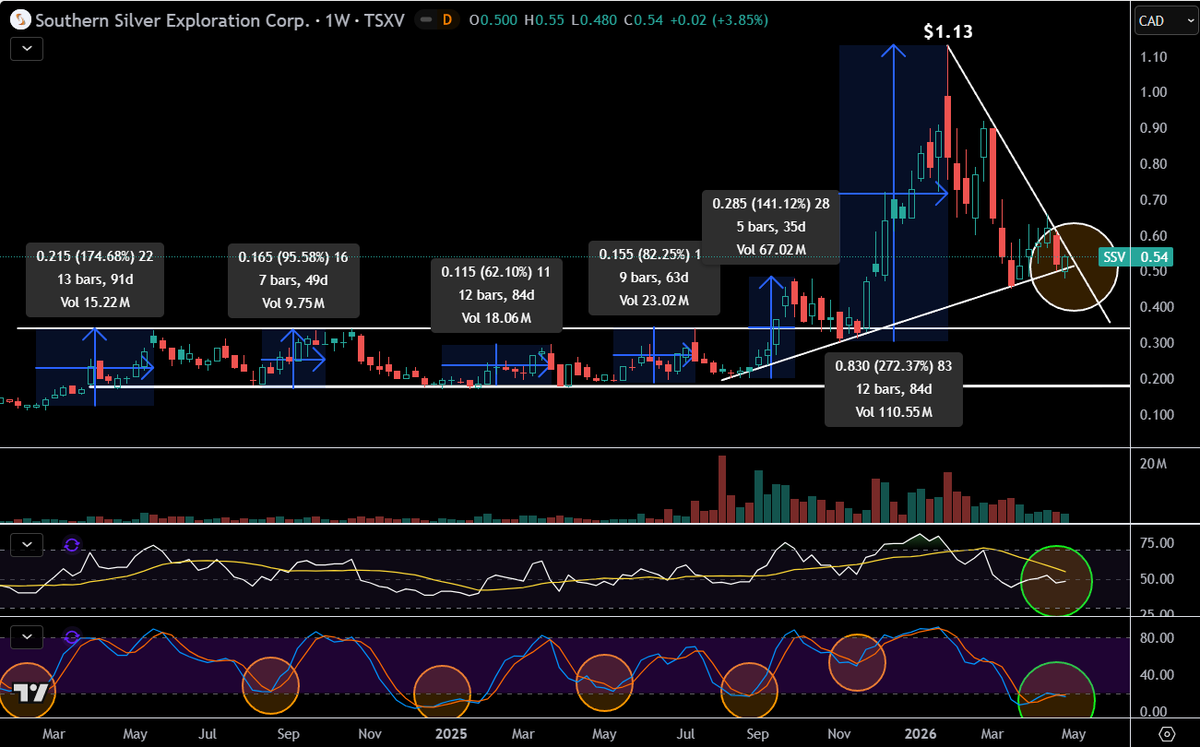
Chart #2:
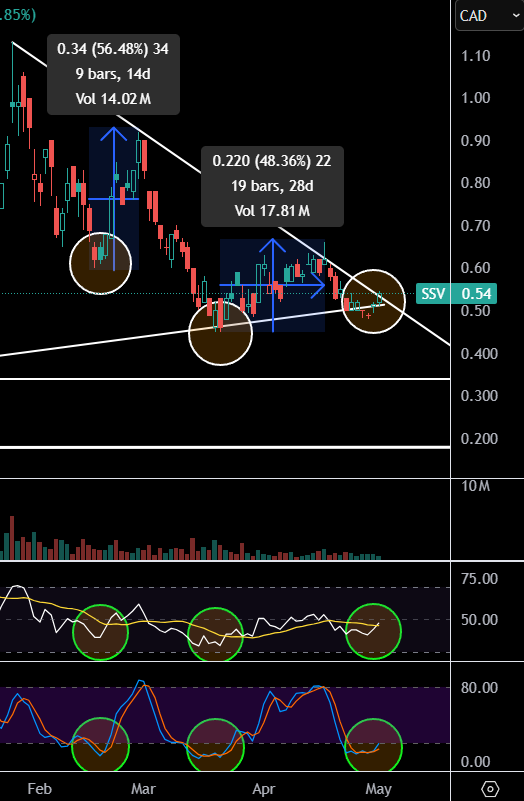
$SSV.v - Southern Silver Epxloration
This pattern and indicator have aswell been 100% accurate since the #Silver move began in February 2024.
+174.68% in 91 days
+95.58% in 49 days
+62.10% in 84 days
+82.25% in 63 days
+141.12% in 35 days
+272.37% in 84 days
Average gain: +138.02%
Average time: 67.7 days
The stock is just as EQTY on the verge of breaking out from its downtrend here. Which it will most likely next week already, if USA aint attacking Iran. Fantstic entry level and a fantastic company. One of the top 10 best silver projects globally. SSV is a no-brainer buy here and doesnt look terrible on the chart and both the daily and weekly indicators are at rock bottom and load up zones for #EASY #MONEY.
-----------------------------------------------------
Chart #3 and Chart #4 shows their daily zoomed in.
Note: Basically all my miners look similar on the charts and with the indicators. And both the daily and the weekly indicators tells more about direction than any lines drawn do. (IMO)
The pattern speaks for itself.
The only thing that can stop the #miners from going higher here are a restart of the #Iran war.
Sadly, if the #Iran situation starts again, the chart gurus who been bearish will come out and brag they called it and that it was easy to spot in the charts... In reality they have just been "saved by the bell".
PS: Im not refering to you here @badcharts1 -
And a sidenote to followers: Patrick Karim is a legend in the mining sector and been a big voice and contribution to our community for many years together with @NorthstarCharts. (So im not bashing here!)
Repost if you own $EQTY and $SSV, they are super good buys around current levels, and any further weakness should be considered a gift.
Just published a working paper on why the standard DCF systematically misprices gold producers.
Three case studies from junior to senior. Builds on @DonDurrett's in-situ valuation logic and engages Erb-Harvey directly.
Critical reads from the community welcome.
https://t.co/SL894rfNpl
11 of these in my book. Happy to see the list.
Honestly insane how undervalued these still are at current gold and silver prices.
APGO sitting on $59M cash with the Calico PEA dropping Q3-Q4 2026 and Cinco de Mayo as a kicker. SSV with Cerro Las Minitas NPV well north of $1.5B at spot vs a $15-20M market cap. AUMB at $0.99 with Durrett targeting $10.
Surprised not to see GLDG on this list though. Whistler PEA dropped solid metrics, La Mina PEA out April with NPV $1.8B at spot, USGO sub already trading separately, and the market cap is what... $250M? As dumb as a mud wall.
The DCF framework doesn't capture what these companies actually are. Multi-baggers.
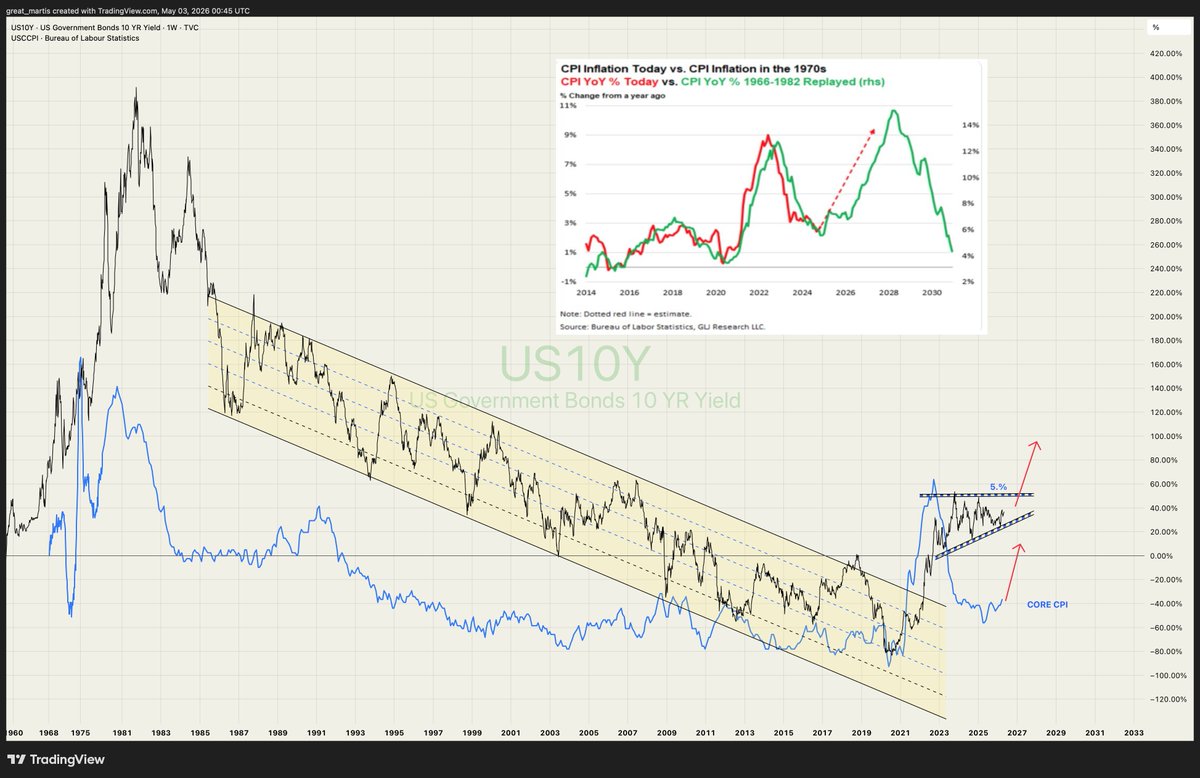
🚨 US10Y Yields Are About to Replay the 1970s Inflation Nightmare (Inflation is much higher IF we include shelter.)
The message is crystal clear: we’re at the exact inflection point where the 1970s playbook restarts .. unless something breaks the cycle.
The 1970s delivered 30 - 40%+ market swings (stocks, bonds, real assets) during that era of reckless government intervention .. wage/price controls, endless fiscal stimulus, the end of Bretton Woods, oil shocks, and monetary chaos. Volatility was brutal because the system was levered to the hilt and policymakers kept kicking the can. Sound familiar?
Here’s what awaits if we DON’T get a proper deleveraging event now:
US10Y yields rip sharply higher bond prices get obliterated, mortgage rates explode, corporate refinancing becomes impossible.
Persistent/re-accelerating inflation erodes real wages and savings while the debt supercycle rolls on.
Equities face stagflation-style 30 - 40%+ drawdowns (or worse) as higher yields suck liquidity out of risk assets.
The chart isn’t predicting rain… it’s showing you the storm is already forming on the exact same coordinates as the last one.
Deleveraging is coming .... either the controlled, painful kind (recession + tight policy) or the disorderly kind (inflationary blow-off + 1970s-style chaos).
Markets don’t let you run trillion dollar deficits and zero real rates forever.
History doesn’t repeat… but it sure as hell rhymes.
Yours truly,
The Great Martis✨
She's beautiful .
A new era for the mining industry.
Miners are generating roughly 7x what they did at the peak of the last cycle.
I’m old enough to remember when this space was considered “uninvestable” by the so-called experts.
Game on.
https://t.co/ssIdeKrny6
BREAKING: Tether purchased +6 tonnes of gold in Q1 2026, bringing total holdings to a record 132 tonnes, now worth ~$19.8 billion.
This follows +21 and +26 tonnes acquired in Q4 and Q3 2025.
Tether’s gold holdings have more than DOUBLED in just 12 months and nearly TRIPLED in value over the same period.
In 2025, the crypto firm acquired more gold than every central bank except Poland.
In Q1 2026, the only central banks that bought more gold were Poland, Uzbekistan, Kazakhstan, and China.
Tether is competing with central banks for gold.