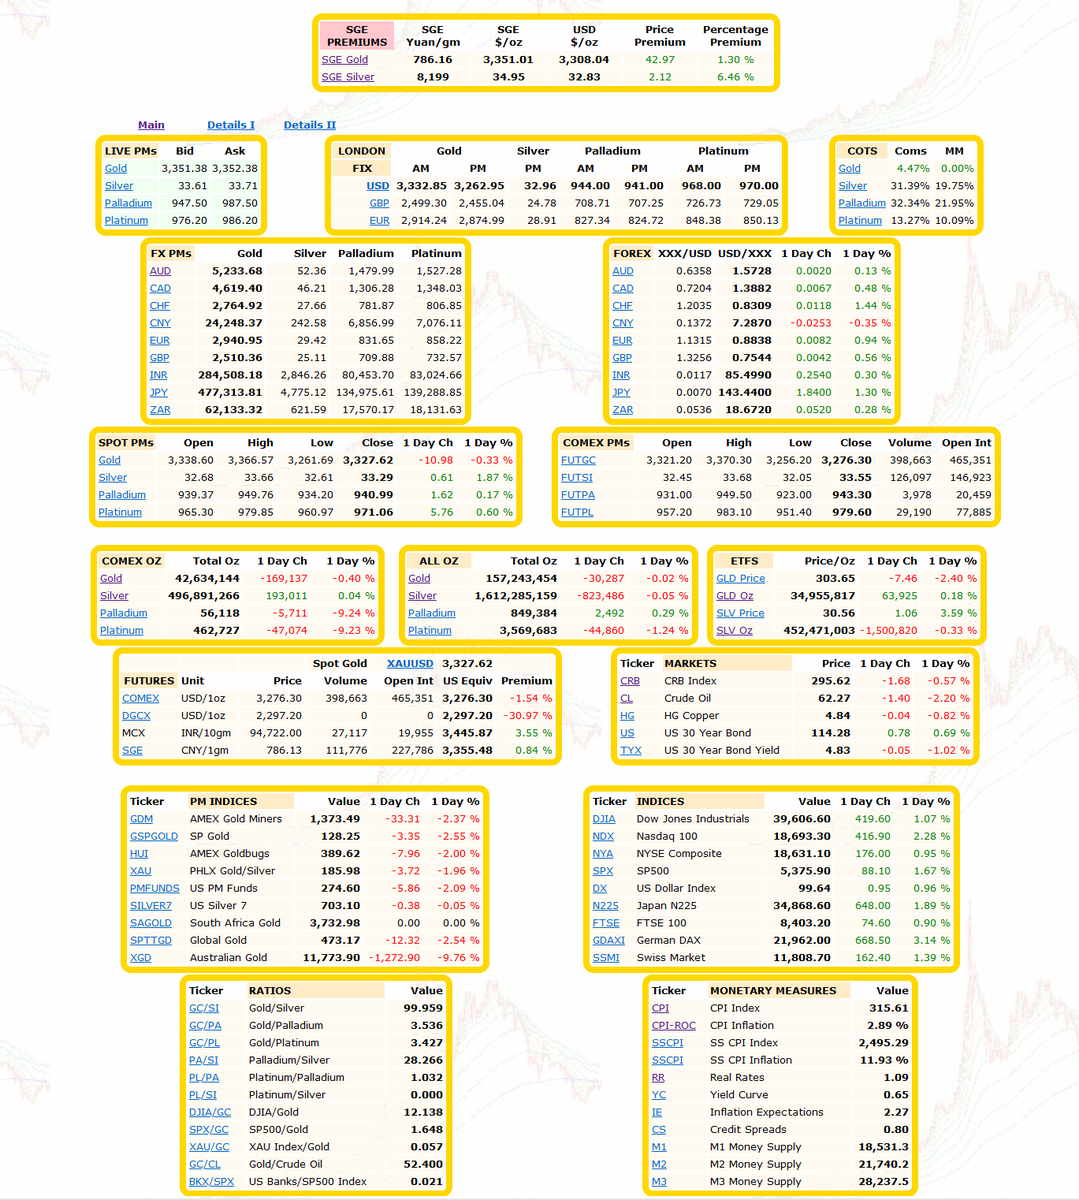
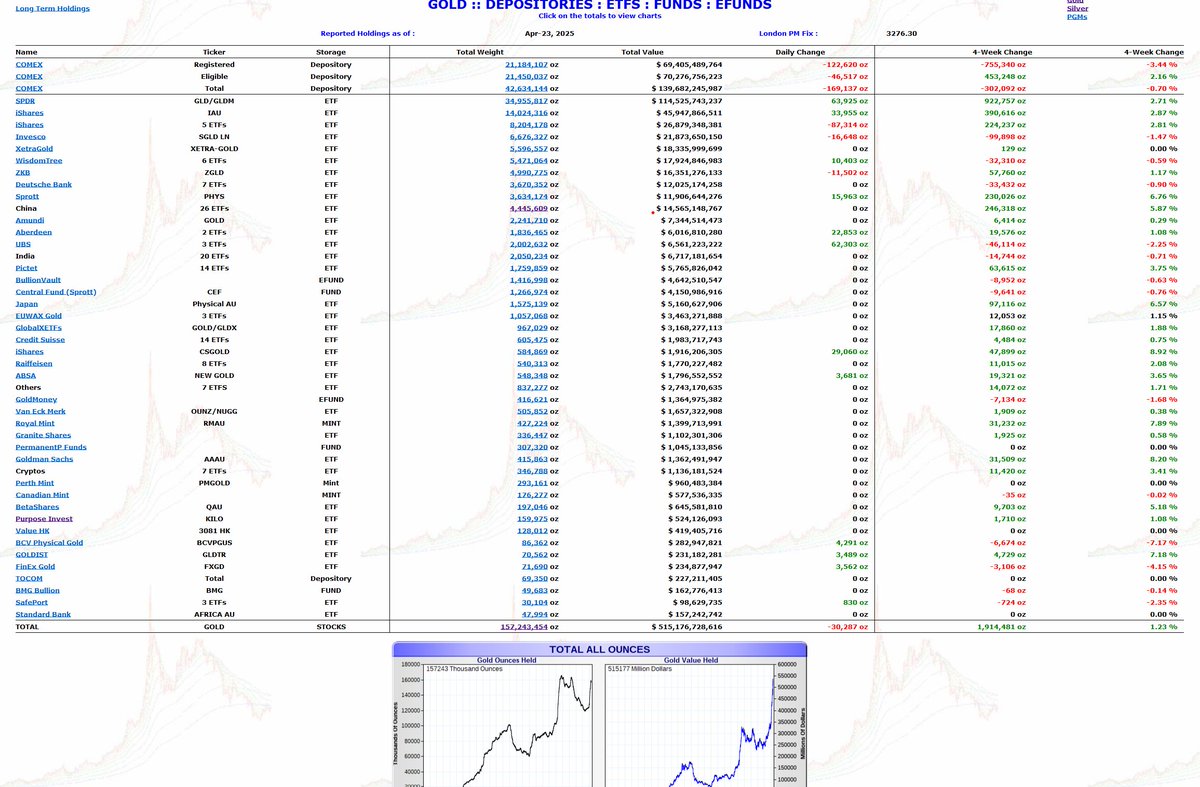
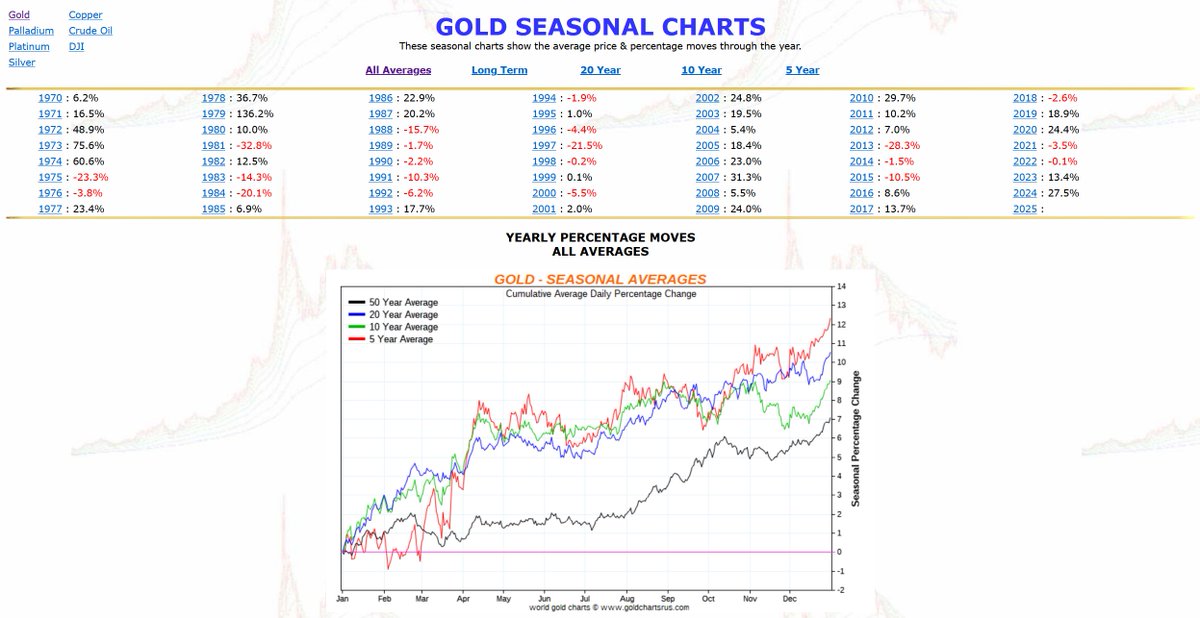
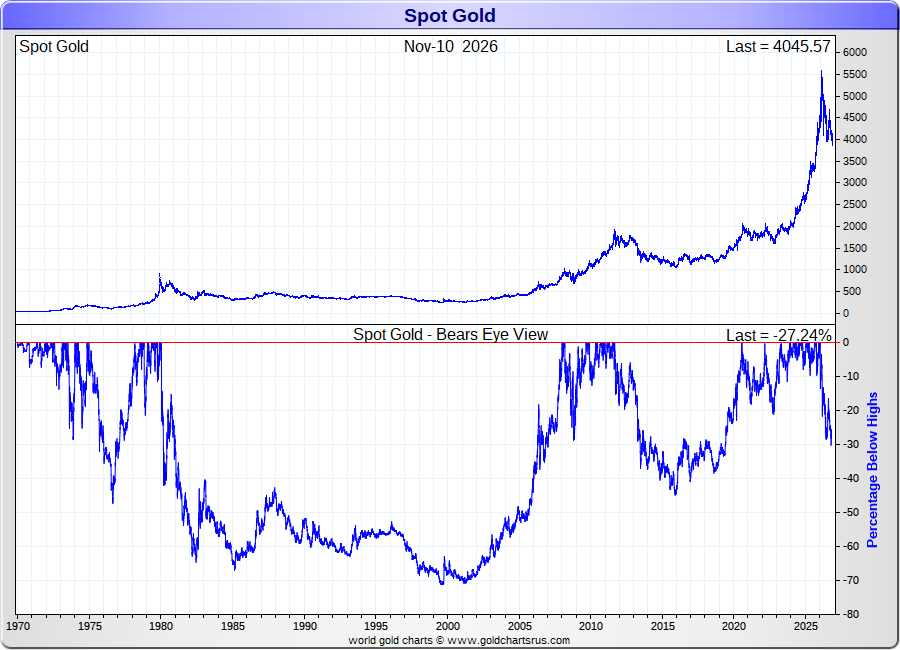
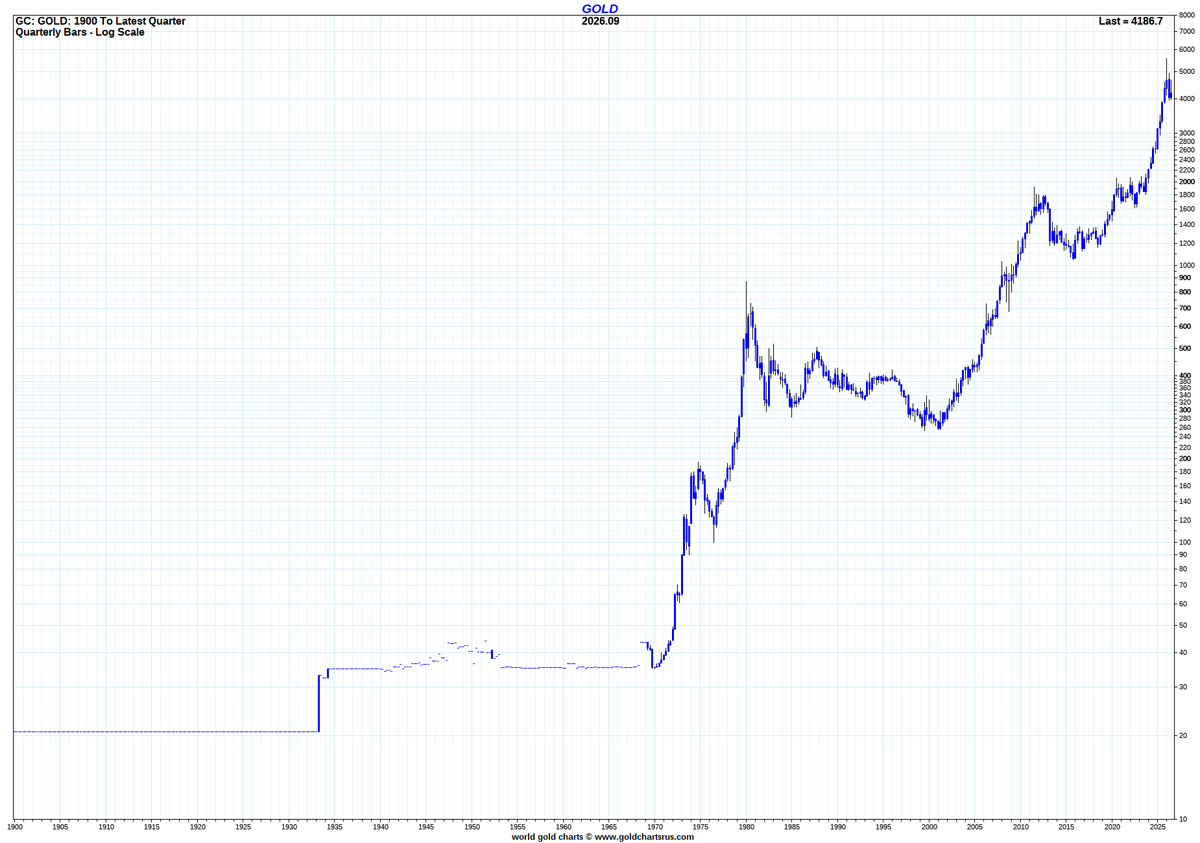
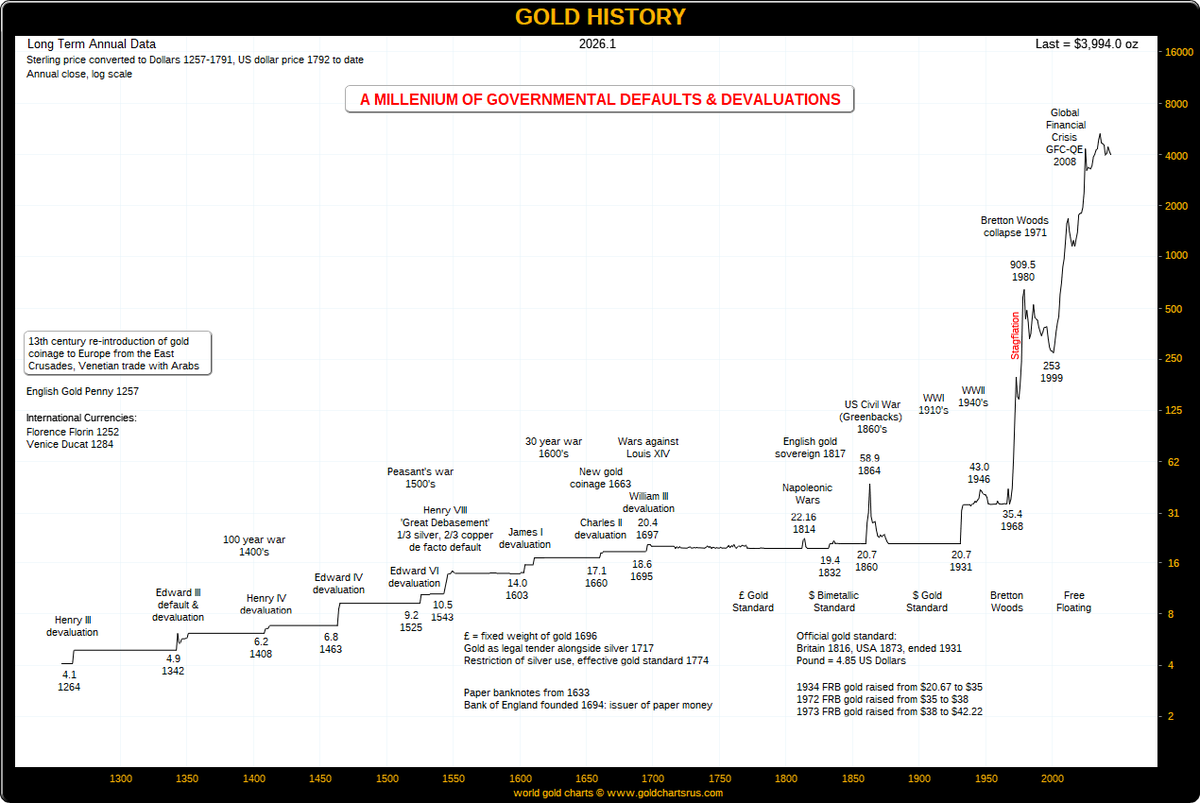
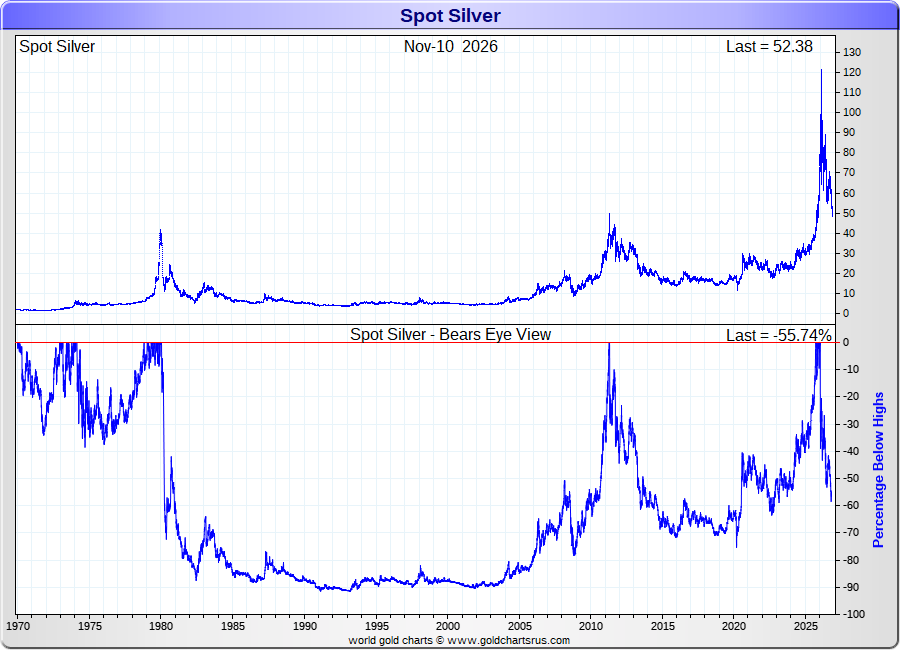
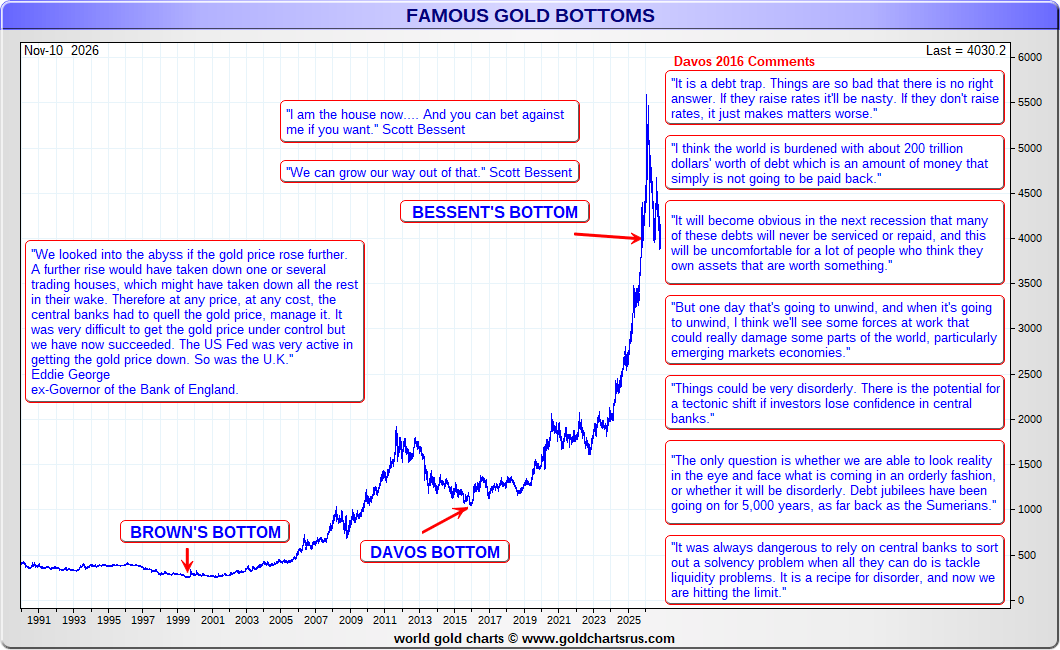
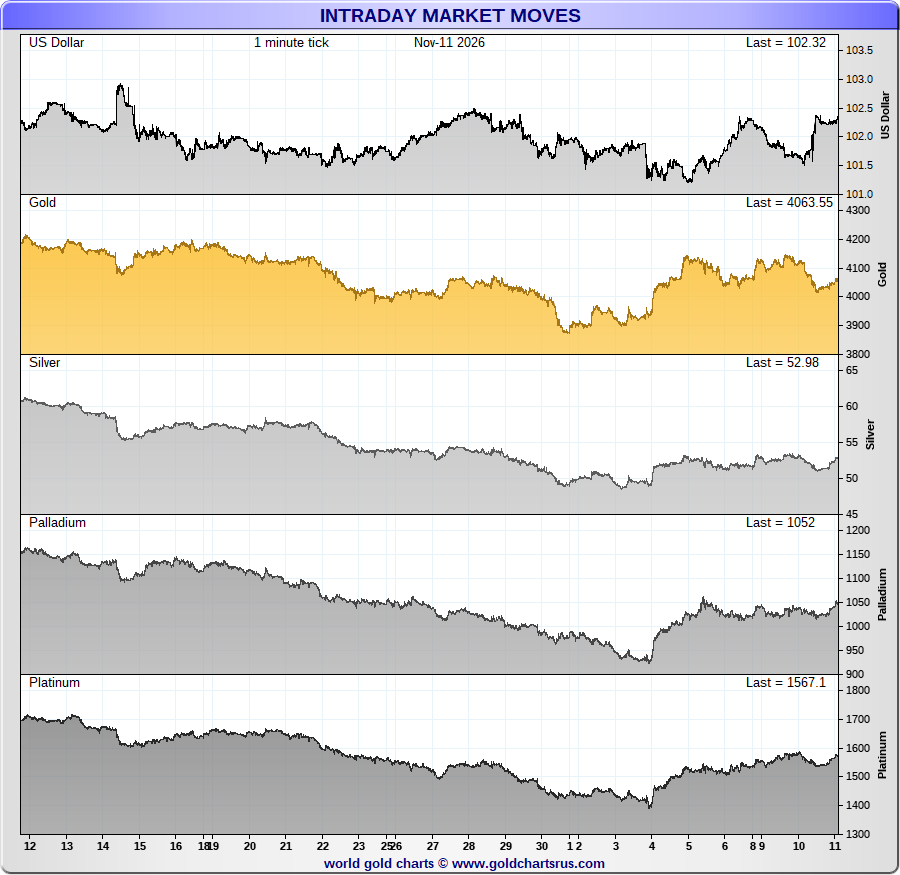
All these charts and 1000's more available on my website https://t.co/O9xLBLAk0U for the price of a coffee. Over 75,000 charts on 8,500 pages dedicated to gold, precious metals & financial markets.
The website is old school built in php/html on notepad & an old XP box. It is not HTTPS but is entirely safe to use. It will never be updated nor replaced & you will find many charts here that you won't find anywhere else on the web. The website has been designed around online databases updated intraday/dailyweekly/monthly that allow all the 1000's of charts to update.
It shows one man's obsession with gold & historical data & the ability to write charts in code to show unique insights.
With so many charts to view you will find out why I perceive charts as golden conveyors of information.
A picture is worth a thousand words & a charts shows a lifetime of prices.
BREAKING: Global central banks bought +321 tonnes of gold in Q3 2026, their largest quarterly purchase since Q4 2024.
This also marks their 5th-largest quarterly purchase on record.
Central bank gold purchases were up +8% from +296 tonnes acquired in Q2 2026 and up +453% from Q1 2026.
By comparison, the 5-year quarterly average stands at +227 tonnes.
China and Poland led Q3 demand, adding +63 tonnes and +40 tonnes, respectively.
Year-to-date, global central banks have purchased +675 tonnes of gold, up +6% from the same period in 2025.
Central banks are aggressively buying the dip in gold.
Historical Gold-to-Silver Ratio chart (1687–2025)
The ratio remained relatively stable for centuries under monetary systems that often fixed or influenced the relationship between the two metals.
Since the transition to freely floating precious metals prices, it has experienced extraordinary swings. The historical annual average from 1687–2025 is approximately 29:1, compared with roughly 60:1 since 1971.
In January 1980, the ratio briefly fell toward 17:1.
During the extraordinary silver rally of April 2011, it declined toward 31:1.
These were not identical market conditions, and there is no guarantee that those extremes will recur.
But they illustrate how dramatically silver’s purchasing power relative to gold can change.
Full Research link below 🔗
Four days ago, Dr. Judy Shelton concluded her Mises Institute presentation with a final observation, stating, “Things are getting plenty interesting out there, both at home and abroad. So buckle up.”
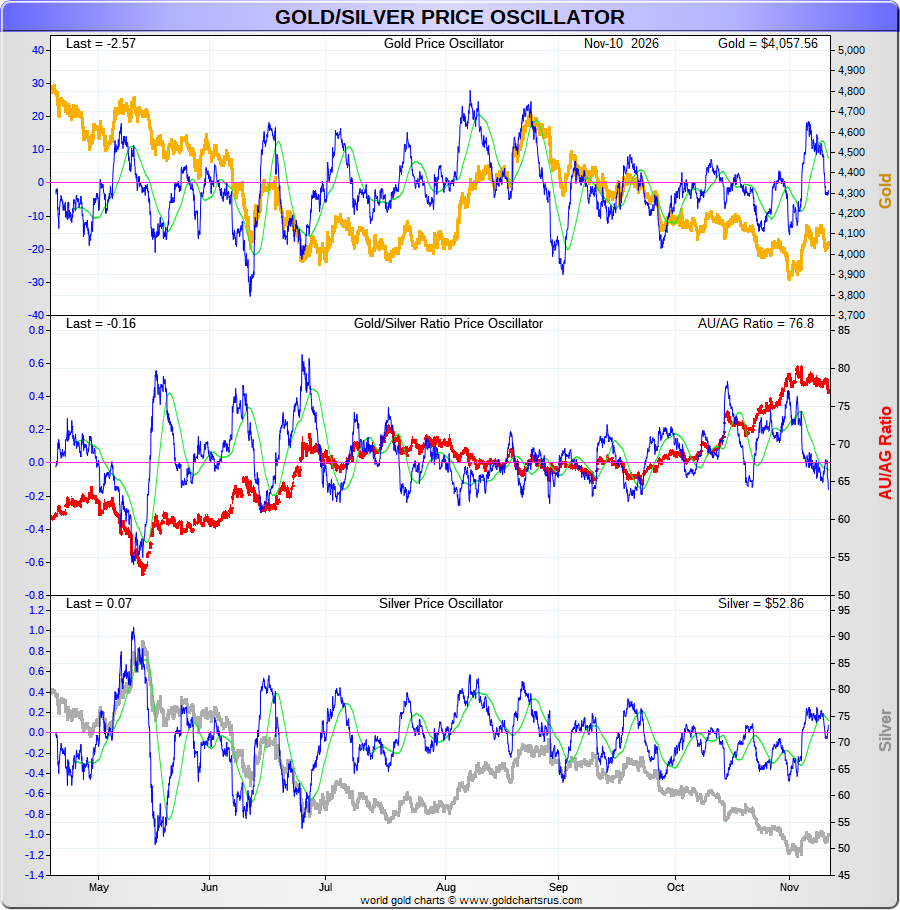
That's why I like the GSR P/O for the short term moves - it's the inner heartbeat for gold.
As for the long term - the trend is your friend & when long for decades patience is well rewarded.
So many sweat the upticks & the knock downs but when long from way below they are just noise.
Especially when you understand why there is the uptrend in the long term.
Gold is the constant in valuations & fiat is the rouge that runs wild.
Gold is the constant in purchasing power (think suit) whilst fiat, which us mere humans use to value gold is the mercurial substance of fleeting value.
All valuations get stretched by gold's constancy.
We have little ability to predict short-term gold price movements, a skill best practiced by bullion bank traders who see real-time capital flows. We can’t compete with AI trading bots capturing every squiggle on the charts. We remain confident, however, that the dollar system (and by extension the world) remains in the largest credit bubble the world has ever seen, that the A.I./Treasury bond bubbles are nearing their ends, that gold is the surest asset to ride through the collapse, and that gold miners offer operational leverage to that bet, enabling a small amount of capital to insure the value of a much larger portfolio.
Luke Gromen believes the United States will ultimately be forced to revalue gold to between $15,000 and $20,000 an ounce, or potentially $26,000 to balance trade with China. He argues that defending the dollar over the bond market risks deindustrialization and critical shortages, which will eventually force creditors to demand physical gold. In his view, a gold revaluation would eliminate sovereign debt burdens and revitalize domestic manufacturing, though it would create substantial inflation. He expects this reset to arrive either through proactive policy or via an acute bond crisis.
You have 3 very interesting developments unfolding in the global gold market:
Singapore:
Its central bank has launched a service to store gold for foreign central banks, with a capacity of 500 tonnes.
China:
Beijing is courting foreign central banks to buy and store gold in China through the Shanghai Gold Exchange.
Hong Kong:
Authorities are seeking participation from foreign central banks in a new gold-clearing system, while aiming to expand gold storage capacity to over 2,000 tonnes.
Watch this closely...
A scramble is playing out.
Change happens:
Monetary Authority of Singapore will now compete with the NY Fed & BofE for the custody of sovereign gold reserves.
https://t.co/Tql55X0Ywv
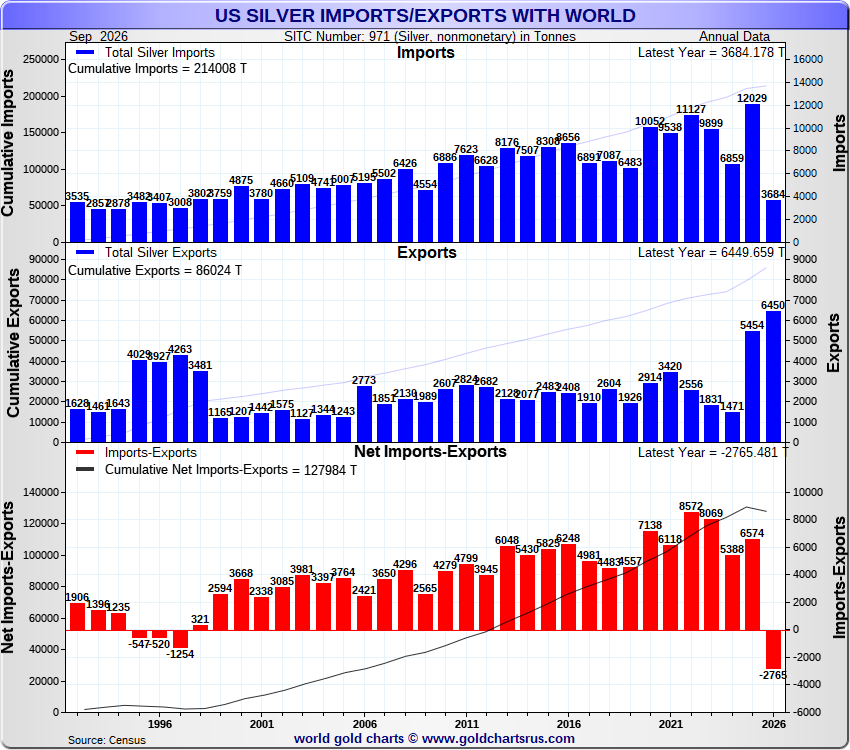
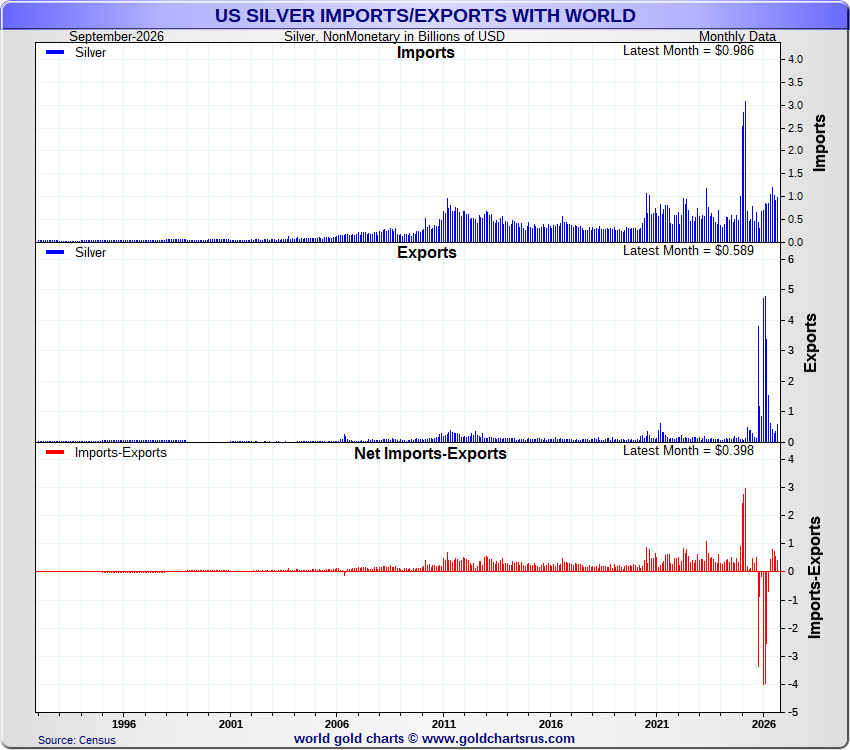
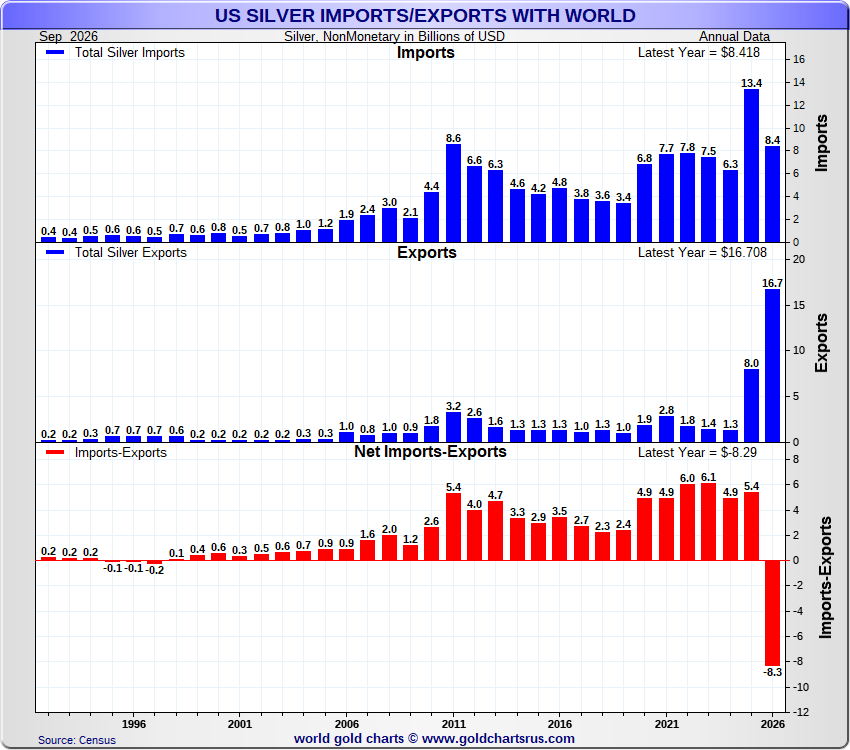
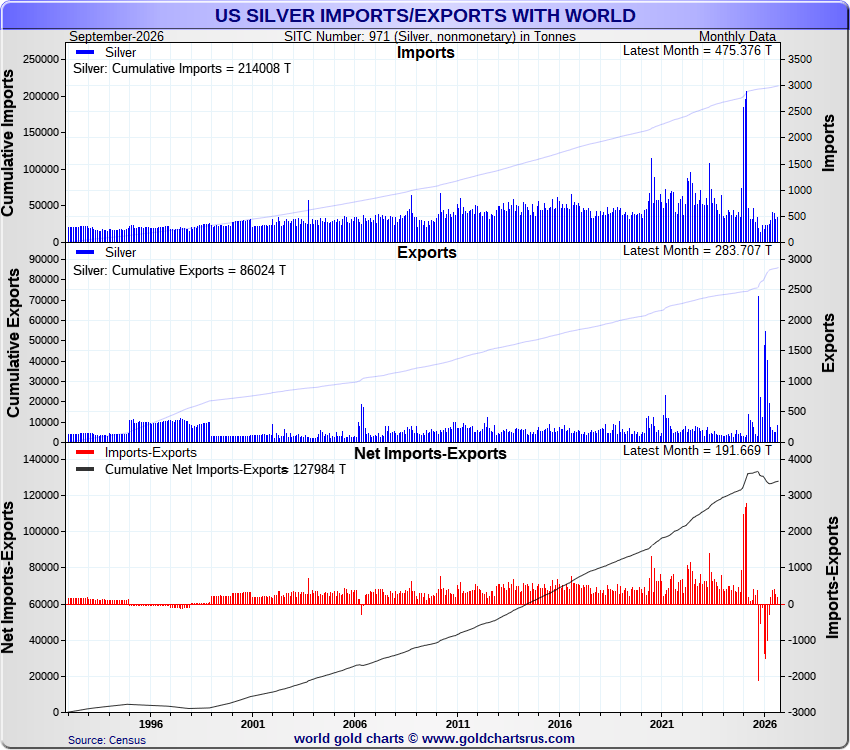
US Silver Imports/Exports
Annual & monthly charts in USD & Tonnes - the price has been spiking the $ value.
Here you can see the massive imports in 2025 & the exports in 2026.
This was the 2025/2026 tariff trade from London to the US & now sent back home via Switzerland.
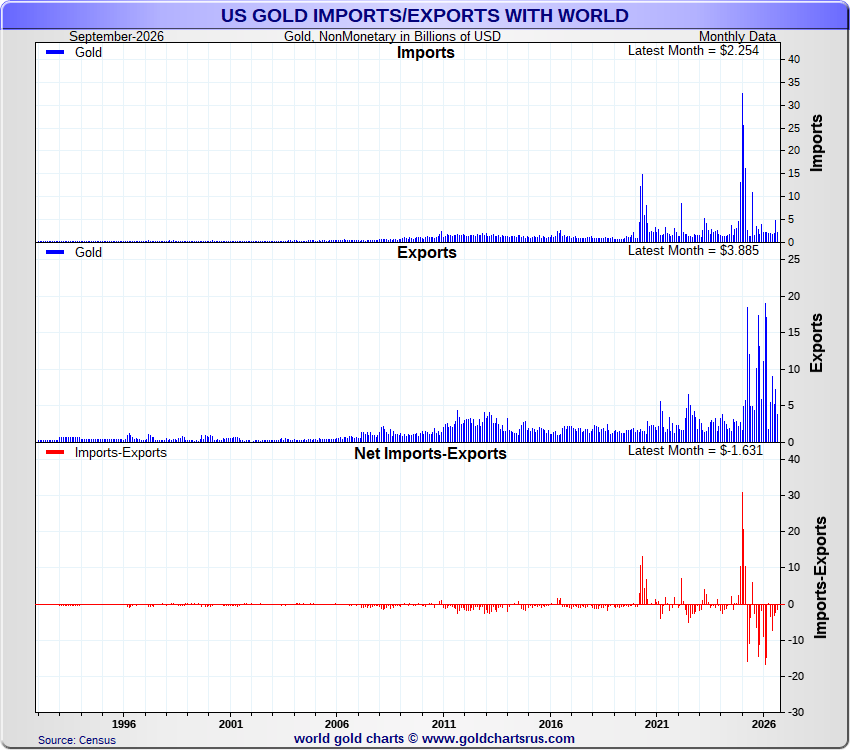
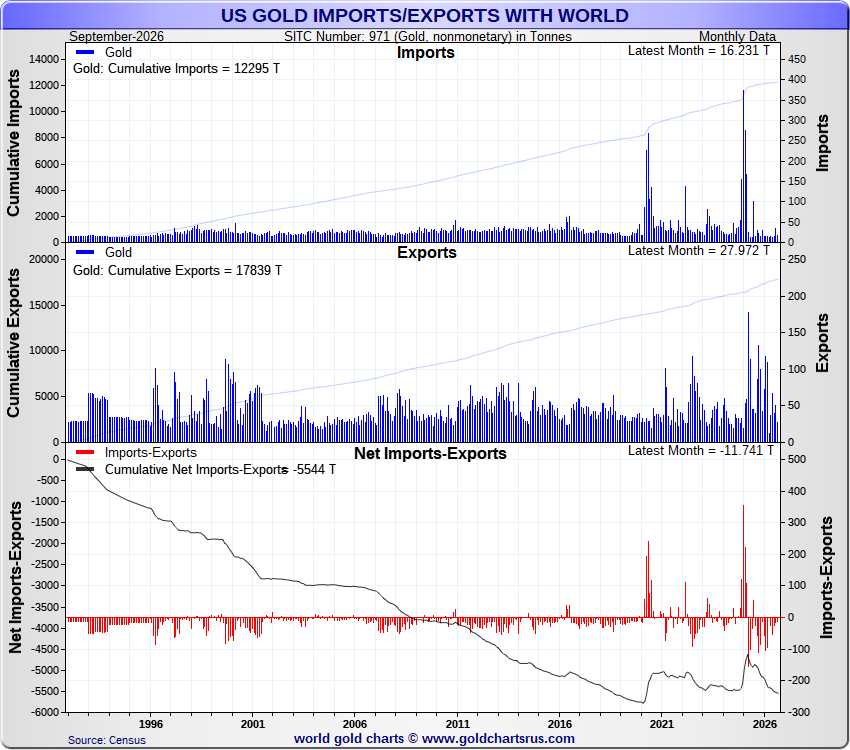
US Gold Imports/Exports
Annual & monthly charts in USD & Tonnes - the price has been spiking the $ value.
And the flood of exports appear to be tapering off.
🚨 BUYING GOLD WITH CASH? BRUSSELS IS DRAWING A LINE.
From 10 July 2027, gold dealers across the EU will generally have to verify your identity if you pay €3,000 or more in cash. The regulation caps cash payments to businesses at €10,000, and countries can set lower limits.
If Brussels wants people to give up more financial privacy in the name of fighting money laundering, it should show why these limits are necessary. How did it decide that a €3,000 cash purchase should require an ID check?
Any fact requiring an explanation of why it isn't negative, isn't positive.
A Fed note explaining why most gold reserve relocations from the NY Fed aren't negative for the USD.
https://t.co/mj0hvkVwtB