@sama We start flying them next year. Maybe you can come see them if your parole officer approves.
After stealing an open source AI charity, you then stole all of Apple’s phone technology! Wow.
What do you plan for an encore? That’s tough to beat.
Latest GGI article:
$COST $CCJ $LMND $SHOP $BTG $ONON $BE // Strike Price Updates
Buy prices, growth rates, price targets, financial metrics, chart comments, etc in the article. See link below👇
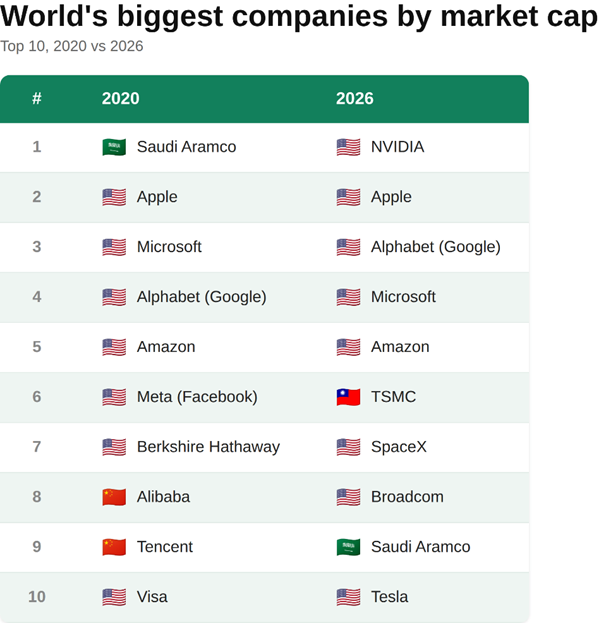
Also included, my prediction in alphabetical order, not market cap, for the 10 largest companies in the world in 2030:
Amazon
Anthropic
Apple
Eli Lilly
Google
Micron
Microsoft
Nvidia
SpaceX
Tesla
My latest article:
Buy prices, growth rates, price targets, financial metrics, chart comments, etc in the article. See link below👇
Chart Trends:
$META
trending down, but signs of trend reversal
$XPEV
long bottoming channel, now below 200D MA
$ATZ.TO
solid uptrend, likely needs consolidation time
$CRWD
consolidation time, await bull flag formation
https://t.co/K9Xy4t3JHT
$HIMS // Strike Price Update Article
successfully transitioned from a macro downtrend into a daily uptrend -- look for a brief period of consolidation to cool down the overbought indicators, using the $31.50–$32.50 zone to build long exposure -- definitive breakout past $36 triggers a macro momentum continuation play
Financial Metrics:
Rule of 40 = 62.5%
Operating Income Margin = 0.6%
Free Cash Flow Margin = 7.4%
Return on Invested Capital = -0.8%
Cash to Operating Expense Ratio = 43.8%
Debt to Total Assets Ratio = 49.9%
Buy prices, growth rates, price targets, chart comments, etc in this article👇
https://t.co/ft423hqzWj
$INFQ // Infleqtion
pure-play quantum tech co. -- stands out by taking a "full-stack" approach -- rather than focusing on computing, $INFQ commercializes two main pillars: Quantum Computing and Quantum Sensing -- biz model relies on a scalable, foundational architecture: neutral-atom technology
Financial Metrics:
Rule of 40 = -159.8%
Operating Income Margin = -184.2%
Free Cash Flow Margin = -80.7%
Return on Invested Capital = -9.5%
Cash to Operating Expense Ratio = 613.4%
Debt to Total Assets Ratio = 0.8%
$CBRS // Cerebras Systems
semiconductor and AI infrastructure company challenging Nvidia’s dominance -- keep the entire wafer intact as a single, massive processor -- runs agentic AI (inference) at record speeds
Financial Metrics:
Rule of 40 = 53.8%
Operating Income Margin = -28.6%
Free Cash Flow Margin = -122.1%
Return on Invested Capital = 14.7%
Cash to Operating Expense Ratio = 321.3%
Debt to Total Assets Ratio = 11.3%
Buy prices, growth rates, price targets and chart comments in this article👇
https://t.co/sQbmHxlsKf
After a 55% pop on this health care equipment company, thanks to their supplying of “ultrasound on chips” partnership with Midjourney and their new AI enhanced “spa,” is $BFLY a buy at this price despite their -52.5% OpInc margin?
Yes, given the new GGI strike price, but a better entry might be after a bull flag forms and a support test.
Financial Metrics:
Rule of 40 = -30.1%
Operating Income Margin = -52.5%
Free Cash Flow Margin = 8.7%
Return on Invested Capital = -35.9%
Cash to Operating Expense Ratio = 113.1%
Debt to Total Assets Ratio = 6.9%
See our buy prices, growth rates and price targets here👇
https://t.co/ExrmMdV4Da
🟩 $TLN // Talen Energy
Sector: Utilities > Independent Power Producers and Energy Traders
Current Price = US$406.51
% Above 52 Week Low = 59.1%
Market Cap = $19.4 billion
Dividend = 0.00%
Average Seeking Alpha Rating = 4.35 (out of 5)
GGI Rating = 🔥
GGI Biz Quality Score = 107.7%
Average = 55.2%
GGI Risk Reward Ratio (longer term potential) = 113.4%
Average = 142.6%
GGI Energy Level (shorter term potential) = 210.9%
Average = 145.0%
Financial Metrics:
Rule of 40 = 46.9%
Operating Income Margin = 8.1%
Free Cash Flow Margin = 42.9%
Return on Invested Capital = -0.3%
Cash to Operating Expense Ratio = 34.5%
Debt to Total Assets Ratio = 62.0%
Business Description:
independent power producer and infrastructure co., transformed its biz model from a volatile commodity utility into a high-margin engine powering AI and digital infrastructure revolution
Capacity & Expansion Plans:
16 GW power generation fleet -- 2.2 GW nuclear -- acquiring nat gas plants and 2-3,000 acres of adjacent land -- 3-4,000 MW data center capacity per -- 1,920 MW AWS deal until 2042
Why & Why Not to Buy Now:
chart has formed a "Bull Flag" breakout off an institutional accumulation zone -- correction down to mid-$330s has shaken out weak hands and retested long-term MA support -- points toward a retest of the $451 ATH
Notes, Anecdotes & Insights:
high-vol surge back above $400 indicates institutions were loading up ahead of Cornerstone closing ($3.5B acquisition) -- if you believe AI data center energy crunch is a structural trend, temporary spike in debt is a risk worth taking
See our buy prices, growth rates and price targets here👇
https://t.co/HP4VRTIKAa
🟦 $VRT // Vertiv Holdings
Also available in CA$: VRT
Sector: Industrials > Electrical Components and Equipment
Current Price = US$311.93
% Above 52 Week Low = 183.4%
Market Cap = $119.8 billion
Dividend = 0.08%
Average Seeking Alpha Rating = 4.01 (out of 5)
GGI Rating = 👍
GGI Biz Quality Score = 66.9%
Average = 53.5%
GGI Risk Reward Ratio (longer term potential) = 130.9%
Average = 141.5%
GGI Energy Level (shorter term potential) = 105.5%
Average = 140.6%
Financial Metrics:
Rule of 40 = 49.7%
Average = 68.8%
Operating Income Margin = 18.8%
Free Cash Flow Margin = 18.1%
Return on Invested Capital = 20.8%
Cash to Operating Expense Ratio = 125.7%
Debt to Total Assets Ratio = 24.4%
Business Description:
infrastructure for physical foundation of data centres -- $NVDA makes the AI "brain" $VRT builds the "body" -- power grids, cooling networks to prevent brains from melting or losing power
Capacity & Expansion Plans:
$15B order backlog, aggressively scaling capacity, driving 34% projected revenue increase -- 2 new plants in USA to 7x modular infrastructure capacity, doubling production in Mexico.
Why & Why Not to Buy Now:
recent 18% drop shook out speculative froth -- rebounded off support at $275 provides good entry point -- high PE but $VRT has near-monopoly on high-density liquid cooling and modular AI grids -- use pullbacks to build a position
Notes, Anecdotes & Insights:
$VRT acquired ThermoKey, a premier provider of heat rejection and heat-exchange tech -- expands thermal manufacturing capacity, gives end-to-end control of physical liquid cooling supply chain across European data center projects.
See our buy prices, growth rates and price targets here👇
https://t.co/6da9WQu1u4
New article. Strike Price Updates include these names:
$BABA // Alibaba Group
$RDDT // Reddit
$GROY // Gold Royalty Corp.
$PNG // Kraken Robotics
$BE // Bloom Energy
$BB // BlackBerry
$TE // T1 Energy
Here's the BlackBerry part of the article, the rest are here:
https://t.co/ztqRwyBuHg
$BB // BlackBerry
Also available in CA$: BB
Analysis Date: May 25, 2026
Sector: Technology > Systems Software
Business Description:
pivoted from mobile hardware to enterprise software and services provider in mission-critical cybersecurity and embedded systems
Why Buy:
OS for ADAS, digital cockpits, and software-defined vehicles, inc. major OEMs -- deployed in 275M+ vehicles, but up against TSLA + Chinese EVs -- NVDA robotics partnership Apr 2026
Current Price = US$8.67
% Above 52 Week Low = 177.9%
Market Cap = $5.1 billion
Dividend = 0.00%
Average Seeking Alpha Rating = 3.95 (out of 5)
GGI Biz + Chart Quality Score = 105.8%
Sector Average = 104.8%
GGI Risk Reward Ratio (longer term potential) = 17.1%
Sector Average = 87.5%
GGI Energy Level (shorter term potential) = 100.6%
Sector Average = 78.8%
Strike Prices:
Primary Strike Price = US$5.50
Max Fear = $4.13 (-25%)
Dollar Cost Average = $6.88 (+25%)
iBuy Price = $6.16
Growth Rates:
1 Year Estimate = 24.4%
5 Year CAGR Estimate = 17.0%
Past 5 Year CAGR of the Stock Price = -3.3%
Financial Metrics:
Rule of 40 = 17.9%
Operating Income Margin = 12.0%
Free Cash Flow Margin = 8.0%
Return on Invested Capital = 5.5%
Cash to Operating Expense Ratio = 102.2%
Debt to Total Assets Ratio = 18.1%
Chart & Comments:
Let the MACD and RSI cool off if you want to be part of this come back kid story. But there is definitely some mean reversion potential here.
I think $BB has much to prove and execution risk before they get me interested, but the partnership announced with Nvidia in April does make them one to watch going forward. But I would want to be able to give them a higher that 17% 5 year CAGR estimate before investing.
GGI Portfolio and Strike Price Updates
The GGI Portfolio has now been divided into two tabs in the GGI Strike Price List spreadsheet: Invest and Trade.
Invest for longer term positions, managed by the GGI Portfolio Manager. Trade for shorter term positions, based on stocks I crunch the numbers on and find they have a high Risk Reward Ratio and Energy Level and the chart looks opportunistic.
The Invest tab also now has two watchlists below the portfolio section: Max Your CAGR Faves and Max Your CAGR Contenders.
Like the Invest Portfolio, the Max Your CAGR watchlist is divided into these sections:
Primo Companies
Cryptos
Energy
Finance
Health
Media
Resources & Commodities
Retail
Robotics
Tech Infrastructure
Tech
Defence
Dividends, Hedges, Shorts
Hot Themes
Indexes
Precious Metals
I'm trying to make the GGI Strike Price List spreadsheet as user-friendly for myself and y'all as possible! :)
My number crunching on a stock comes up with many financial metrics but I try to boil it down to a few key numbers to look at:
Margin of Safety Strike Price
Max Fear Strike Price
Risk Reward Ratio (longer term focused metric)
Energy Level (shorter term focused metric)
Biz Quality
Dividend Yield
Now onto the Strike Price Updates, which include these names:
$PLTR // Palantir Technologies
$APP // AppLovin
$FSLY // Fastly
$TD // Toronto-Dominion Bank
$RY // Royal Bank of Canada
$CM // Canadian Imperial Bank of Commerce
$BNS // Bank of Nova Scotia
$BMO // Bank of Montreal
$LLY // Eli Lilly
$ISRG // Intuitive Surgical
$CPRX // Catalyst Pharmaceuticals
$GNRC // Generac Holdings
$MU // Micron Technology
And Transactions in the Invest and Trade Portfolios ...
Article link👇
https://t.co/2YrtkmWrqi
$NOK // Nokia: Strike Price Update
Financial Metrics:
Operating Income Margin = 8.4%
OpInc 2 Years Ago = 12.0%
Free Cash Flow Margin = 8.0%
FCF 2 Years Ago = 14.3%
Return on Invested Capital = 3.2%
ROIC 2 Years Ago = 5.0%
Cash to Operating Expense Ratio = 79.0%
Debt to Total Assets Ratio = 8.9%
In Oct 2025 Nvidia invested about $1 billion in Nokia in anticipation of edge device compute becoming more important for the AI stack. Nokia likely won't see revenue growth from this investment until 2027 when 6G wireless communications and other telecommunications develop from their R&D.
$NOK is now too overbought IMO, given their current EPS and expected growth rates. But I think it is one to watch when the stock prices comes back to test the 50 day moving average which is now at $8.62.
I expect the analyst growth rates to increase from the fairly low levels they are currently at which would then enable me to increase my strike prices which would then increase my Risk Reward Ratio and Energy Level. I prefer to initiate an investment when those levels are high and the stock price is well below my Primary Strike Price.
I also need to do more qualitative research on $NOK. This is my first number crunching on it, but I wanted to get a baseline of their numbers into my spreadsheet so I can monitor the pace of change in a quarter or two.
https://t.co/vxecwTM5eJ
$MU and Other Strike Price Updates
I am currently debating with the GGI Portfolio Manager if $MU is the next Nvidia.
I am leaning towards yes as it seems that high bandwidth memory (HBM) is not nearly as cyclical as normal computing memory has proven to be in the previous few decades. Every GPU that is installed in an AI data centre wants more HBM than the previous GPU. Inference is exploding. Inference requires HBM.
The GGI PM is ever the skeptic, but that is important. If he decides something is a great longer term investment, the chances of success go up.
If $MU is no longer such a cyclical business then the multiples can increase significantly.
The FWD PE ratio of $MU is 5.4 but for $NVDA it is 25.2, $AAPL is 31.5, $MSFT is 24.2, $AMD is 52.1.
If $MU had a FWD PE ratio similar to these peers it would ~5x the stock price.
I significantly throttled the calculations to come up with my strike prices for $MU.
I also have a Book Value strike price that I only use internally at this point. The BVSP of $NVDA is $248 which is inline with my strike prices and the current stock price. My BVSP for $MU is $2410 or about 5x higher than the current price.
The GGI PM and I shall continue to debate $MU this week. Hopefully I win and it gets added to the GGI Portfolio this week, but we shall see. In the meantime bear in mind the strike prices.
Article link👇
https://t.co/UMUyf4H2VU
Article also includes my strike prices, growth rates, financial metrics etc for these stocks:
$TSLA
$PG
$DRAM
$ONTO
$ON
$RNW
$SYM
$TTWO
$EA
$SNDK
$MU
$ASML
$TSM
$NBIS
$POET
$APLD
$UBER