Lascaux vintage crayon scrawls from a recalcitrant chart-crime recidivist publicly chronicling the incessant bickering between irrational inner voices.
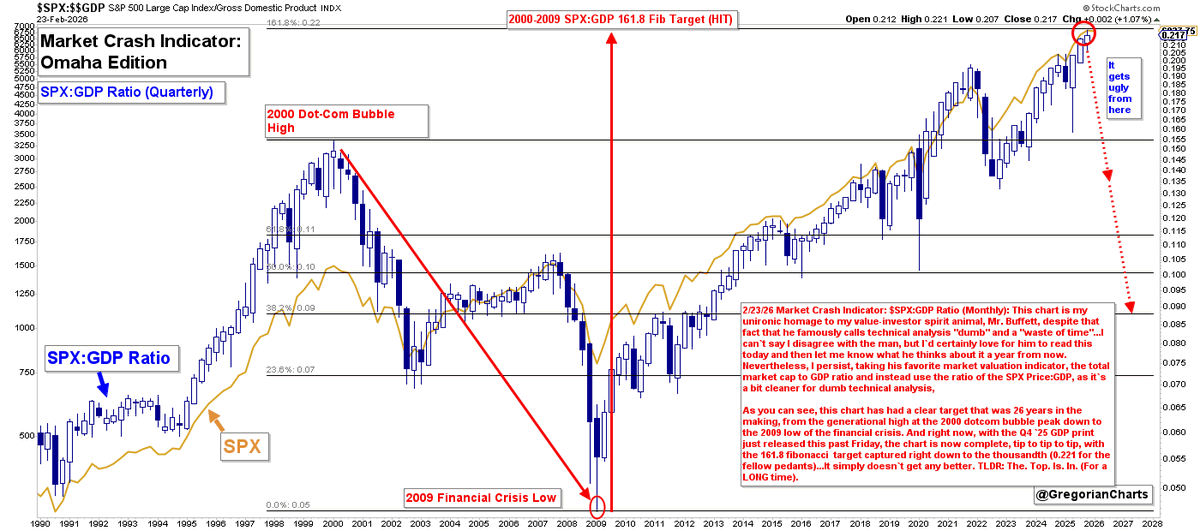
Market Crash Indicator: $SPX:GDP Ratio (Monthly): This chart is my unironic homage to my value-investor spirit animal, Mr. Buffett, despite the fact that he famously calls technical analysis "dumb" and a "waste of time"...I can't say I disagree with the man, but nevertheless, I persist, taking his favorite market valuation indicator, the total market cap to GDP ratio and instead use the ratio of the SPX Price:GDP, as it's a bit cleaner with more defined targets for my dumb technical analysis.
So, as you can see, this chart has had a clear target that was 26 years in the making, from the generational high at the 2000 dotcom bubble peak down to the 2009 low of the financial crisis. And right now, with the Q4 `25 GDP print just released this past Friday, the chart is now complete, tip to tip to tip, with the 161.8 fibonacci target captured right down to the thousandth (0.221 for the fellow pedants)...It simply doesn't get any better. TLDR: The. Top. Is. In. (For a LONG time).
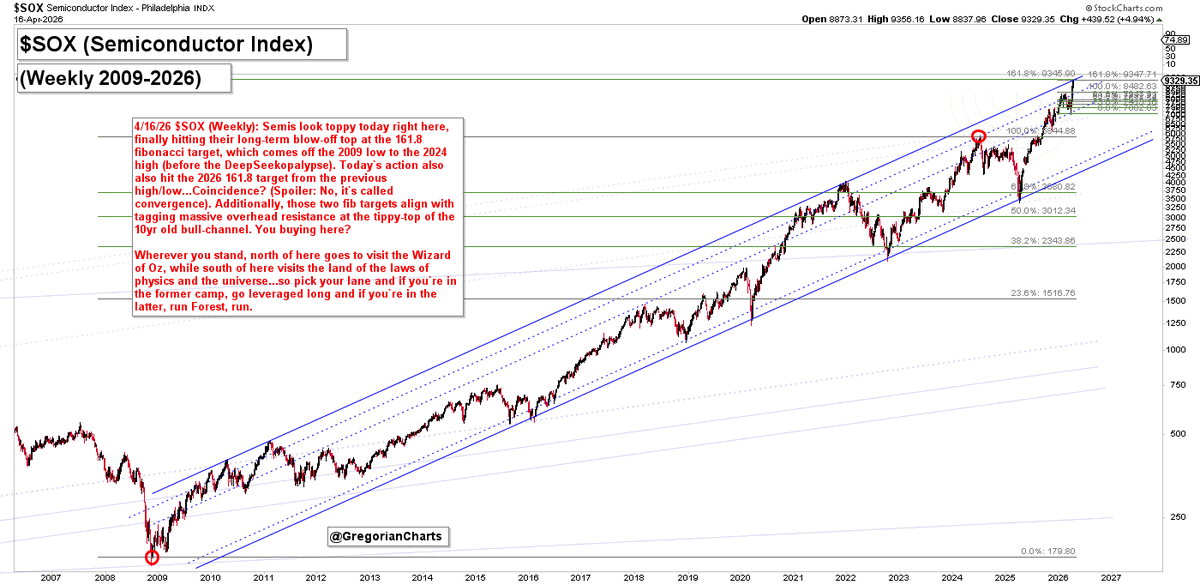
$SOX (Weekly): Semis look toppy right here, finally hitting their long-term blow-off top at the 161.8 fibonacci target, which comes off the 2009 low to the 2024 high (before the DeepSeekopalypse). Today's action also also hit the 2026 161.8 target from the previous high/low...Coincidence? (Spoiler: No, it's called convergence). Additionally, those two fib targets align with tagging massive overhead resistance at the tippy-top of the 10yr old bull-channel. You buying here?
Wherever you stand, north of here goes to visit the Wizard of Oz, while south of here visits the land of the laws of physics and the universe...so pick your lane and if you're in the former camp, go leveraged long and if you're in the latter, run Forest, run.
$BTC (Weekly): Today`s action saw BTC hit up against the overhead descending channel resistance while simultaneously backtesting the 100% fib from the March 2025 low to the October 2025 ATH...not surprisingly, it reversed. There`s still strong support below at the rising support, so I`d be watching for a fight here over the next week or two while a wedge forms. Downside target is ~42-44k depending on the chart I look at while a breakout here could bring a retest of 100k and even an ATH. Gravity seems to be the path it`s on until proven otherwise.
$BTC (Weekly): Today`s action saw BTC hit up against the overhead descending channel resistance while simultaneously backtesting the 100% fib from the March 2025 low to the October 2025 ATH...not surprisingly, it reversed. There`s still strong support below at the rising support, so I`d be watching for a fight here over the next week or two while a wedge forms. Downside target is ~42-44k depending on the chart I look at while a breakout here could bring a retest of 100k and even an ATH. Gravity seems to be the path it`s on until proven otherwise.
$SOX (Weekly): Semis look toppy right here, finally hitting their long-term blow-off top at the 161.8 fibonacci target, which comes off the 2009 low to the 2024 high (before the DeepSeekopalypse). Today's action also also hit the 2026 161.8 target from the previous high/low...Coincidence? (Spoiler: No, it's called convergence). Additionally, those two fib targets align with tagging massive overhead resistance at the tippy-top of the 10yr old bull-channel. You buying here?
Wherever you stand, north of here goes to visit the Wizard of Oz, while south of here visits the land of the laws of physics and the universe...so pick your lane and if you're in the former camp, go leveraged long and if you're in the latter, run Forest, run.
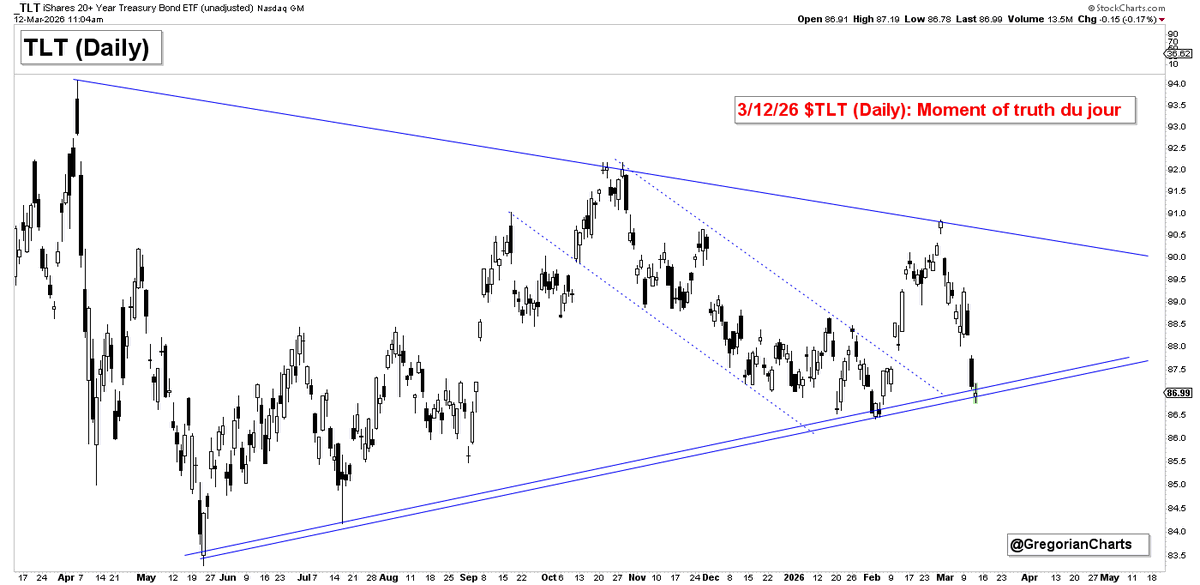
3/12/26 UST30y (Daily): At these moments of truth is precisely where we get the answer to the question as to whether we trade charts or news.
$TLT $TYX
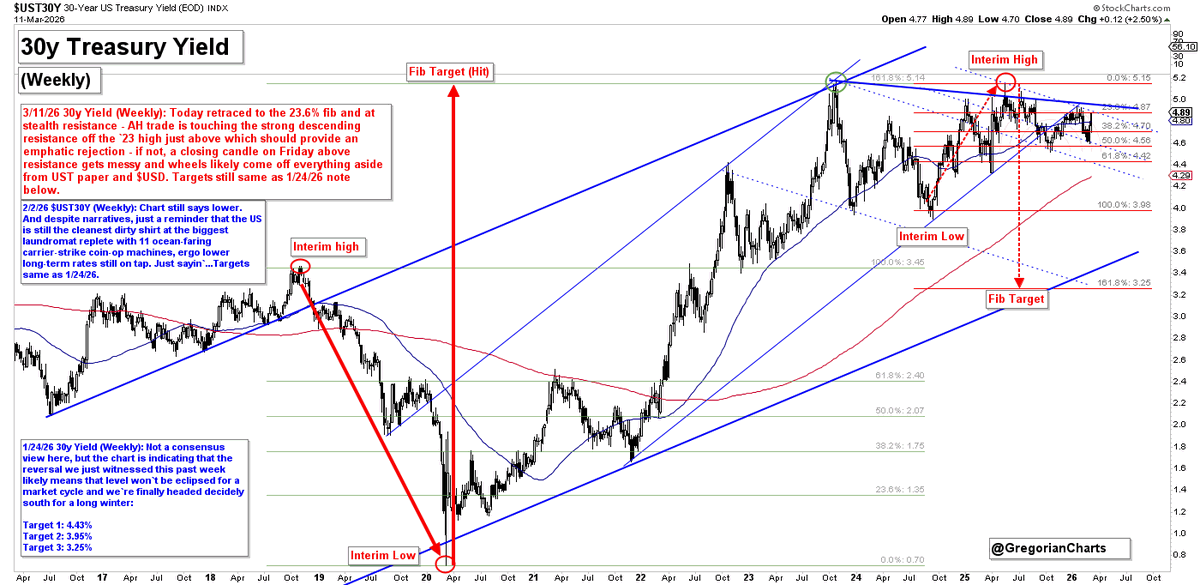
3/11/26 UST 30y Yield (Weekly): Today's action retraced to the 23.6% fib at stealth resistance (dashed line). It still has room to move up to keep the rates-go-lower thesis intact as long as the strong descending overhead resistance just above here which comes off the `23 high which should provide an emphatic rejection if it is indeed legitimate - if not, a closing candle on Friday above that resistance starts getting rather messy and wheels likely come off everything aside from the treasury short-end and $USD. Targets unchanged from the 1/24/26 note: Target 1: 4.43%, Target 2: 3.95%,
and Target 3: 3.25%
$TYX $TLT
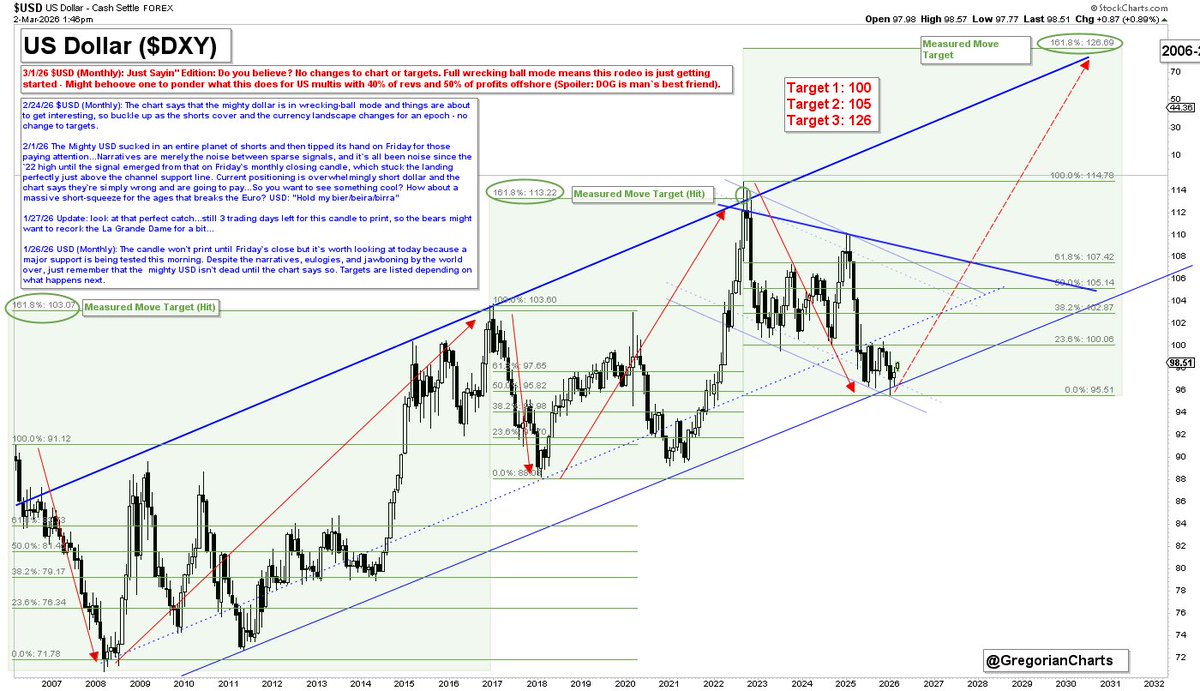
$USD (Monthly): Just Sayin" Edition: Do you believe? No changes to targets. Full wrecking ball mode means this rodeo is just getting started - Might behoove one to ponder what this does for US multis with 40% of revs and 50% of profits offshore (Spoiler: DOG is man's best friend).
$DXY $UUP