Using large language models (LLMs) during exploratory data analysis can be especially useful when they are integrated directly into the programming environment you already use. chattr is an R package that allows you to interact with LLMs directly from RStudio or Positron.
✔️ Generate R code from natural-language prompts
✔️ Ask questions and get explanations directly within your R workflow
✔️ Use AI to help explore, visualize, and analyze data
✔️ Connect to different LLM providers through a unified interface
The visual below comes from the official package documentation and shows how chattr integrates LLM interaction directly into the IDE. More details are available here: https://t.co/getcULdwuv
I have just released a new Statistics Globe Hub module on using chattr for AI assistance directly in RStudio.
More information about the Hub: https://t.co/NA2b7UAXJ4
#RStats #RProgramming #DataScience #GenerativeAI #LLM #ArtificialIntelligence #DataAnalysis #RStudio #chattr #Statistics #StatisticsGlobeHub
gander is an R package that brings AI directly into RStudio or Posit.
Instead of switching between your IDE and a chat window, gander lets you ask questions or request code changes right inside your script. It automatically shares relevant context such as variable names, data types, and the surrounding code, so the model can provide precise answers without extra copy-pasting.
You can trigger it with a simple keyboard shortcut, choose from different AI models (OpenAI, Claude, or local ones), and control how much of your data is sent for context. In short, gander makes working with AI in RStudio smoother, faster, and smarter.
Take a look at the visualization below. It shows an example of how to use gander to create a ggplot2 graph. It’s taken from the package website: https://t.co/DbsZTbsmVK
Join my newsletter for more tutorials and insights on R, Python, data science, and AI.
See this link for additional information: https://t.co/ktUcWo9XpO
#tidyverse #R #datastructure #RStats
PhD Students - How to humanize AI written text in seconds?
1. Go to https://t.co/h23UIA1wSV
2. Copy and paste your text or upload the file
3. HumanizeThis will humanize your text in seconds
4. After this, it will check it through 8 AI detectors
- TurnItIn
- GPTZero
- Originality AI
- CopyLeaks, and so on
5. These detectors confirm the text is humanized
6. You can also see the changes tracked
7. Accept the changes and copy the humanized text
The best part? It is FREE
Humanizethis Link: https://t.co/h23UIA1wSV
Pasting confidential data into ChatGPT is not a good idea!
Many programmers work with sensitive datasets, such as patient records, financial information, or customer databases. Uploading this information to an AI tool may violate privacy policies and legal requirements.
Does that mean you cannot use AI?
Not at all.
A simple but effective alternative is to share the structure of your data instead of the data itself.
For example, instead of uploading your dataset, you can provide:
🔹 Variable names
🔹 The output of str()
🔹 The output of summary()
🔹 Data types and missing value counts
🔹 A brief description of your analysis goal
In many cases, this is all ChatGPT and other AI tools need. This approach allows you to benefit from AI while keeping your raw data private.
I have just released a new module in the Statistics Globe Hub in which I demonstrate practical workflows for using ChatGPT in R programming, including strategies for working with confidential datasets without exposing sensitive information.
The Statistics Globe Hub provides practical, project-based training in statistics, data science, AI, and programming with R and Python.
More information about the Hub: https://t.co/NA2b7UAXJ4
#ChatGPT #ArtificialIntelligence #DataScience #Programming #DataPrivacy #RStats #StatisticsGlobeHub
Ever wished your heatmaps were not just static images but fully interactive?
The heatmaply package brings heatmaps to life in R. It lets you zoom, pan, hover for details, and explore hierarchical clustering interactively in your browser. This makes it much easier to work with high-dimensional data, spot clusters, and share results with collaborators.
Here’s what you can achieve using heatmaply:
🔹 Build interactive cluster heatmaps with just one function call
🔹 Zoom into rows and columns for detailed inspection
🔹 Hover over cells to see exact values and labels
🔹 Export to standalone HTML for easy sharing
🔹 Handle large datasets more effectively than static plots
The visualization below (from the package website) shows how heatmaply turns a standard clustered heatmap into an interactive tool for exploration and communication. Learn more: https://t.co/cS3zieKIqE
For more practical insights on R, Python, statistics, and data science, check out my newsletter.
Click this link for detailed information: https://t.co/ktUcWo9XpO
#DataScientist #datastructure #RStats #R #Rpackage #statisticians #database
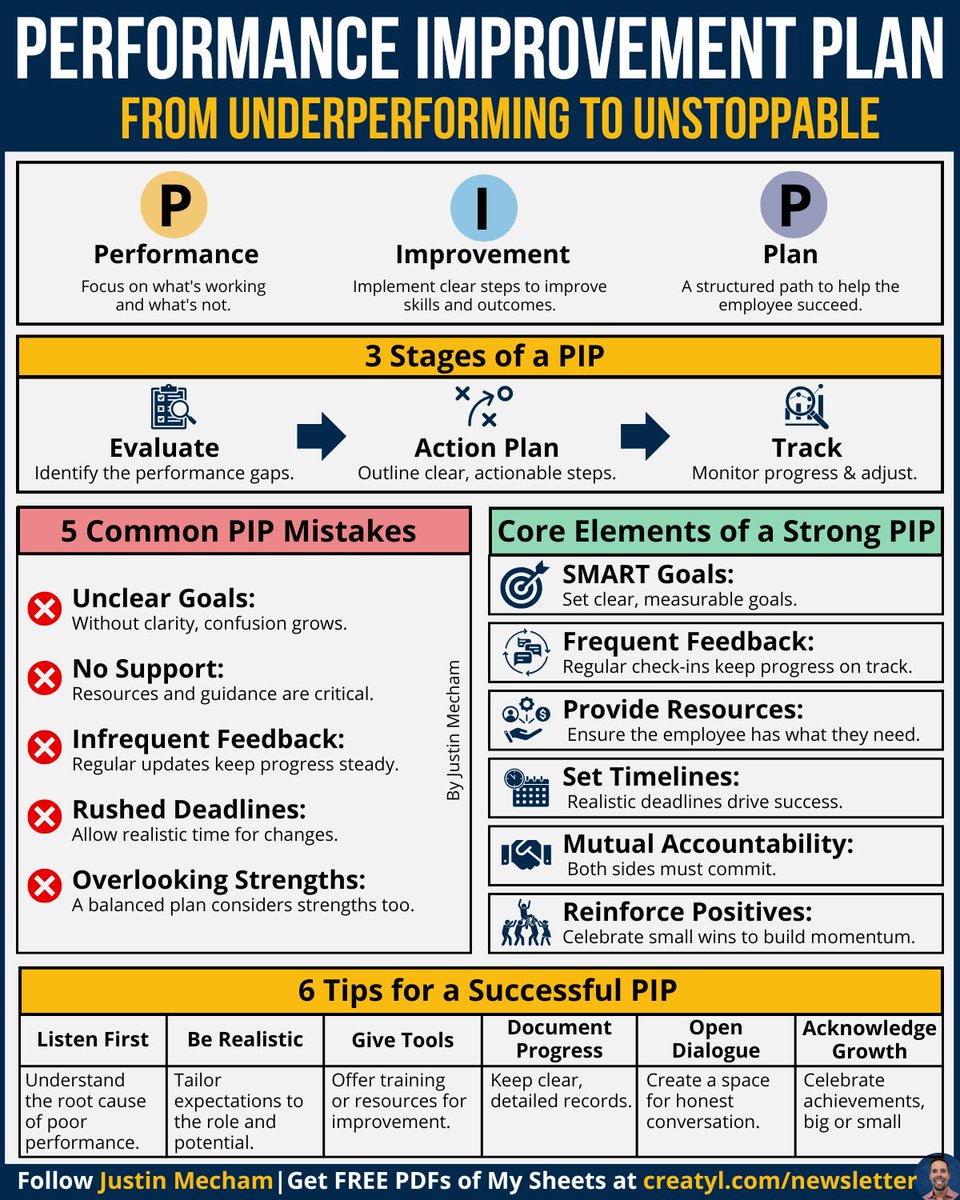
Your people won’t improve –
As long as your plan is broken:
A Performance Improvement Plan (PIP)
shouldn’t feel like a punishment.
It should feel like a path forward.
But here’s what usually goes wrong:
❌ Vague goals
❌ Rushed deadlines
❌ Ignoring strengths
❌ Infrequent feedback
❌ No support or resources
Use my guide to do it right.
📌 Want a PDF of my top infographics? 👇
⏩ Go Here: https://t.co/QLV2I0XGXV
Please repost to help others out there! ♻️
Micromanagement only tells
Your team one thing:
"I don't trust you."
Micromanagement doesn’t
just slow work down—
It hurts trust and confidence.
79% of workers say they have
been micromanaged before.
[Trinity Solutions]
Micromanagement causes:
❌ More stress
❌ Slower work
❌ Missed deadlines
❌ Lower confidence
❌ Less creative ideas
❌ More people quitting
❌ Weaker relationships
But you can take steps to make it better.
Try this:
✅ Set clear work boundaries
✅ Give updates before they ask for them
✅ Stay calm and speak up when needed
✅ Ask what’s expected of you from the start
✅ Focus on doing strong work they can trust
Being micromanaged feels frustrating -
But showing you are responsible and clear
helps your manager feel safe stepping back.
Micromanagement is rarely about you.
It’s usually about fear and control.
Clarity is what quiets both.
Please repost to help others out there! ♻️
👇 Want a PDF of my top infographics? 👇
Go Here: https://t.co/VwjXadHCap
Great communication isn't talking more—
It's doing this:
Most workplace problems
don’t come from lack of skill—
They come from unclear communication.
And the impact is real.
When communication breaks down, you get:
🔴 Lost trust
🔴 High turnover
🔴 Missed deadlines
🔴 Increased conflict
🔴 Lower productivity
🔴 Repeated mistakes
🔴 Unclear expectations
🔴 Misinterpreted messages
The best communicators follow the 7 Cs:
(h/t Scott M. Cutlip and Allen H. Center)
✔️ Clear
– Get to the point.
✔️ Concise
– Say more with less.
✔️ Concrete
– Provide specific details.
✔️ Correct
– Ensure accuracy.
✔️ Coherent
– Make it logical.
✔️ Complete
– Cover all necessary information.
✔️ Courteous
– Show respect and consideration.
Every conversation is a chance to connect or confuse.
Make your message clear.
Say what needs to be said—without the extra noise.
Give people the right information at the right time.
Listen as much as you speak.
Communication isn’t about saying more—
It’s about being understood.
Please repost to help others out there! ♻️
👇 Want a PDF of my top infographics? 👇
Go Here: https://t.co/VwjXadI9ZX
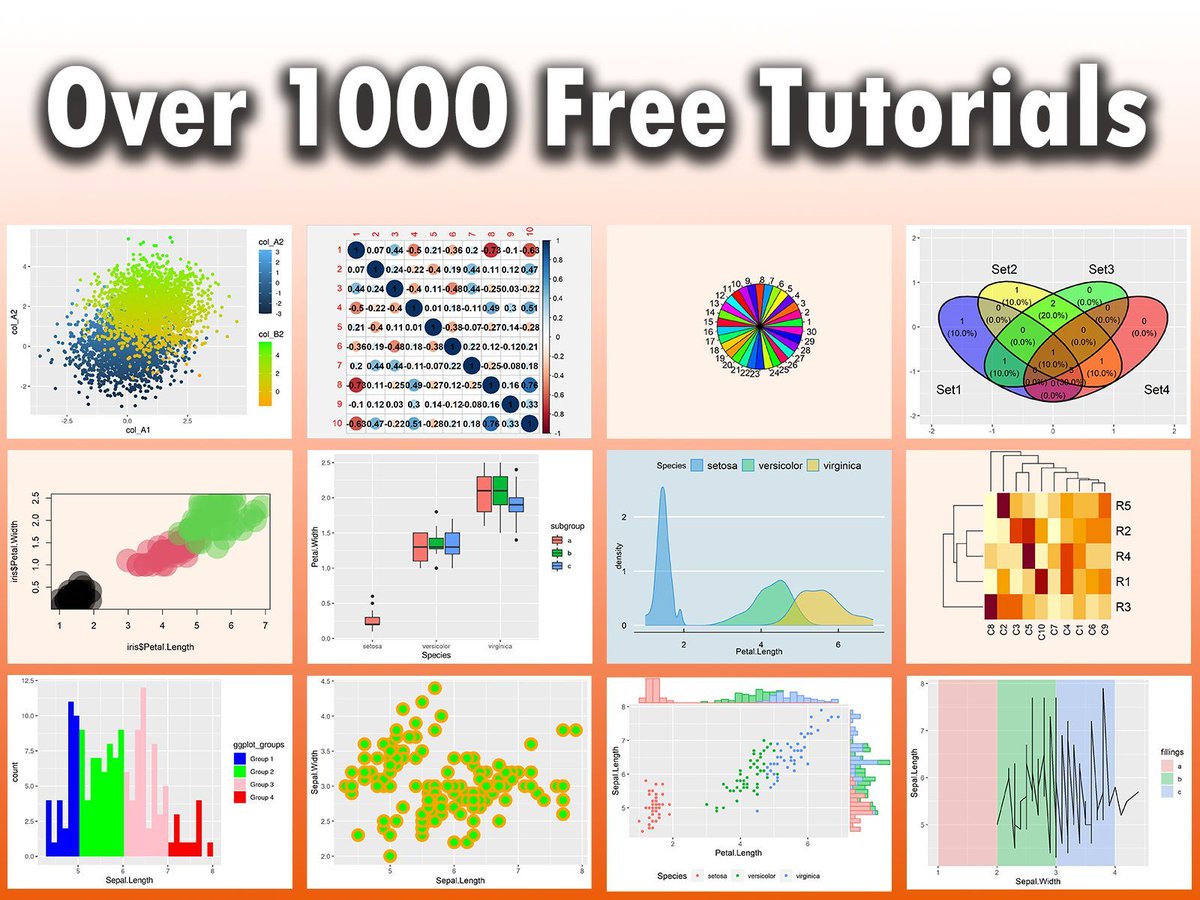
I've created a website called Data Hacks, which contains over 1,000 quick R and Python tutorials. Solutions are shown without unnecessary talk, allowing you to quickly find code snippets for specific problems.
The graph in this post displays some of the plots created on Data Hacks.
Link to Data Hacks: https://t.co/4hGGRXcJWv
Are you looking for a structured way to get started with the R programming language? I've developed an introductory course to R programming for absolute beginners.
Check out this link for more details: https://t.co/lUOKp2kv2r
#DataViz #datavis #coding
Misuse of p-values is a prevalent issue in scientific research. P-values are often misunderstood and misapplied, leading to incorrect conclusions. A p-value measures the probability of obtaining results at least as extreme as the observed ones, assuming that the null hypothesis is true. Common problems with p-values include:
✅ Overemphasis on significance: Researchers often focus on whether p-values are below a threshold (e.g., 0.05), ignoring the effect size and practical significance.
✅ P-hacking: Manipulating data or experimental conditions to achieve statistically significant p-values.
✅ Misinterpretation: Believing that a low p-value proves the alternative hypothesis or that a high p-value confirms the null hypothesis.
✅ Ignoring context: Failing to consider the broader context of the study, including prior evidence and the research design.
The graph shown in this post is a modified version of this Wikipedia image: https://t.co/C6zzlHi7KS
Want to deepen your understanding of statistics with R? Sign up for my online course, "Statistical Methods in R."
Learn more: https://t.co/X93SeCe0rb
#datasciencetraining #programming #DataVisualization #Data #DataAnalytics
DNA is just the beginning. In middle school, we learn that genotype and the environment collaborate to create phenotype. We are incorporating Evo 2's understanding of genetic variation into @arcinstitute virtual cell models that can be used for drug discovery and target ID
Multivariable logistic regression just got easier with #R! This approach cuts down on coding while delivering powerful insights. Check out the video for a clear, efficient solution.
Thank you, @yuzaR___, for sharing this valuable resource!
#DataScience#RStats#MachineLearning #Statistics
The best employees don’t magically succeed—
They’re set up for success from day 1:
Most new hires don’t fail
because they can’t do the job.
They fail because they
don’t know what’s expected.
When this happens:
Progress stops.
Confusion grows.
Confidence drops.
Use the G.R.O.W.T.H. framework for success.
Here’s how:
✅ Goals
Set clear, simple objectives.
✅ Resources
Give them the tools and training they need.
✅ Opportunities
Let them try tasks that build skills and confidence.
✅ Wins
Celebrate small successes early and often.
✅ Timelines
Create a clear plan with deadlines.
✅ Handoffs
Give responsibilities one step at a time.
The best teams start strong.
People perform best when they know what’s expected.
Alignment on day one leads to success every day.
Please repost to help others out there! ♻️
👇 Want a PDF of my top infographics? 👇
Go Here: https://t.co/VwjXadHCap
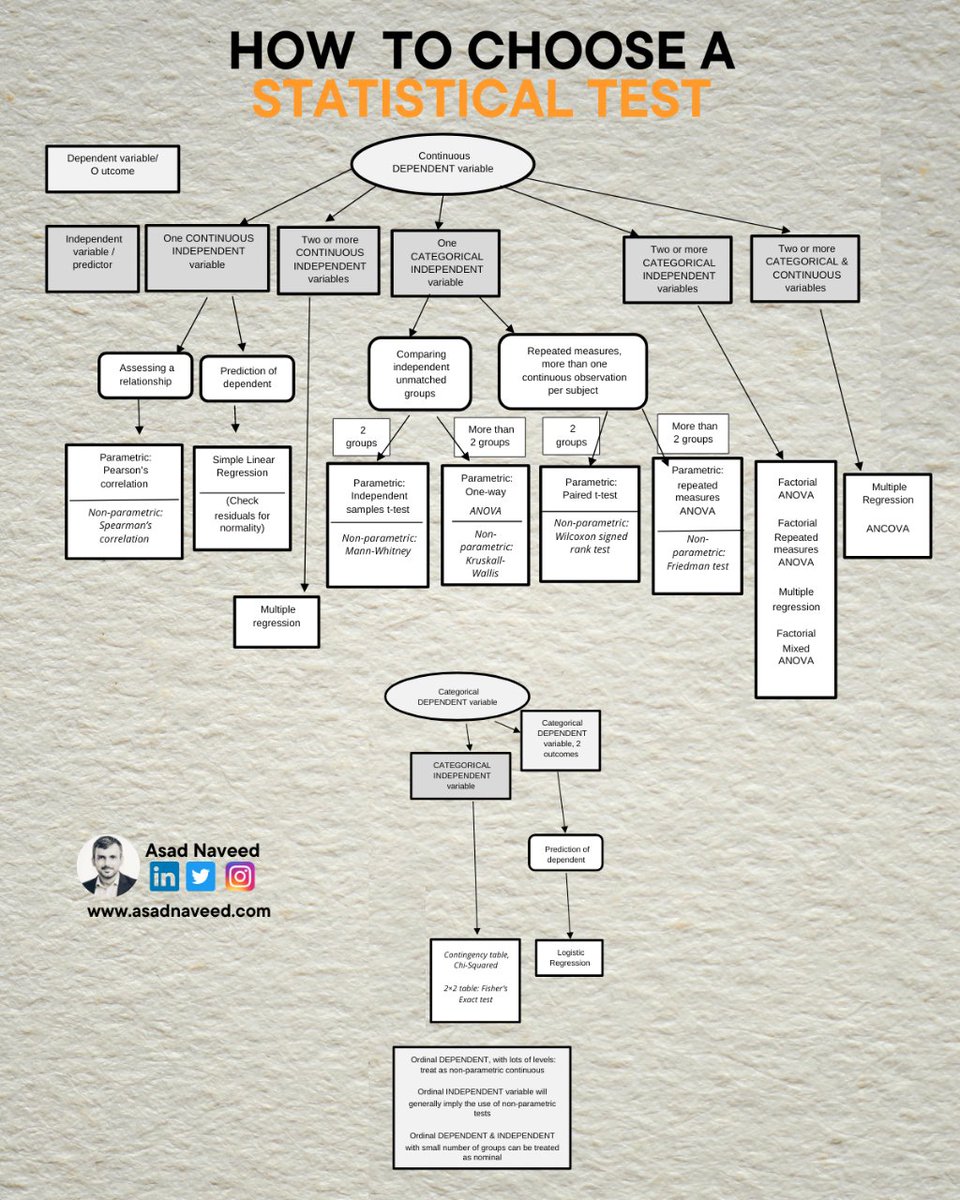
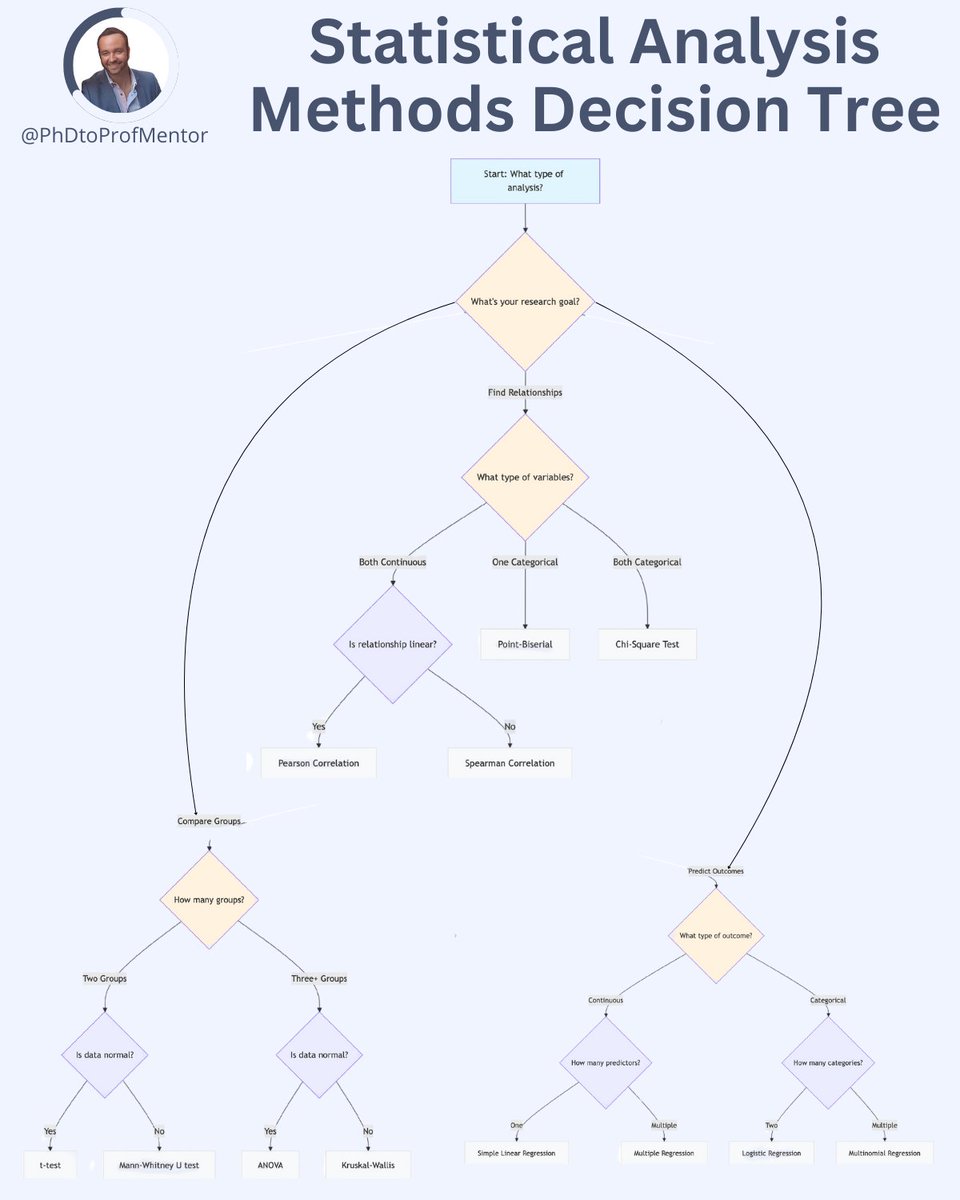
Choosing the right statistical test can be tricky.
Some tests seem ideal but don’t fit all data types.
You don't have to worry anymore.
just use this chart to guide you: 🔽


![thejustinmecham's tweet photo. Micromanagement only tells
Your team one thing:
"I don't trust you."
Micromanagement doesn’t
just slow work down—
It hurts trust and confidence.
79% of workers say they have
been micromanaged before.
[Trinity Solutions]
Micromanagement causes:
❌ More stress
❌ Slower work
❌ Missed deadlines
❌ Lower confidence
❌ Less creative ideas
❌ More people quitting
❌ Weaker relationships
But you can take steps to make it better.
Try this:
✅ Set clear work boundaries
✅ Give updates before they ask for them
✅ Stay calm and speak up when needed
✅ Ask what’s expected of you from the start
✅ Focus on doing strong work they can trust
Being micromanaged feels frustrating -
But showing you are responsible and clear
helps your manager feel safe stepping back.
Micromanagement is rarely about you.
It’s usually about fear and control.
Clarity is what quiets both.
Please repost to help others out there! ♻️
👇 Want a PDF of my top infographics? 👇
Go Here: https://t.co/VwjXadHCap](https://pbs.twimg.com/media/Gry03WJWwAAQYc9.jpg)