This morning's Navigator. Boom:
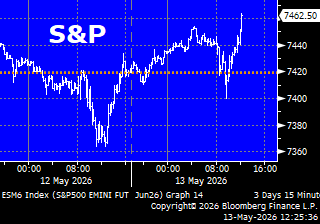
"Lastly, did you notice the price action in the stock market yesterday? Down 40 handles on the inflation print. Back up 40 handles in a perfectly symmetrical “V” bottom, and then worked its way another 30 handles higher by the close. That’s bull market price action for those of you keeping score at home. Today we saw a 30-handle dip post-PPI, from 7,455 to 7,425. If you’re thinking we'll repeat yesterday’s price action because this breakout is well intact and there are buyers lined up at the door – trust your instincts. That’s what I’m thinking. If the market proves me right – and the S&P finds buyers on the dip and a decent close – I’ll sleep like a baby with all this commodity risk tonight. If she turns and tumbles, I will know something is off, and we’ll adjust risk on the fly like we always do. It’s always worth giving up a few percentage points of P&L to right the ship. In fact, it’s a pleasure when trading from a position of strength, which we are. So, as headline inflation data for April is released, we’ve got inflation rising, oil prices rising, commodities like base metals and grains rising, yields rising, and stocks rising. Wow, man. 2026 just keeps bringin’ it." $SPY
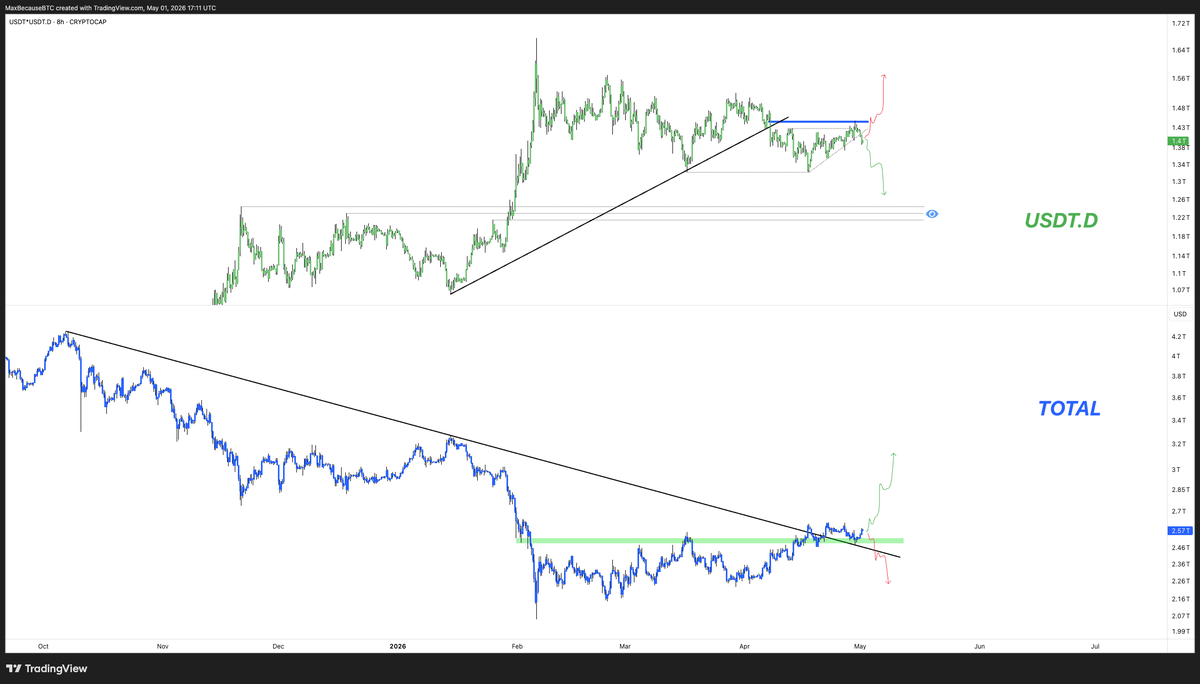
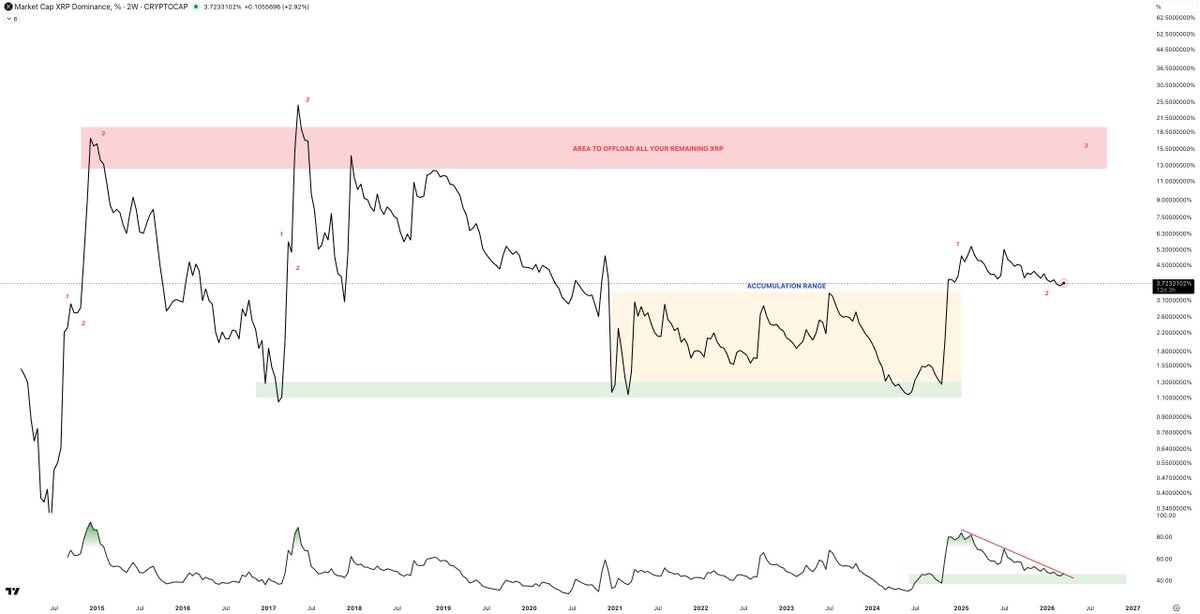
The moment is NOW. There should be ZERO hesitation from bulls right here if we're going to see crypto push higher...
I love this set up because the invalidation is so easy to see. $USDT.D is attempting to breakdown from a shoulder & $TOTAL is trying to break up out of a 6 month compression.
Level to watch...
$TOTAL needs to stay above 2.5T
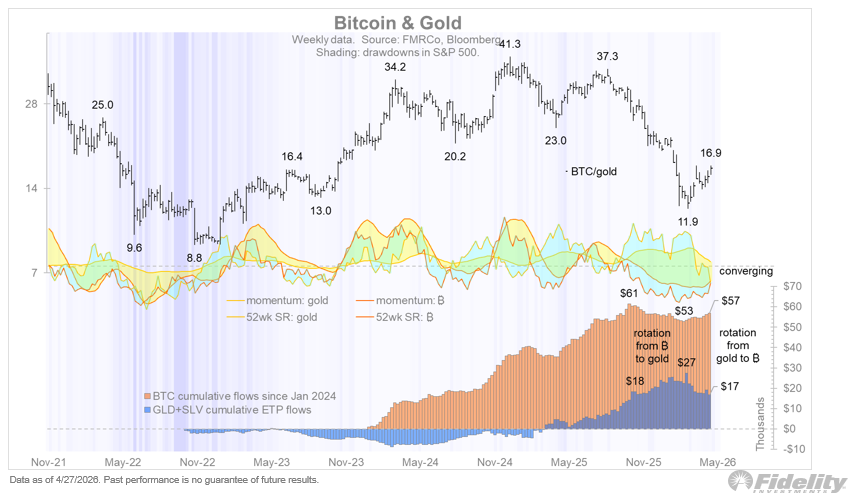
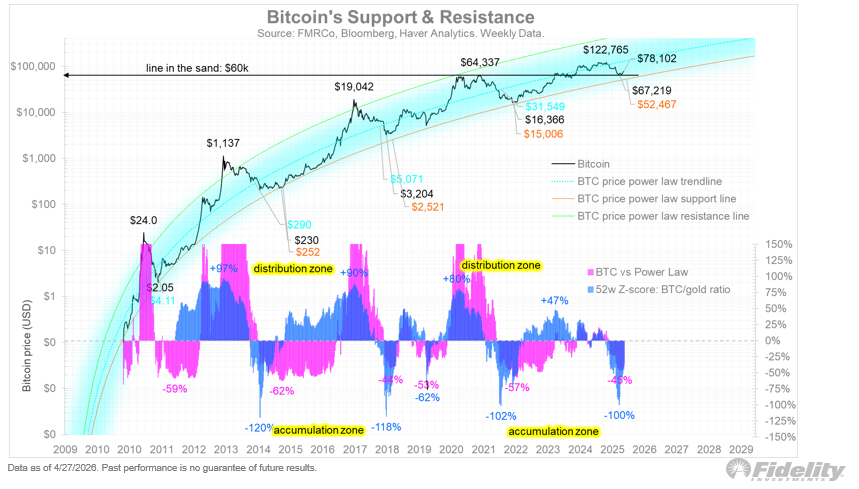
I continue to watch Bitcoin here following its mild winter from $126k to $60k. Its momentum and Sharpe Ratio continues to improve vs gold and other asset classes (including commodities). There has been a clear rotation away from gold ETPs back into Bitcoin ETPs.
While Bitcoin’s true believers say that you should never sell, for me Bitcoin is one of many assets to choose from on the 60/20/20 menu, and there are levels at which Bitcoin makes sense and at which it doesn’t. Per the chart below, which shows the detrended gold/Bitcoin ratio in blue and the spread between Bitcoin and its power law in pink, at the recent low we got a double-accumulation signal. If the bear flag in the earlier chart gets rejected by new highs, the next bull may be underway.
@Sykodelic_ Terrible news. But all too common these days. Many in my friends circle have had this happen. But all of them tried again and have been successful! Sending love from Texas
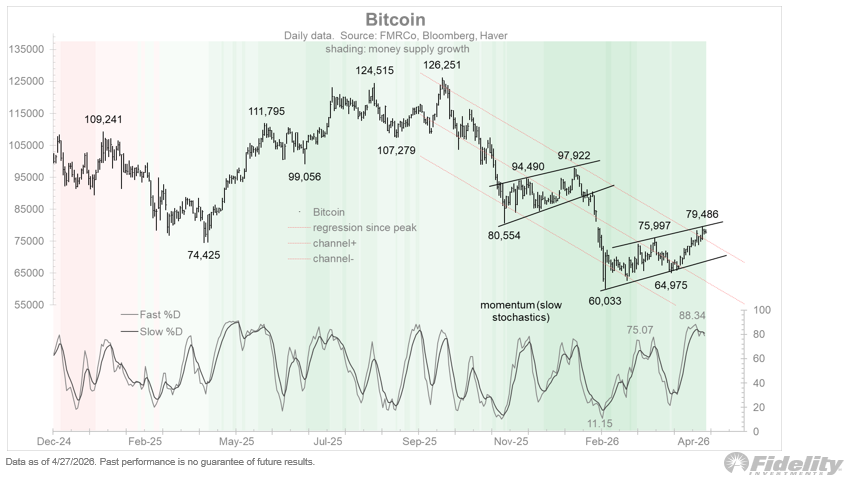
Bitcoin also continues to show resilience as it tests the upper bounds of a potential bear flag. Technical Analysis 101 states that when bear market rallies get overbought (per the stochastics below), it’s usually the kiss of death and time to sell. However, during bull markets overbought momentum means that the market is strong and likely to stay strong. My conclusion is that if Bitcoin cannot be pulled down by this current combination of overbought momentum and trendline resistance, then this is an emerging bull market and not a bear market rally. That’s been my hunch all along and it may be about to get confirmed. More on this later.
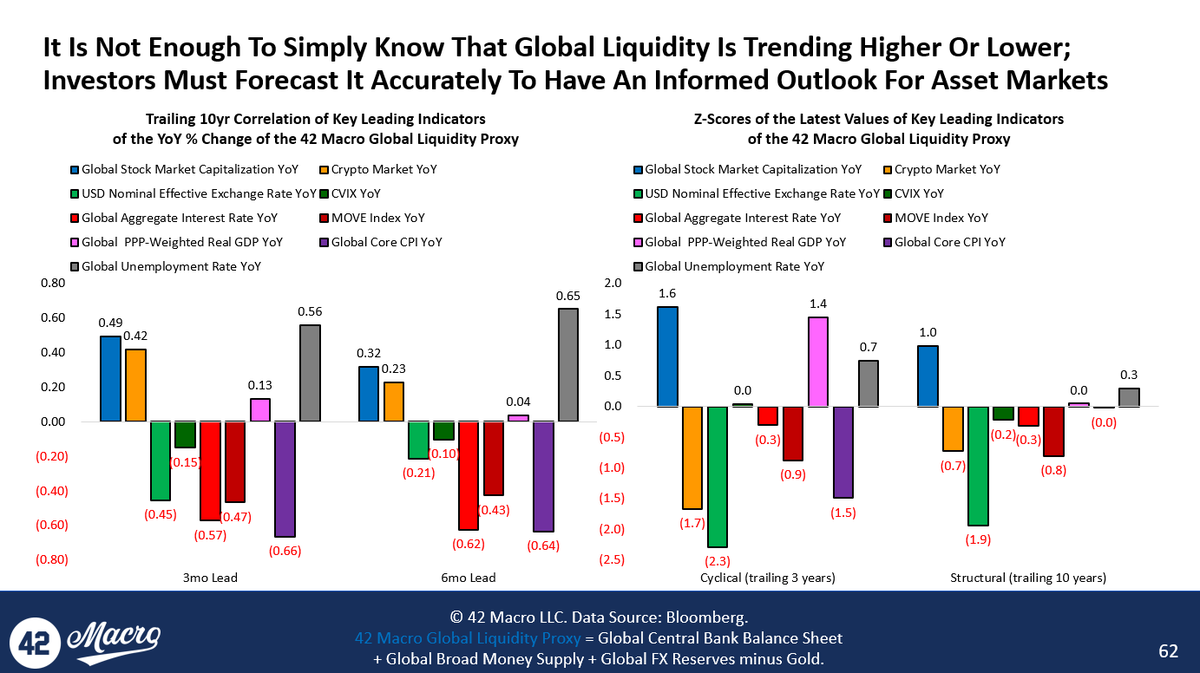
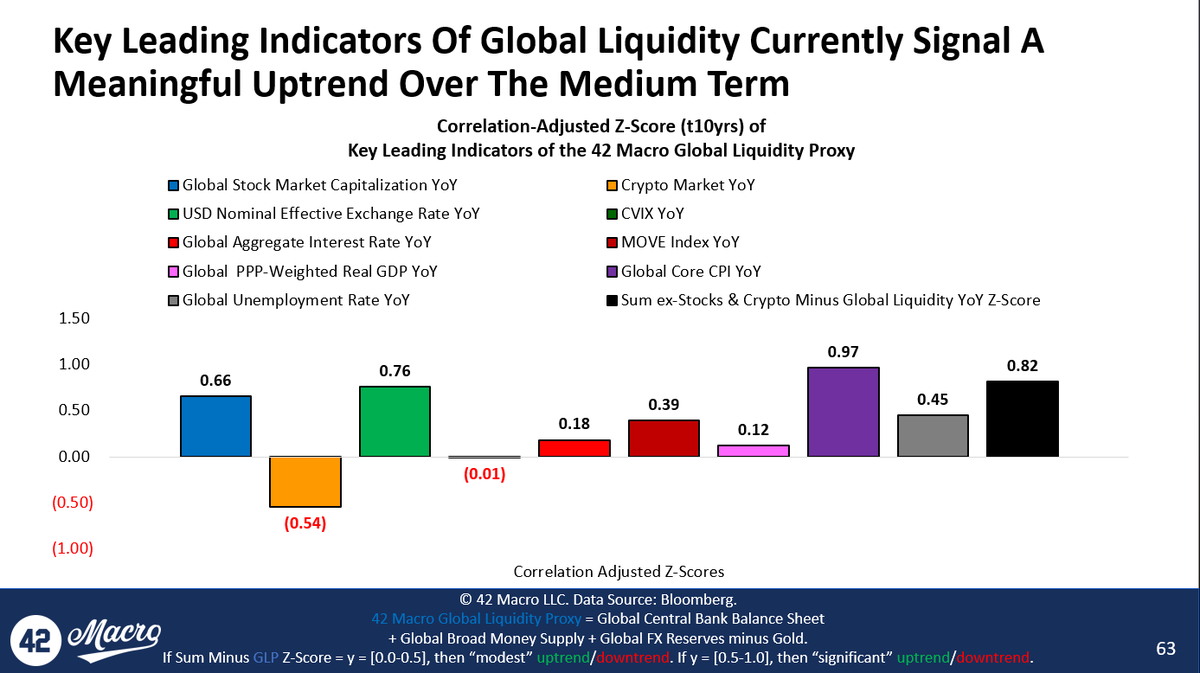
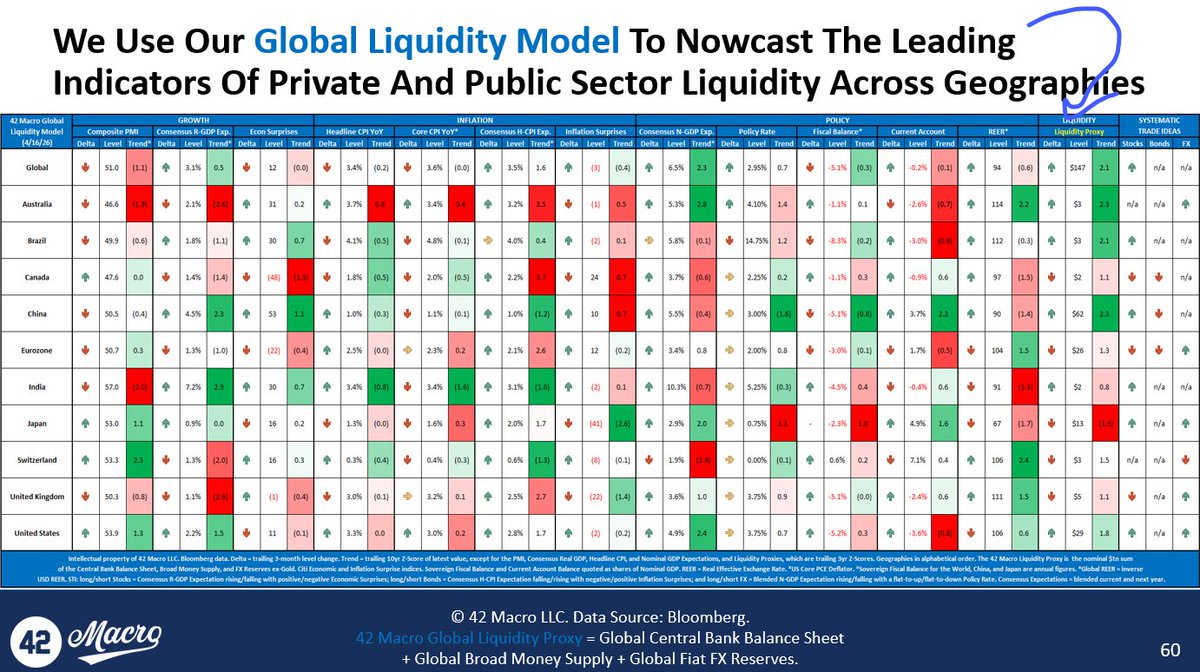
LIQUIDITY: You don't want to make a career being on the other side of the great @crossbordercap's views on the liquidity cycle. That said, our Global Liquidity Model agrees with our friend @RaoulGMI in the debate below.
The gap between central bank liquidity and the collateral multiplier just hit its widest point since April 2025.
In April 2025 that reading coincided with an 18% SPX drawdown. The current equity decline is around a third of that. So either the collateral stress resolves fast, or equities haven't finished repricing.
Best concise explanation of the geopolitical chess match unfolding between US, Iran, Russia, and China with regards to oil.
"You can take Iran's oil offline & Russia has all the power. You can take Russia offline & control Iran...but if you pick a fight with either, you blow up the oil market"
Blow up oil market = blow up treasury market = blow up government's ability to fund itself.
How real bottoms form.
People want to know if this is the bottom. The truth is that bottoms are not single candles. They are structures. They form slowly. They take effort. And they force you to read the chart without jumping ahead of it.
Right now price is still trapped inside the full range of the February 5 down candle. That single candle has contained price for almost a month. Until we break out of it, everything that happens inside is just noise. Even if the low is already in, structure still needs time to develop.
Look at the chart. The bounce from 59.9 has only taken us into the lower part of the range (top of the last capitulation candle) and into some early moving average resistance. That is normal. A market that just dropped from 98k to 59k is not going to reclaim higher timeframe levels in a straight line.
If this is the early stage of a bottoming process, the signs will always show up in the same places. Key horizontal levels. Key reclaim points. Key acceptance zones. And whether those levels fail or hold on higher timeframes.
The first chart shows the zone we are stuck in. This is your candle range. Until price escapes the full body and reclaims it, there is no thought of a structural shift. Bulls need to take back that zone and hold above it. Not wick above it. Hold above it. If price breaks out but cannot accept at the new level, that is not a breakout. It is a trap.
The second chart shows a more typical bottom. A large selloff. A range that forms. A slow reclaim of lost ground. One level at a time. Each level becomes a test. The market either accepts the reclaim, or you get a swing failure pattern that rejects and sends the price lower. That slow crawl is common because bottoms form when buyers gradually prove they are willing to absorb the supply that forced the initial drop.
The third chart shows the rare version. The V type. These happen when you get a violent move down followed by immediate defense of the wick lows and the close. Notice how clean the stepping structure is. Price fights through each area of resistance. It does not teleport. It grinds. It reclaims. It accepts. Then moves to the next level. That is the clue for a real V-bottom. Not the violence of the initial bounce, but the calm strength that follows.
In both versions, the key is the same. Horizontal levels. Are they reclaimed. Does price accept at the new level. Or do you get rejection or a higher timeframe swing failure pattern.
This is why the next stretch matters. A move into 74 to 76 will tell you who is in control. A push into 78 to 80 tells you how much supply is left. A test of 83 tells you if the deeper levels are being defended. Acceptance at any of these opens the door to the next. Rejection or failure at any of these warns you the bottom still needs more time or lower levels.
Bottoms are built by watching the reaction at each step. That is the entire game.
You do not predict them. You read them.
If this is going to be a V type, you will see clean stepping. If this is going to be a range type, you will see sweeps, failed breakdowns, and slow absorption.
If this is not the bottom, you will see failed acceptance at the key reclaim zones.
The chart will tell you everything if you stop searching for a hero candle and start focusing on structure. Most traders look for magic instead of levels. But it has always been the same. A real bottom reveals itself one reclaim at a time.
Watch the levels. Watch acceptance. Watch the reactions. Do that and won't get caught offside with a bias, do that and the market will show you the bottom long before the crowd sees it.