It's official.
MicroStrategy, $MSTR, is now facing its biggest unrealized loss in history, at -$10.8 billion.
In other words, after 6 years of buying Bitcoin, the company is now down -17% on its position.
By comparison, the S&P 500 is up +116% over this same timeframe.
Since MicroStrategy sold 32 Bitcoin at $77,135 per coin, their positions has lost -$11.8 billion in value.
This puts MicroStrategy's stock, $MSTR, down -77% since its record high.
Bear market is an understatement.
actually believe that more people are sidelined on this $HYPE move than prior uptrends
this current uptrend ppl are scarred by crypto bear markets & by BTC & ETH showing weakness consistently, it would be very anomalous for a cryptocurrency to make new all time highs while everything else is in the gutters, so think a lot of people are waiting for bitcoin to put in a lower low to buy in size & don't think they've allocated aggressively during this move up
believe that bottom was put in when hyperliquid stayed > $20 while bitcoin went to $60k from $80k, & that we've actually onboarded a lot more tradfi capital past few months who have seen the protocol's trading volumes of stocks and commodities keep increasing, while crypto regulatory environment continues to improve in Washington DC with Clarity Act progression
people will chase buying spot if it holds > $50 & we will see price discovery at the same time as SpaceX IPO is happening IMO
I made a new investment which is called $nock
It benefits from 2 narratives that will do will in the short-mid term which is privacy and verifiable compute
Most of these features will go live soon which reminds of buying $tao before subnets went live at $50
Hoping to see a 5-10x from here especially as core features slowly start to roll out
Leopold Aschenbrenner says $NVDA, $AMD, $AVGO is going to crash!!
He's short GPU chips, long physical infrastructure.
Over 60% of the portfolio is put options against AI hardware: NVDA, AMD, SMH, AVGO, ORCL.
His two largest longs are Bloom Energy (6.42%, $878M) and SanDisk (5.30%, $724M). He also added 1.07M shares of CoreWeave in Q1.
Aschenbrenner wrote "Situational Awareness" so he's not bearish on AI. He's bearish on the current valuation of the compute layer specifically, and bullish on where the physical bottleneck actually is.
The scarcity is shifting. GPUs are increasingly abundant. What's scarce is the power to run them and the storage to feed them. CoreWeave's CFO flagged this explicitly in Q1 earnings, power shell capacity is the binding constraint on growth, not chips.
The fund exited Intel calls entirely (was 13% of portfolio). Trimmed Bloom Energy by 3.59M shares after a 1,190% run. Moved out of CoreWeave options and into the underlying stock.
He also holds paired calls AND puts on MU and TSM, not a directional bet, a volatility bet. He thinks those names are going to move hard, he just doesn't know which way.
Whether you agree with the trade or not, this is one of the more structurally coherent AI portfolios disclosed so far.
If you're in Crypto and you're not bullish on Hyperliquid after reading this article you should really leave and go do something else.
https://t.co/BJlMIWhosG
I sat down with @CryptoHayes to discuss the Iran conflict, bitcoin, gold, oil, inflation, deflation, decentralized exchanges, prediction markets, privacy coins, and why he thinks insider trading should be legal.
YouTube: https://t.co/CDTghhi6zI
Spotify: https://t.co/TdUvKKpGic
Apple: https://t.co/PGofF8MRtA
TIMESTAMPS:
0:00 - Intro
0:49 - Iran war & oil market reaction
5:30 - Inflation vs deflation breakdown
7:42 - Why the Fed will always print money
9:08 - Gold vs bitcoin & global trade shift
14:20 - Arthur Hayes portfolio strategy
17:54 - Hyperliquid & the future of trading
24:20 - Insider trading should be legal?
27:59 - Why bitcoin doesn’t need institutions
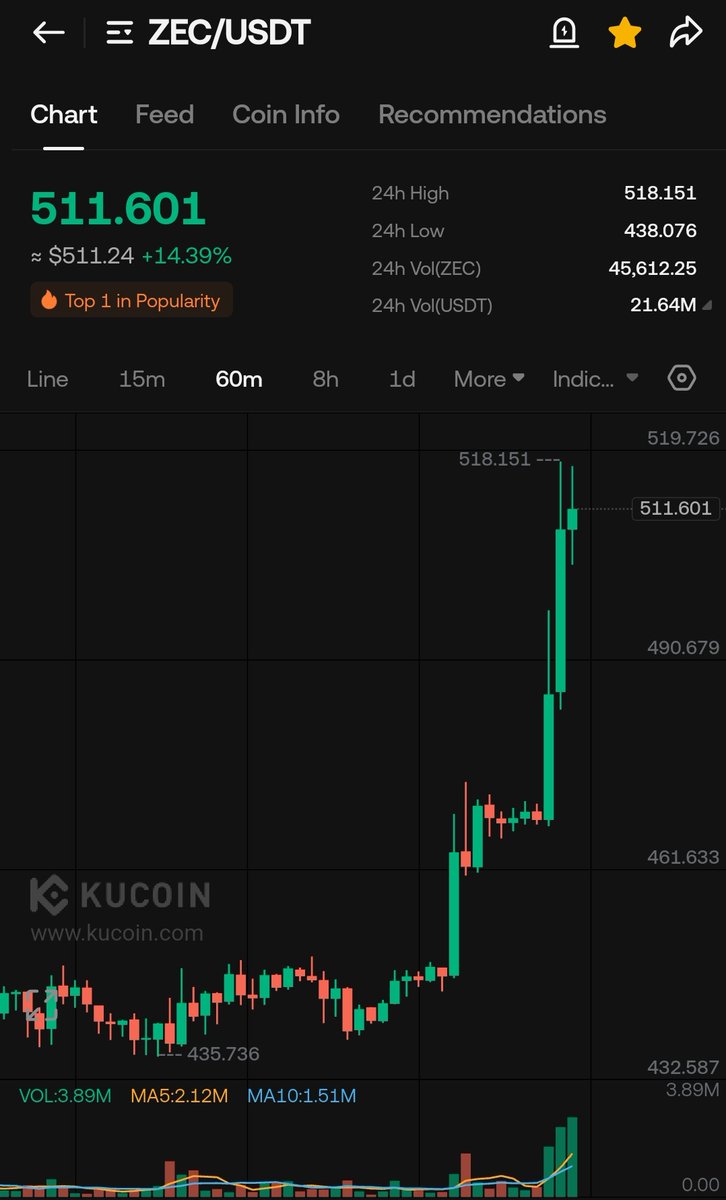
32:09 - Zcash & privacy in crypto
35:23 - What Arthur is bearish on in crypto
40:30 - How big Hyperliquid can get
42:24 - Will prediction markets be successful?
46:45 - Final market outlook
$BTC update:
Another disappointing close
I think even if you're an aggressive bull you'd wanna see a close above at least $71k
Otherwise you're just buying slow bleed
I'm not in a rush so I'm waiting for a deeper discount ($42k) or a market structure shift (above $86k)
Convergence, commoditzation, compression and reflexivity - the 4 horsemen of the data center buildout apocalypse.
DeepSeek V4 launches mid-February 2026 1T parameters, 1M token context, 3 architectural innovations @ 10-40x lower than Western Comps $NVDA https://t.co/78IwAQx6yz
Great article comparing hyperliquid to the world’s largest metals derivatives exchange and how they performed during the silver crash.
Honestly incredible results for a product that’s a month or two old.
Hyperliquid
@CryptoMichNL It's the lowest ever vs gold? No its not and not by a long shot, bitcoin spent half of 2023 with a lower valuation against gold, prior to that there are far more examples, your posts are nonsense.
🎆FIREWORKS COMING SOON🎆
#Bitcoin has been consolidating in a triangle for 2 months now and it's reaching the apex.
Expansion follows contraction. A break of the triangle will likely see a 5%+ move.
Watch for a break 👀
Eye-opening conversation with crypto veteran @CryptoHayes!
-- Bull Market or Bear Market? #crypto
-- The Fed Will Print Trillions 😳
-- "#Bitcoin to $500k"
-- How Much $ETH Do You Need To Become A Millionaire?
👉 Watch FULL: https://t.co/kzf4Gt8CgS
TLDR: Stack cash and buy in September/October 2026 and sell in November 2027
Every single midterm election year EVER had negative S&P 500 returns and every single post midterm election year had the biggest move of every single presidential term
Based on historical data for the S&P 500, the 12 months leading up to a U.S. midterm election has historically been the weakest period in the four-year presidential cycle.
The data below shows the maximum drawdown reached during the respective midterm election years.
| 1950 | -12.0 |
| 1954 | -4.4 |
| 1958 | -4.4 |
| 1962 | -26.4 |
| 1966 | -20.2 |
| 1970 | -25.0 |
| 1974 | -35.9 |
| 1978 | -12.8 |
| 1982 | -13.5 |
| 1986 | -9.4 |
| 1990 | -19.2 |
| 1994 | -8.5 |
| 1998 | -19.2 |
| 2002 | -33.0 |
| 2006 | -7.5 |
| 2010 | -15.6 |
| 2014 | -7.3 |
| 2018 | -19.4 |
| 2022 | -24.5 |
| Average | -16.2% |
Note on the Data: The drawdown percentage above represents the largest decline from a peak that occurred within the midterm election year. For most cycles, this drawdown happens in the 12 months leading up to the election.
Historically, the low point for the S&P 500 during the midterm election cycle is reached in the fourth quarter (Q4) of the midterm year, typically in September or October, just before or right around the election day in early November.
Interestingly this also coincides with every single crypto bear market 🤔