💵 "Not QE, QE" has officially started
A liquidity injection that could total up to $842bn from the US Treasury General Account began this week.
Functionally, this is similar to Quantitative Easing, but on a temporary basis.
Here's everything that is happening, in simple terms...
From my understanding, the official "debt ceiling-induced" Treasury General Account (TGA) drawdown began on Wednesday February 12.
As the US Government's $36 trillion debt limit is now binding, the Treasury cannot issue "new" debt.
So, it is being forced to use cash from the TGA to fund spending.
This is a liquidity injection, flooding the market with "new" liquidity and pushing up bank reserves.
This train is now in motion and will not stop until lawmakers come to a new debt ceiling agreement (probably involving raising or suspending the ceiling).
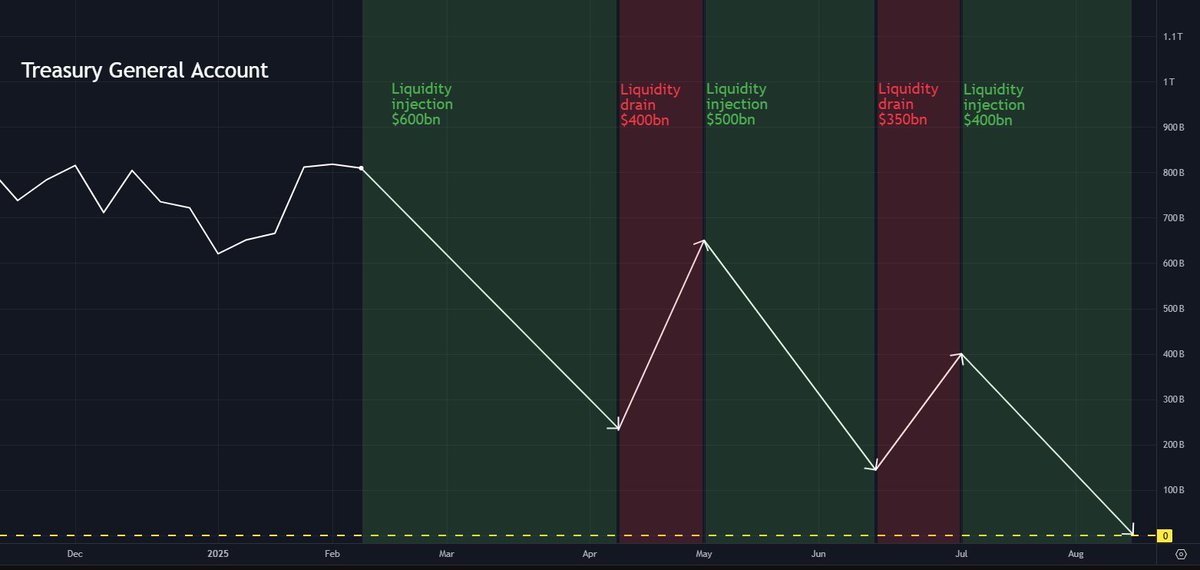
On Tuesday February 11, the TGA balance stood at $842bn.
So, the potential maximum length of the train tracks is $842bn.
My rough estimated path for the train is this:
I estimate the first "portion" of this drawdown will see a liquidity injection in the region of $600bn between February 12 and April 11, before taxes will temporarily fill up the TGA.
However, the most important metric to follow to determine any potential impact on markets is the "net" liquidity injection from all Federal Reserve sources.
This will very likely will be lower than $600bn.
For two reasons:
1⃣ QT continues
The Federal Reserve is continuing with its Quantitative Tightening regime.
This continues at a pace of roughly $55bn per month.
This is a liquidity drain, as the Fed allows assets on its balance sheet to mature without reinvesting the proceeds, effectively shifting them back to the market to absorb.
I think it is unlikely the Fed will stop QT at the next FOMC meeting on March 19.
So, the total liquidity drain from QT will probably be roughly $110bn over the duration of this first portion of the TGA drawdown.
2⃣ Reverse Repo usage may increase
Due to the debt-ceiling dynamics and the rules the Treasury must follow, we are likely to see "net negative T-bill issuance".
This means the Treasury will issue fewer T-bills than previously planned, reducing the overall supply available to the market.
The Treasury has already begun to trim supply of bills auctions.
If the debt-ceiling deadlock persists, T-bill issuance will likely continue to decline, making bills increasingly scarce.
This may incentivize money market funds to park cash in the Fed's Reverse Repo, potentially pushing this chart up, or least stalling its downward momentum.
Reverse Repo usage increasing would be a liquidity drain, as money would be moving away from markets and into the Reverse Repo facility at the Fed.
So, watching the Reverse Repo will also be key to determining the "net" liquidity injection from Federal Reserve sources.
The total "net" liquidity injection will be reflected in the chart below.
This chart increased by around $50bn this past week.
I'll continue to post updates here on X.
🤔 When will a new debt ceiling agreement be reached?
It doesn't look like a resolution to the debt ceiling showdown will be coming anytime soon.
On Wednesday, House Republicans offered up a plan to enact trillions of dollars in tax cuts and raise the debt ceiling.
Passing this measure will be tough however, given the Republicans' fractious and narrow majority.
Democrats are expected to be unified in opposition.
This comes down on the shoulders of House Speaker Mike Johnson, as he attempts to rally lawmakers behind the plan.
The problem is that a relatively large group of very conservative Republicans are opposed to raising the debt ceiling on principle and have never voted to support an increase.
Their leaders have made the point that even a call from the President won’t sway some of these members.
Previous debt ceiling increases have required bipartisan support.