🚨 BITCOIN IS HANGING ON THE 200 WEEK MOVING AVERAGE.
This is the line that held every bear market before.
Right now price is sitting right on it near 62K.
If it breaks, it can get ugly fast.
The support ladder below.
• 250W near $58K,000: Likely.
• 300W near $54K,000: Possible.
• 350W near $48K,000: Unlikely, but BIG opportunity.
This is exactly the zone I have been mapping for my $20,000,000 Bitcoin trade.
The sheer size of the Pacific Ocean, and the interconnectedness of the world’s weather systems, means that each El Niño causes a vast redistribution of heat and moisture across the planet. One result is to make the world warmer https://t.co/Cc325v5WHr
@sanjaygala Goldman seeing Cohort 8 progressing better with 11-14 patients pretreated on sirolimus, SRP-1001 and SRP-1003 data coming second half, and commercial recovery signal all in one note while the stock sits at $15 is the kind of disconnect that doesn't last forever.
🩸WARNING: EVERY BOJ RATE HIKE DUMPED BITCOIN!
March 2024: -18.49%
July 2024: -29.63%
Jan 2025: -32.64%
Dec 2025: -33.40%
Drawdowns getting bigger.
Next hike expected on June 16th.
Annual US inflation hit a three-year-high in May, according to new data, as many Americans struggle with elevated prices and high cost of living.
https://t.co/KNbyBYP50d
@bradmillscan Bitcoin’s regulatory path isn’t clear. The Democrats are trying to kill the CLARITY act. They will make crypto a centerpiece of their anti-Trump rhetoric for the midterms.
🌊 On 26 Dec 2004, a tsunami triggered one of the deadliest disasters of the 21st century. In its aftermath, the international community came together to increase resilience to natural hazards and reduce disaster risks.
https://t.co/MHIaJFFhVE #TsunamiDay#EarlyWarningsForAll
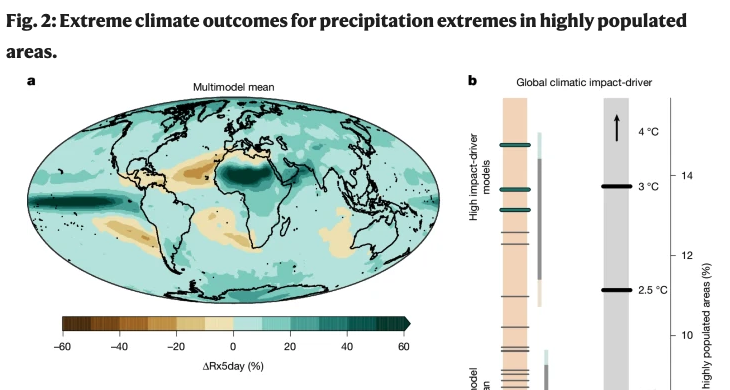
Most climate risk assessments treat 2°C of warming as a 'moderate' scenario. A new study in Nature shows this is a mistake.
2°C could produce outcomes worse than the average projection at 4°C.
The standard approach to worst-case climate planning: run dozens of climate models, average them, study what happens at high warming levels. That average becomes the benchmark for "bad." The problem is that averaging hides the range. At any given warming level, individual models diverge by enormous margins.
A team at the Helmholtz Centre for Environmental Research took 42 CMIP6 models, the same ones used in IPCC reports, and instead of averaging them, ranked them by projected impact on three sectors: heavy rainfall over populated areas, droughts across global breadbaskets, and fire weather in forests.
The food security results are the most striking. Across the world's major maize, wheat, soy, and rice regions, drought frequency at 2°C could increase by more than 50% or stay completely unchanged, depending on which model you believe. Ten of 42 models produce drought outcomes at 2°C that exceed the model average at 4°C. The spread between models at a single warming level is larger than the difference between the average at 2°C and the average at 4°C. The warming level matters less than which model turns out to be right.
For heavy rainfall in populated areas, the worst-case models at 2°C exceed the average at 3°C. For fire weather in forests, same pattern. In every sector they tested, the tail risk at moderate warming was worse than the central estimate at high warming.
The uncertainty comes almost entirely from structural differences between models, not natural climate variability. They tested this with large ensembles from individual models. Internal spread within a single model is small. Spread between models is enormous. The uncertainty could shrink with better models. But we currently don't know which model is closest to reality.
The conventional framing treats warming levels as a ladder. 1.5°C is manageable, 2°C is the guardrail, 3°C is dangerous, 4°C is catastrophic. This paper breaks that ladder. A 2°C world where the wrong model turns out to be right looks worse, for specific sectors, than a 4°C world described by the average model.
One finding offers some relief. Simultaneous worst cases across all sectors are unlikely, because the sectors depend on different climate variables and regions. But within any single sector, the range of plausible futures at 2°C is far wider than the gap between 2°C and 4°C averages.
The Paris Agreement targets 1.5°C, with 2°C as the upper bound. Global warming is approaching 1.5°C now. The assumption embedded in most planning is that staying below 2°C buys meaningful safety margin. This study suggests the margin may not exist.
The outcome is one draw from a distribution, and the tails at 2°C reach further than most risk frameworks account for.
Stocks rallied while oil and bond yields tumbled on Wednesday, on growing hopes that a U.S.-Iran peace deal could be imminent, and shares in chipmaker Nvidia fell in after-hours trade after the world's most valuable company released its latest results. https://t.co/sVhj2umkE0
$TJX shares jumped over 6% on first-quarter earnings beat and full-year guidance raise.
@NPetallides notes that analysts see the company as a defensive play and expect it to take market share from other department stores.
For more market news, tune in at: https://t.co/Rh7oMfelKL